
Name:
Class:
Date:
chapter 16
Indicate whether the statement is true or false.
1. In investment models, we typically must simulate the random investment weights
a.
True
b.
False
2. A common distribution for modeling product lifetimes is the binomial distribution
a.
True
b.
False
3. A key objective in cash flow models is often to determine the amount of debt that must be taken out to maintain a
minimum cash balance.
a.
True
b.
False
4. RISKMAX and RISKMIN are can be used to find the probability of meeting a given due date in a manufacturing model.
a.
True
b.
False
5. A @RISK output range allows us to obtain a summary chart that shows the entire simulated range at once.
a.
True
b.
False
6. In bidding models, the simulation input variable is the number of competitors who will bid.
a.
True
b.
False
7. We can use the RISKSIMTABLE function to summarize the results of a single simulation of product lifetime.
a.
True
b.
False
8. The @RISK function RISKDUNIFORM in the form = RISKDUNIFORM ({List}) generates a random member of a given
list, so that each member of the list has the same chance of being chosen.
a.
True
b.
False
9. RISKTARGET is a function that allows us to determine the cumulative probability of a particular value in an output
distribution, such as the probability of meeting a due date in manufacturing.
a.
True
b.
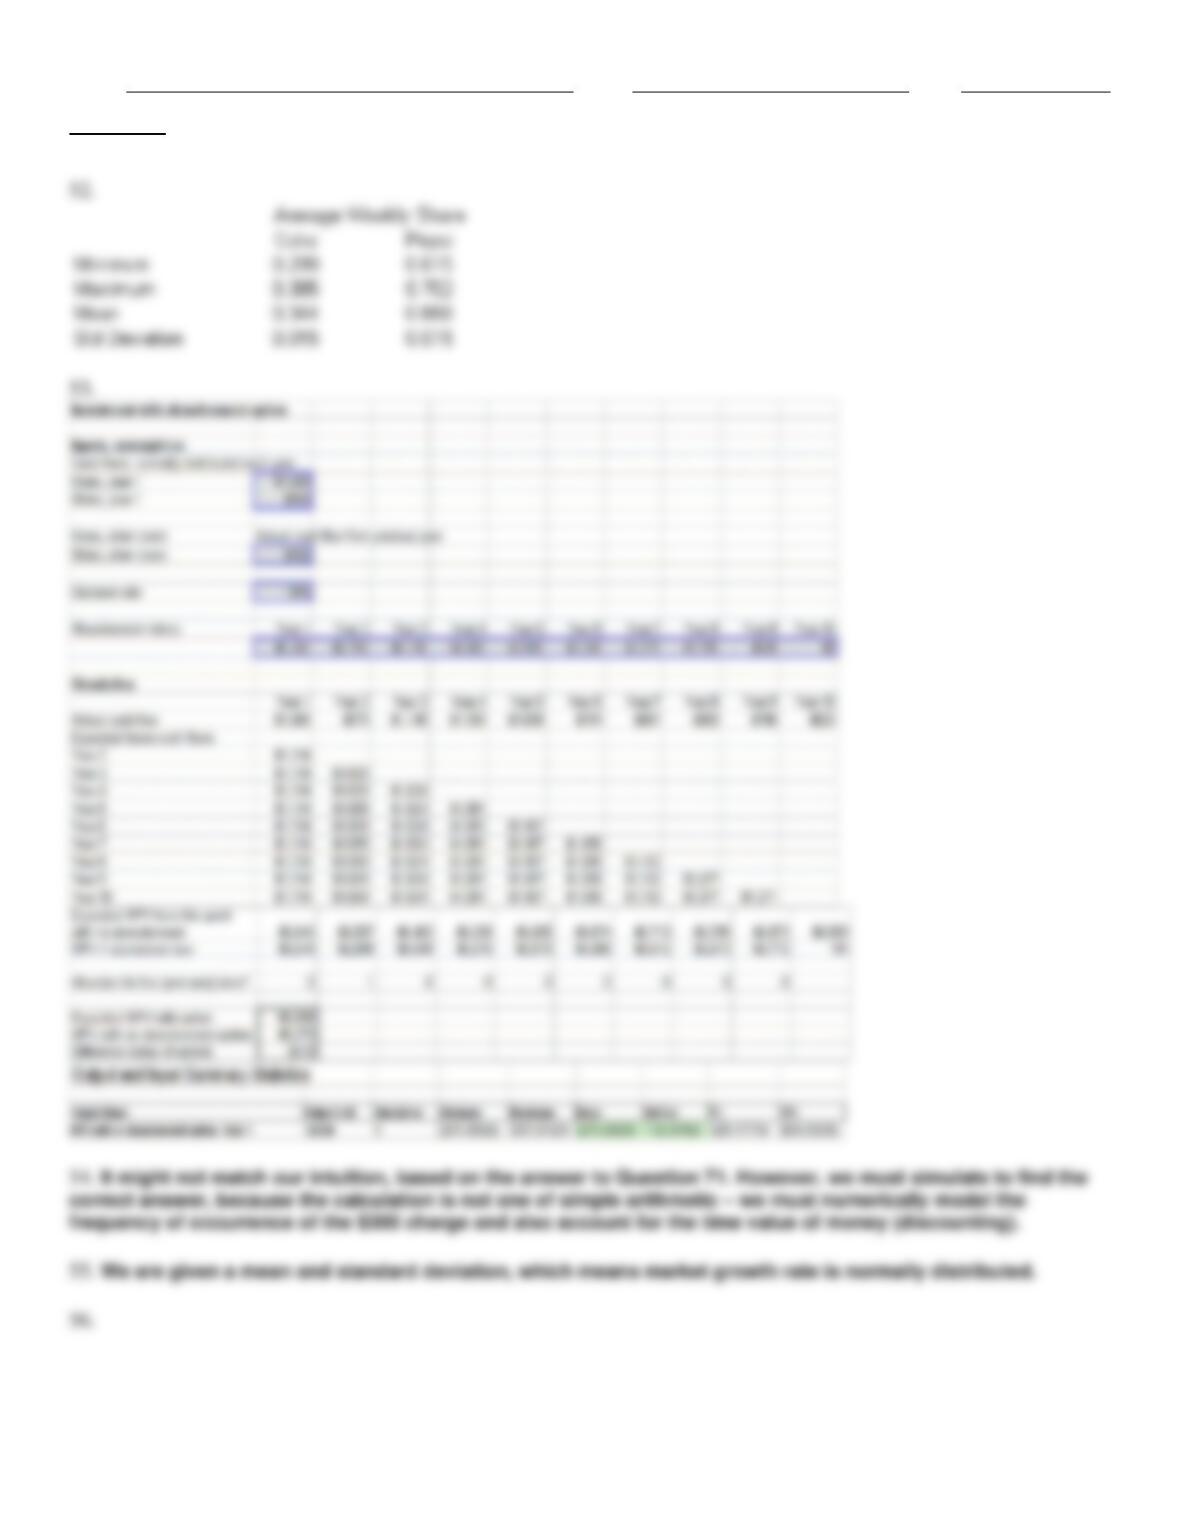
False
10. In financial simulation models, we are typically more interested in the expected NPV of a project than in the extremes
of the outcomes.
a.
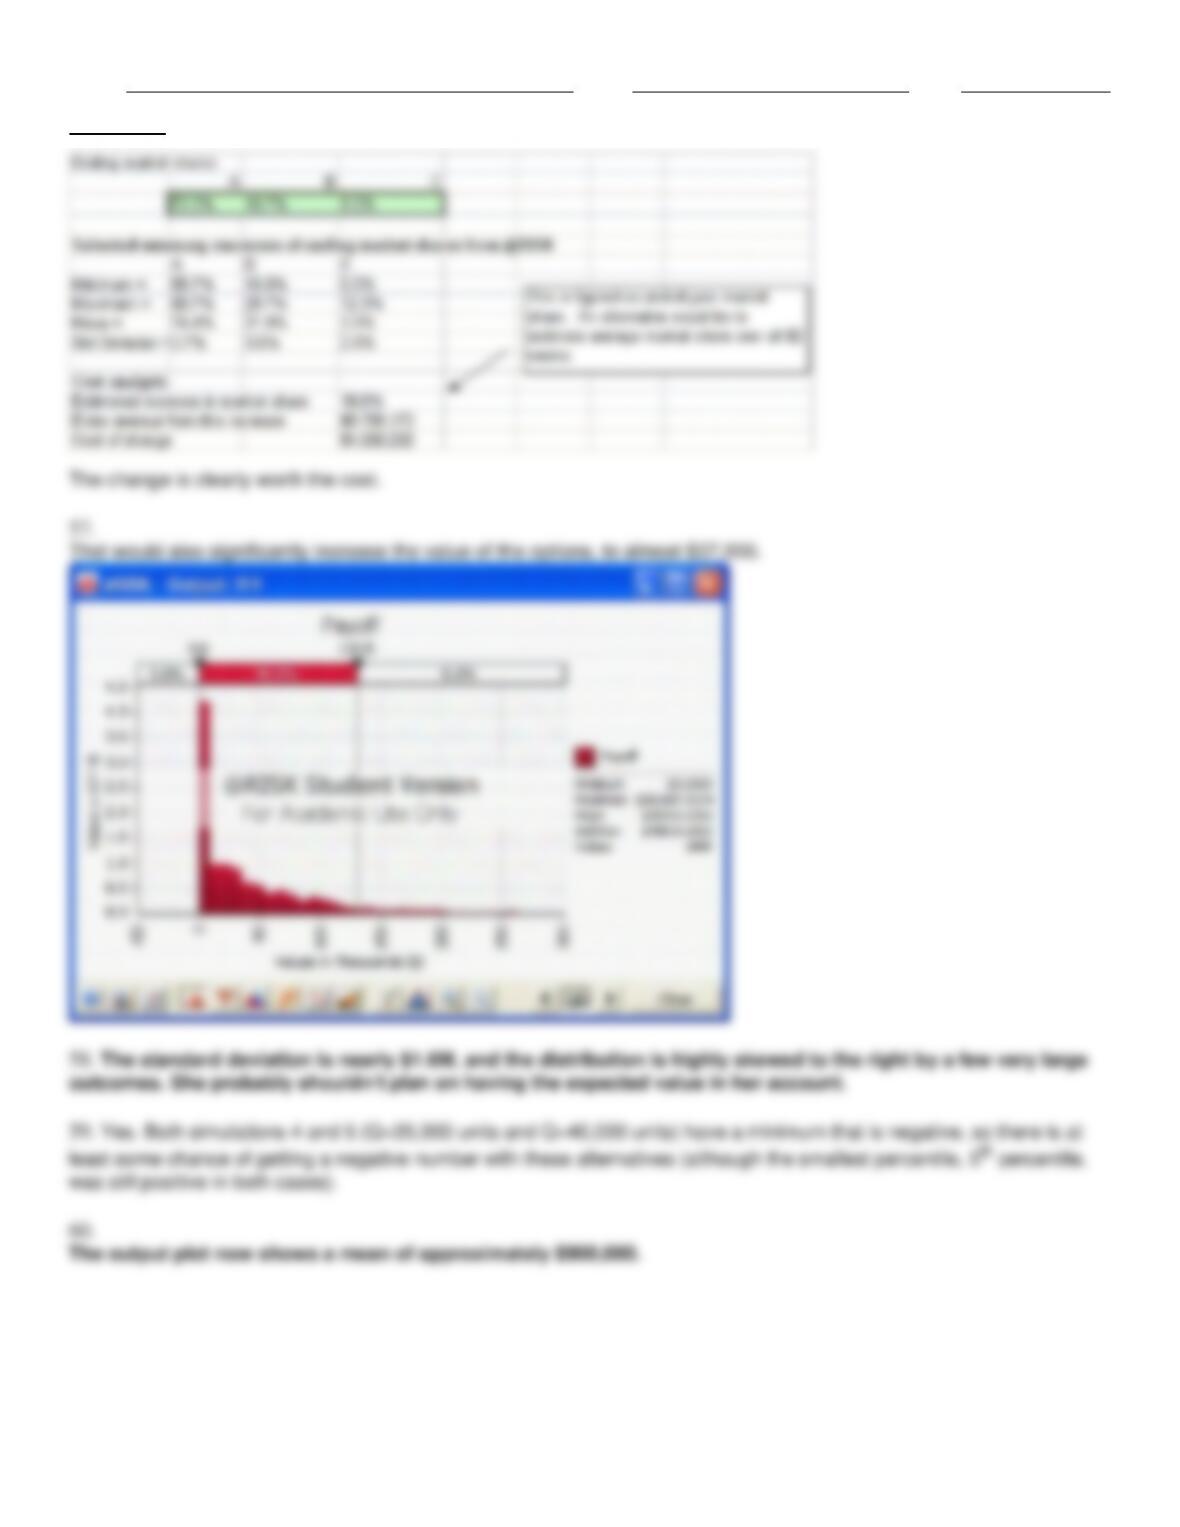
True
b.
False
11. The primary objective in simulation models of bidding for contracts is to determine the optimal bid.

Name:
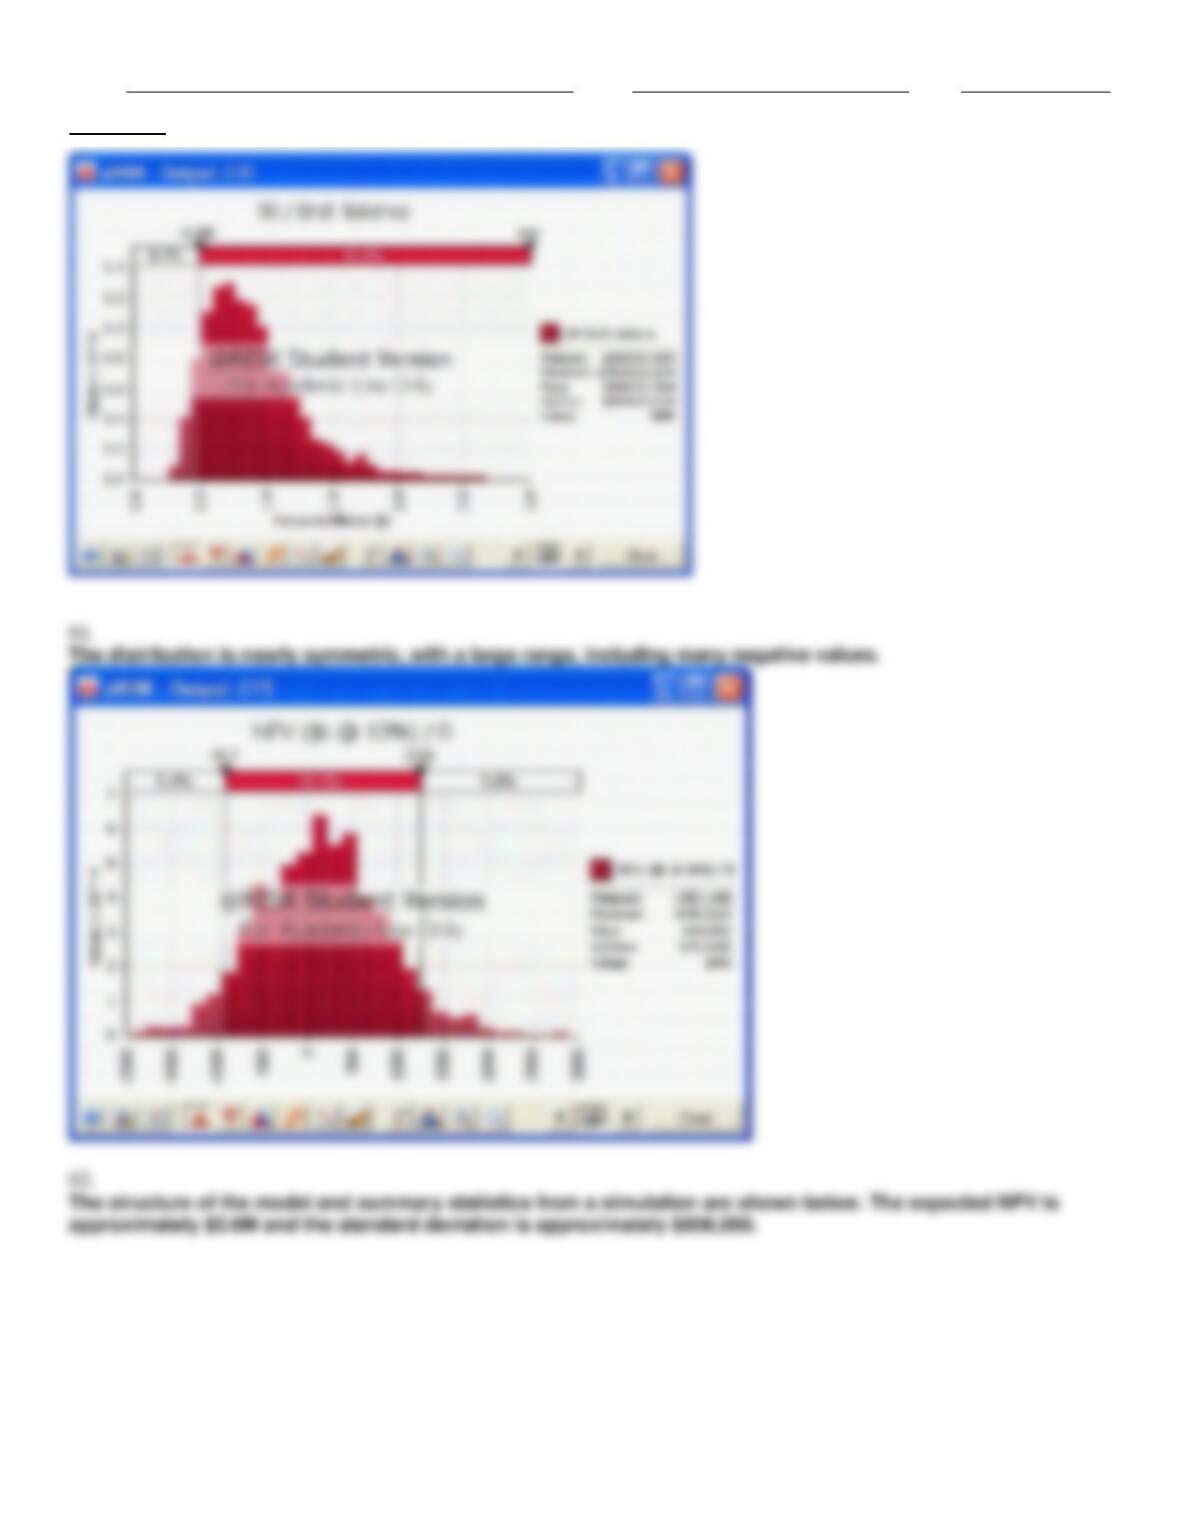
Class:
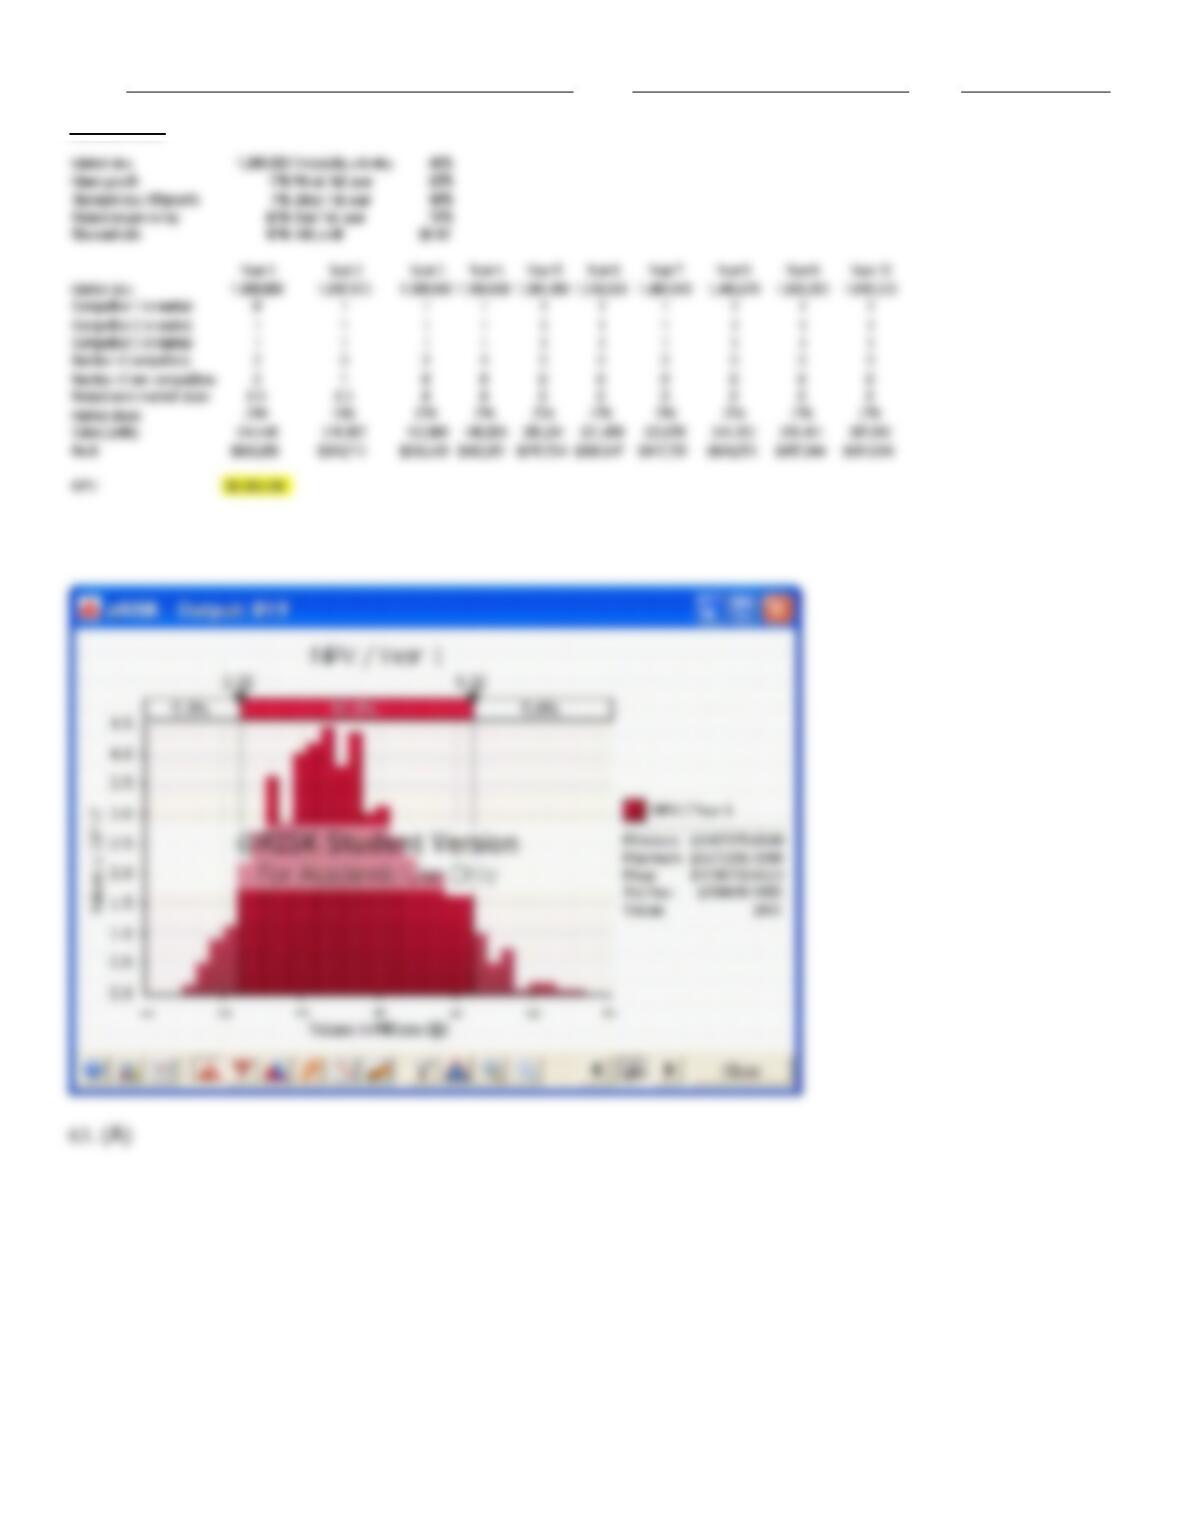
Date:
chapter 16
a.
True
b.
False
12. Churn is an example of the type of uncertain variable we deal with in financial models.
a.
True
b.
False
13. In a manufacturing setting, a discrete distribution is natural for modeling the number of days to produce a batch, and a
continuous distribution is appropriate for modeling the yield from a batch.
a.
True
b.
False
14. Uncertain timing and the events that follow in process modeling can be modeled using IF statements.
a.
True
b.
False
15. In a bidding model, once we have the bidding strategy that maximizes the expected profit, we no longer should
consider the bidders risk aversion.
a.
True
b.
False
16. In warranty cost models, the key input random variable is product lifetime.
a.
True
b.
False
17. In marketing models of customer loyalty, we are typically interested in modeling the rate of customer retention, called
churn.
a.
True
b.
False
18. A marketing simulation model can be used to determine the expected profit under uncertain customer loyalty, and
then we can use an optimization model to determine the optimal amount to spend on increasing customer loyalty.
a.
True
b.
False
19. A tornado chart lets us see which random input has the most effect on a specified output in a financial model.
a.
True
b.
False
20. In financial simulation models, the value at risk (VAR) is the 5th percentile of an output distribution, and it indicates
nearly the worst possible outcome.
a.
True
b.
False
21. Although we can determine the optimal bid and the expected profit from that bid in a bidding simulation, we usually
cannot determine the probability of winning.
a.
True

Name:
Class:
Date:
chapter 16
b.
False
22. Simulation applications involving games of chance are primarily for learning the background of simulation (e.g.,
modeling gambling casinos of Monte Carlo), since they are not business applications per se.
a.
True
b.
False
23. Using @RISK summary functions such as RISKMEAN, RISKPERCENTILE, and others allows us to capture
simulation results in the same worksheet as the simulation model.
a.
True
b.
False
24. We can use Excel’s RAND function inside an IF function to simulate whether some event occurs or does not occur.
a.
True
b.
False
25. In marketing and sales models, the primary issue is the uncertain amount of sales that can be obtained, given an
assumed timing.
a.
True
b.
False
Indicate the answer choice that best completes the statement or answers the question.
26. In a warranty cost modeling model, which of the following is a key input random variable?
a.
Warranty cost
b.
Warranty time limitation
c.
Lifetime of product
d.
Replacement cost of product
e.
All of these options
27. Financial analysts often investigate the value at risk (VAR) with simulation models. VAR is an indicator of:
a.
how much to bid for a project
b.
the expected amount of loss for a project
c.
what is nearly the worst possible outcome for a project
d.
the required amount of investment required for a project
e.
None of these options
28. The two random variables we typically simulate as inputs in bidding models are?
a.
Number of bidding competitors and bid amount
b.
Number of bidding competitors and bid profit
c.
Individual bid amounts and net bidding profits
d.
Mean number of bidding competitors and net bidding profit
e.
None of these options
29. Suppose we have a 0-1 output for whether a bidder wins a contract in a bidding model (0=bidder does not win
contract, and 1=bidder wins contract). From the mean of this output we can tell:

Name:
Class:
Date:
chapter 16
a.
the number of times the bidder wins the contract
b.
the number of times the bidder does not win the contract
c.
the probability that the bidder will win the contract
d.
the probability that the bidder will not win the contract
e.
None of these options
30. A key input variable in many marketing models of customer loyalty is the:
a.
Mean profit per customer
b.
Number of customers
c.
Churn rate
d.
Time horizon
e.
All of these options
31. Which of the following functions is often required in simulations where we must model a process over multiple time
periods and must deal with uncertain timing of events?
a.
RISKMIN
b.
RISKMAX
c.
NPV
d.
IF
e.
None of these options
32. Which of the following @RISK functions can be used to find the probability of a particular value in an output
distribution?
a.
RISKMIN
b.
RISKMAX
c.
RISKPERCENTILE
d.
RISKTARGET
e.
None of these options
33. Which of the following distributions is most likely to be used to develop a simulation model for estimating the time until
failure of a product in a simulation model?
a.
Binomial
b.
Gamma
c.
Normal
d.
Chi-square
34. The value at risk (VAR) is typically defined as the:
a.
5th percentile of NPV distribution
b.
10th percentile of NPV distribution
c.
50th percentile of NPV distribution
d.
90th percentile of NPV distribution
e.
95th percentile of NPV distribution
35. In investment models, a useful approach for generating future returns and inflation factors from historical data is:
a.
the NPV approach

Name:
Class:
Date:
chapter 16
b.
the scenario approach
c.
the averaging approach
d.
the trend analysis approach
e.
None of these options
36. Suppose we compare the difference between the NPV of a financial model in which the means are entered for all
input random variables and the NPV of a financial model in which the most likely values are entered for all input random
variables. If we see a large difference between the NPV’s, this illustrates:
a.
the value at risk (VAR)
b.
the effect of randomness
c.
the flaw of averages
d.
the bias of the analyst
e.
None of these options
37. Which of the following functions is not an @RISK statistical function?
a.
RISKMIN
b.
RISKMAX
c.
RISKPERCENTILE
d.
RISKSIMTABLE
e.
None of these options
38. Which of the following is typically not an application of simulation models?
a.
Operations models
b.
Financial models
c.
Marketing models
d.
Value of Information models
e.
None of these options
39. The main issue in marketing and sales models is:
a.
the amount invested in marketing
b.
the timing of marketing
c.
the profit from sales
d.
the timing of sales
e.
the tradeoff between marketing and sales
40. Which of the following is among the questions that financial analysts try to answer with simulation models?
a.
Mean and variance of a project NPV
b.
Probability that a project with have a negative NPV
c.
Probability that a company will have to borrow a certain amount during the next year
d.
Mean and variance of a company’s profit during the next fiscal year
e.
All of these options
41. Which of the following functions is not appropriate in cases where we run a single simulation?
a.
RISKMIN
b.
RISKMAX

Name:
Class:
Date:
chapter 16
c.
RISKPERCENTILE
d.
RISKSIMTABLE
e.
None of these options
42. The amount of variability of a financial output caused by different inputs can be investigated using:
a.
the NPV function
b.
a histogram of the NPV
c.
a tornado chart of NPV
d.
the value at risk (VAR)
e.
All of these options
43. Bidding for contracts is an example of which of the following types of simulation model application?
a.
Operations models
b.
Financial models
c.
Marketing models
d.
Games of chance
e.
None of these options
44. Which of the following are not among the marketing applications of simulation?
a.
The entry of new brands into the market
b.
Customer preferences for different attributes of products
c.
Brand-switching behavior of customers
d.
The effect of advertising on sales
e.
None of these options
45. Customer loyalty models are an example of which of the following types of simulation application?
a.
Operations models
b.
Financial models
c.
Marketing models
d.
Games of chance
e.
None of these options
46. In cash flow models, we are typically interested in investigating:
a.
the value at risk (VAR)
b.
the net present value (NPV)
c.
the amount of loans required to maintain a minimum cash balance
d.
the interest on loans taken out by a firm
e.
None of these options
47. In a marketing and sales model, which of the following might be a good choice for a discrete distribution to model the
random timing of sales?
a.
RAND()
b.
Normal distribution
c.
Binomial distribution
d.
Exponential distribution

Name:
Class:
Date:
chapter 16
e.
Poisson distribution
48. Cash balance models are an example of which of the following types of simulation application?
a.
Operations models
b.
Financial models
c.
Marketing models
d.
Games of chance
e.
None of these options
49. Which of the following is not among the financial applications where simulation can be applied?
a.
Future stock prices
b.
Customer preferences for different attributes of products
c.
Future interest rates
d.
Future cash flows
e.
None of these options
50. In a manufacturing model, we might simulate the number of days to produce a batch and the yield from each batch.
The number of days would typically be a ___________ distribution and the yield would be a ___________ distribution.
a.
Continuous, discrete
b.
Continuous, continuous
c.
Discrete, continuous
d.
Discrete, discrete
Amanda is a recent college graduate, and has just started her first job. She would like to know if she saves $5,000 per
year out of her salary over the next 30 years what the distribution of the value of her retirement fund after 30 years. She
has decided that she will invest all her money in the stock market that she estimates has a return that is normally
distributed with mean 12% per year and standard deviation 25%.
51. What is the standard deviation of the ending balance? What does the distribution look like now? What should Amanda
infer from this?
52. Suppose that Coke and Pepsi are fighting for the cola market. Each week each person in the market buys one case of
Coke or Pepsi. If the person’s last purchase was Coke, there is a 0.80 probability that this person’s next purchase will be
Coke; otherwise, it will be Pepsi. (We are considering only two brands in the market.) Similarly, if the person’s last
purchase was Pepsi, there is a 0.90 probability that this person’s next purchase will be Pepsi; otherwise, it will be Coke.
Currently half of all people purchase Coke, and the other half purchase Pepsi. Simulate one year of sales in the cola
market and estimate each company’s average weekly market share. Do this by assuming that the total market size is
fixed at 100 customers. (Hint: Use the RISKBINOMIAL function.)
You are considering a 10-year investment project. At present, the expected cash flow each year is $1000. Suppose,
however, that each year’s cash flow is normally distributed with mean equal to last year’s actual cash flow and standard
deviation $100. For example, suppose that the actual cash flow in year 1 is $1300. Then year 2 cash flow is normal with
mean $1300 and standard deviation $100. Also, at the end of year 1, your best guess is that each later year’s expected
cash flow will be $1300.
53. Estimate the mean and standard deviation of the NPV of this project. Assume that cash flows are discounted at a rate
of 10% per year.
Suppose that GM earns a $4000 profit each time a person buys a car. We want to determine how the expected profit
Name:
Class:
Date:
chapter 16
earned from a customer depends on the quality of GM’s cars. The customer is assumed to buy a new car every five
years, for a total of 10 cars through her lifetime. The customer will keep buying GM cars so long as they are satisfied with
them. The probability that the customer will be satisfied with her GM car is 80%. If she is not satisfied with her GM car,
she will buy another brand (we’ll call all other brands cumulatively “Toyota”). The probability that she is satisfied with
“Toyota” is 85%.
54. Does the answer to Question 72 match your intuition? Explain why or why not.
In this example we are estimating the net present value of introducing a new drug to market. We have the following
information about the market:
· The market size is 1,000,000 and is projected to grow at an average 5%, with a standard deviation of 1%, over the next
ten years.
· The market share captured at entry is projected to be between 20% and 70%, with most likely value 40%.
· Three competitors may enter the market in the future, with each one having a 40% probability of entry per year.
· For each new competitor per year, the market share goes down by 20%.
· The marginal profit per unit is $1.80.
· We want to evaluate the project over ten years, using a discount rate of 10%.
55. What is the appropriate distribution for the market growth rate?
Suppose that a recent study shows that each week each of 300 families buys a gallon of apple juice from company A, B,
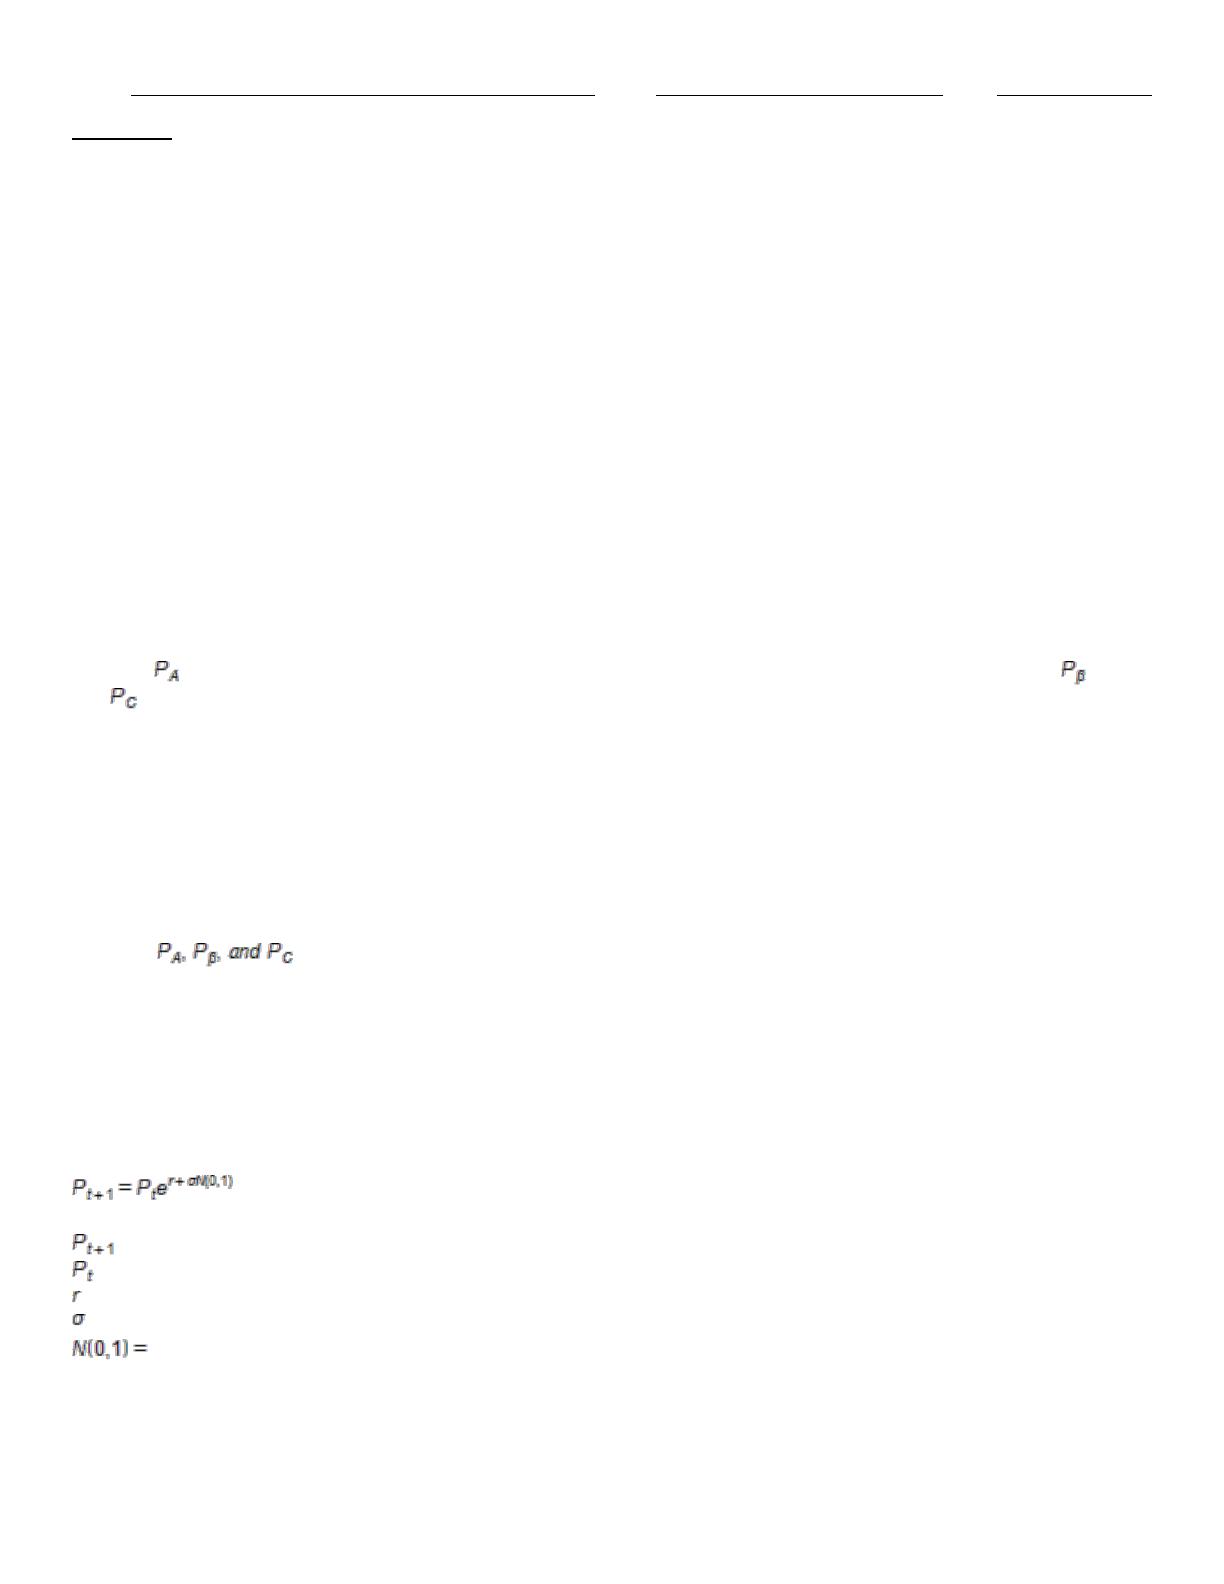
or C. Let denote the probability that a gallon produced by company A is of unsatisfactory quality, and define
and similarly for companies B and C. If the last gallon of juice purchased by a family is satisfactory, the next week they
will purchase a gallon of juice from the same company. If the last gallon of juice purchased by a family is not satisfactory,
then the family will purchase a gallon from a competitor. Consider one week in which A families have purchased juice A, B
families have purchased juice B, and C families have purchased juice C. Assume that families that switch brands during a
period are allocated to the remaining brands in a manner that is proportional to the current market shares of the other
brands. Thus, if a customer switches from brand A, there is probability B/(B + C) that he will switch to brand B and
probability C/(B + C) that he will switch to brand C. Suppose that the market is currently divided equally: 100 families for
each of the three brands.
56. Suppose a 1% increase in market share is worth $10,000 per week to company A. Company A believes that for a cost
of $1 million per year it can cut the percentage of unsatisfactory juice cartons in half. Is this worthwhile? (Use the same
values of as in Question 66.
An executive has been offered a compensation package that includes stock options. The current stock price is $30/share,
and she has been offered a call option on 2000 shares, which can be exercised five years from now at a price of
$42/share. Therefore, if the market price of the shares in five years is more than $42/share, she can buy 2000 shares at
$42/share, and then immediately sell the shares at the market price, earning a riskless profit. If the market price of the
shares was less than $42/share, she will obviously choose not to exercise the option, and would have zero profit.
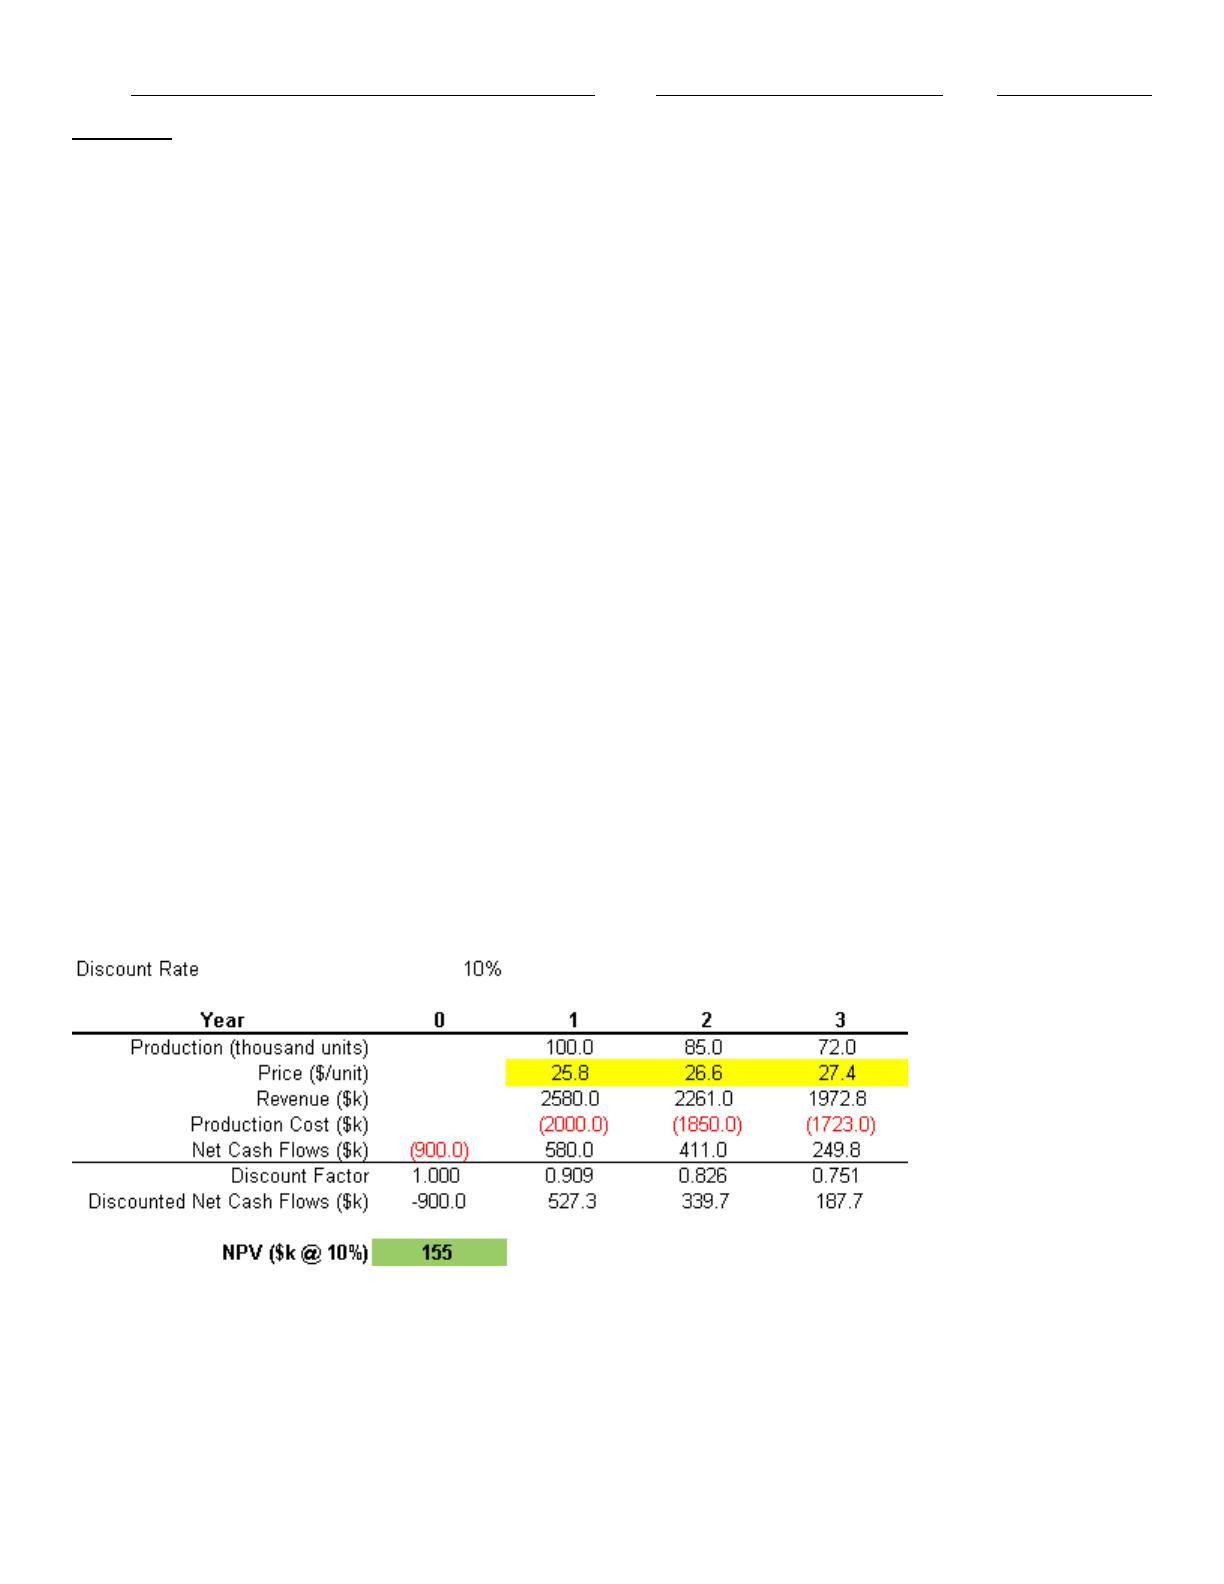
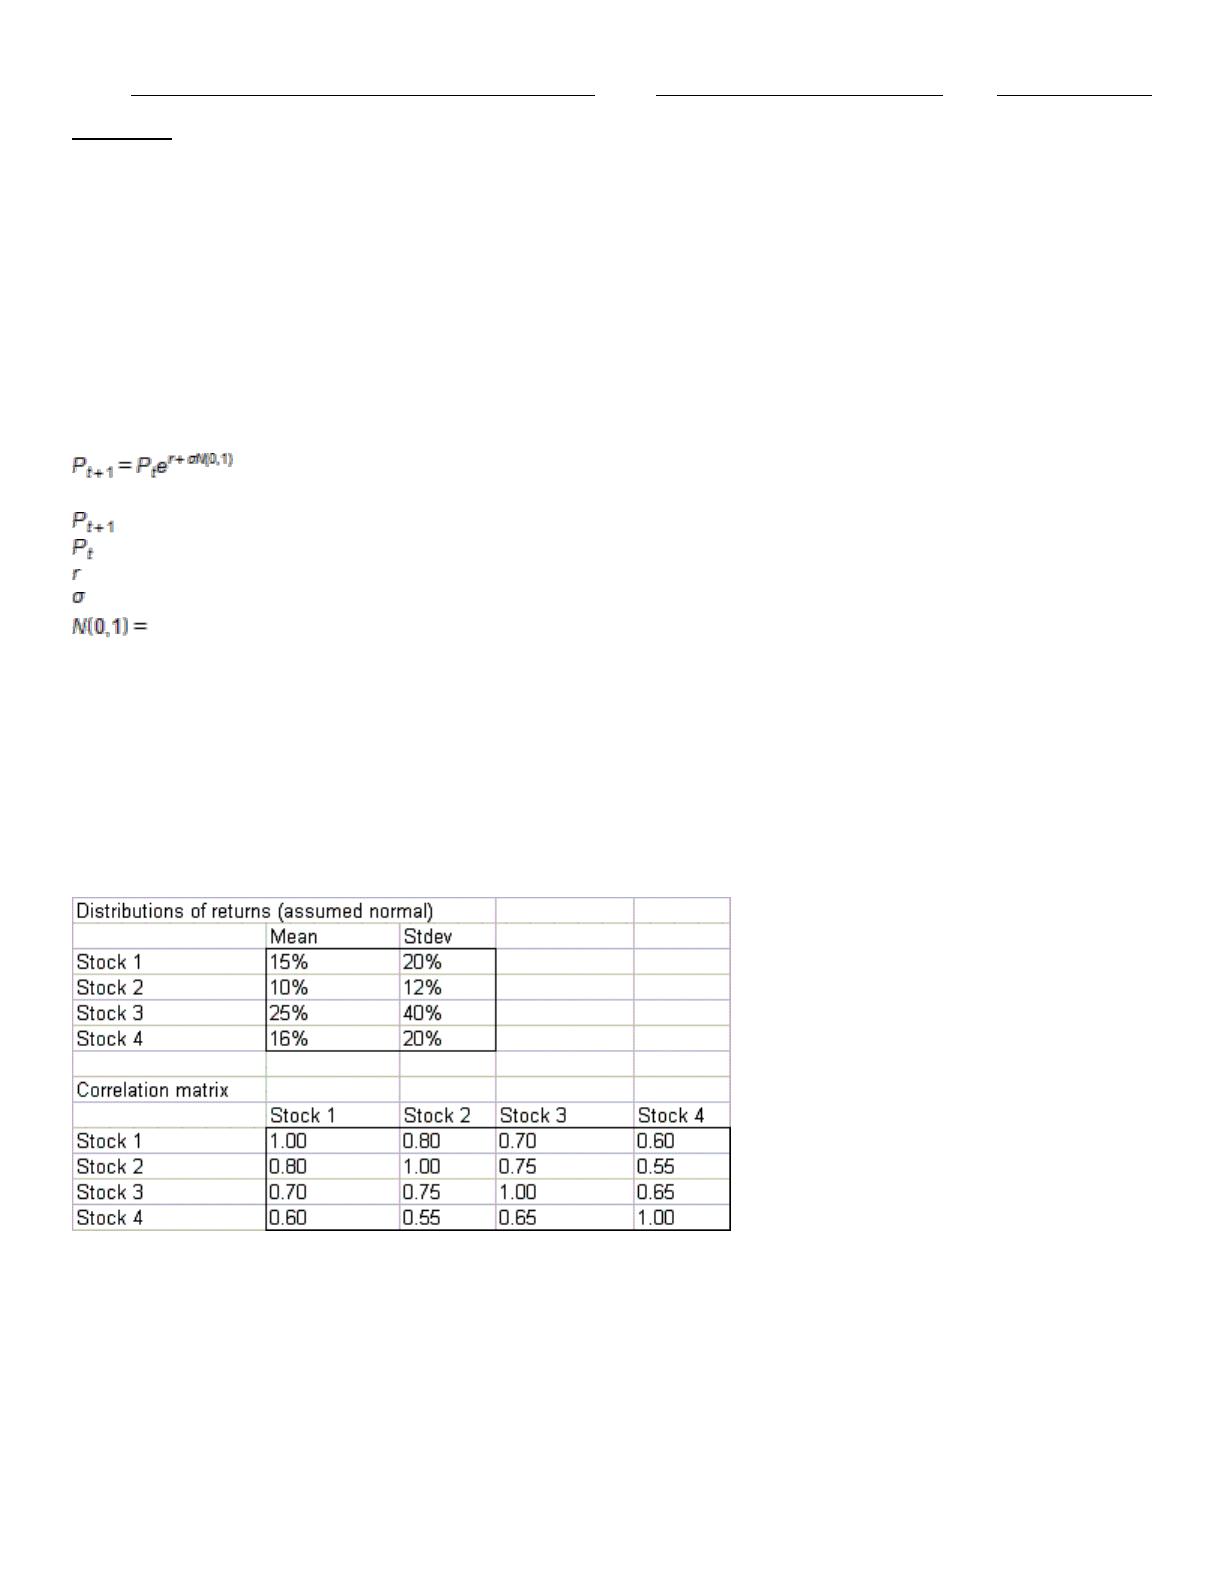
Assume the price of the stock can be modeled as exponential growth (compounding), which could be calculated as:
where,
stock price in next period (i.e., price next year)
current stock price
annual growth rate of the stock price, which has been 10%
annual volatility, which is estimated to be 18%
normal random variable with mean of zero and standard deviation of 1
57. The executive also fairly confident that the company really wants to hire her, and she thinks she may be able to
negotiate a lower strike price ($40) and a larger number of shares in the option (3,00 shares). What would be the value of
the options in that case?
Name:
Class:
Date:
chapter 16
Amanda is a recent college graduate, and has just started her first job. She would like to know if she saves $5,000 per
year out of her salary over the next 30 years what the distribution of the value of her retirement fund after 30 years. She
has decided that she will invest all her money in the stock market that she estimates has a return that is normally
distributed with mean 12% per year and standard deviation 25%.
58. What is the standard deviation of the ending balance? What does the distribution look like? What should Amanda infer
from this?
Suppose we want to choose capacity for a plant that will produce a new drug. In particular, we want to choose the
capacity that maximizes discounted expected profit over the next 10 years. We have the following information:
· Demand for the drug is expected to be normally distributed ˜ Normal (50,000, 12,000).
· A unit of capacity costs $16 to build.
· The number of units produced will equal the demand, up to capacity limits.
· The revenue per unit is $3.70 and the cost per unit is $0.20 (variable cost).
· The maintenance cost per unit of capacity is $0.40 (fixed cost).
· The discount rate is 10%.
59. Are there any simulations which indicated there was a chance of getting negative NPV? Briefly explain in one
sentence.
Amanda is a recent college graduate, and has just started her first job. She would like to know if she saves $5,000 per
year out of her salary over the next 30 years what the distribution of the value of her retirement fund after 30 years. She
has decided that she will invest all her money in the stock market that she estimates has a return that is normally
distributed with mean 12% per year and standard deviation 25%.
60. Next, suppose Amanda’s broker thinks the stock market may be too risky and has advised her to diversity by investing
some of her money in money market funds and bonds. He estimates that this will lower her expected annual return to
10% per year, but will also lower the standard deviation to 10%. What can she expect to have in her account after thirty
years under this investing strategy?
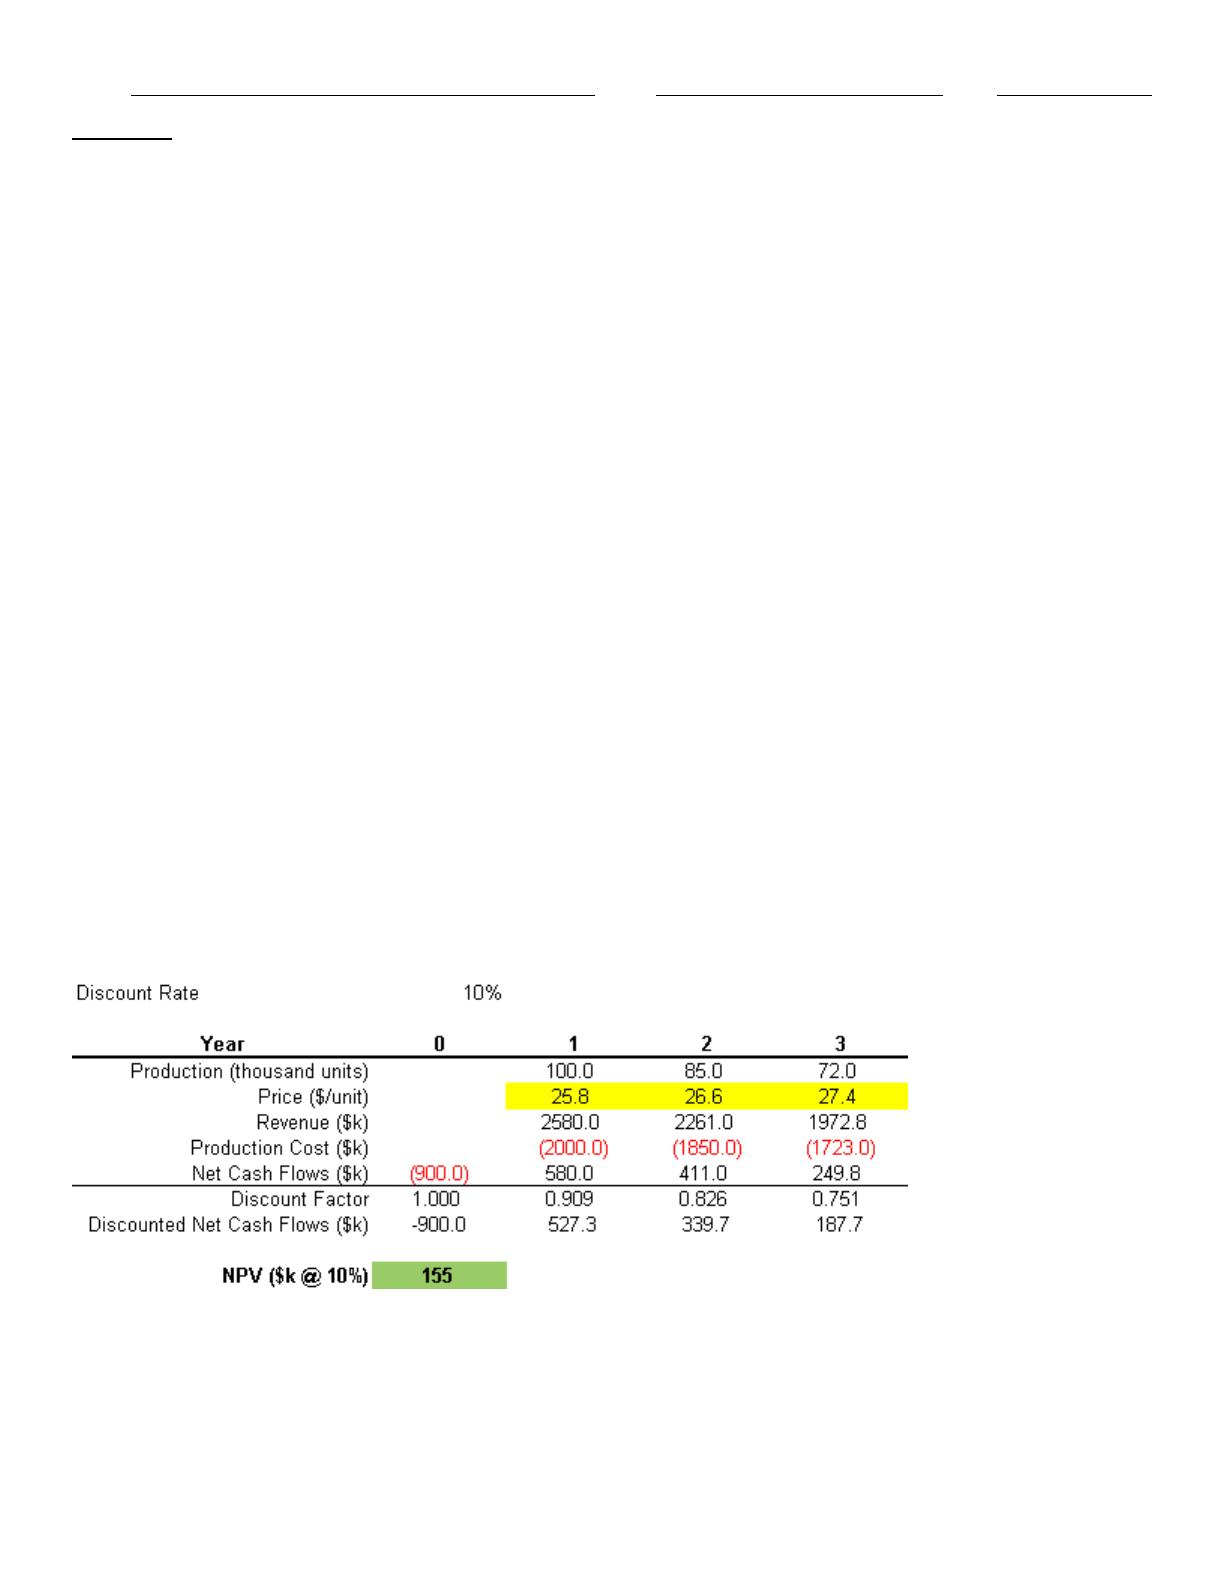
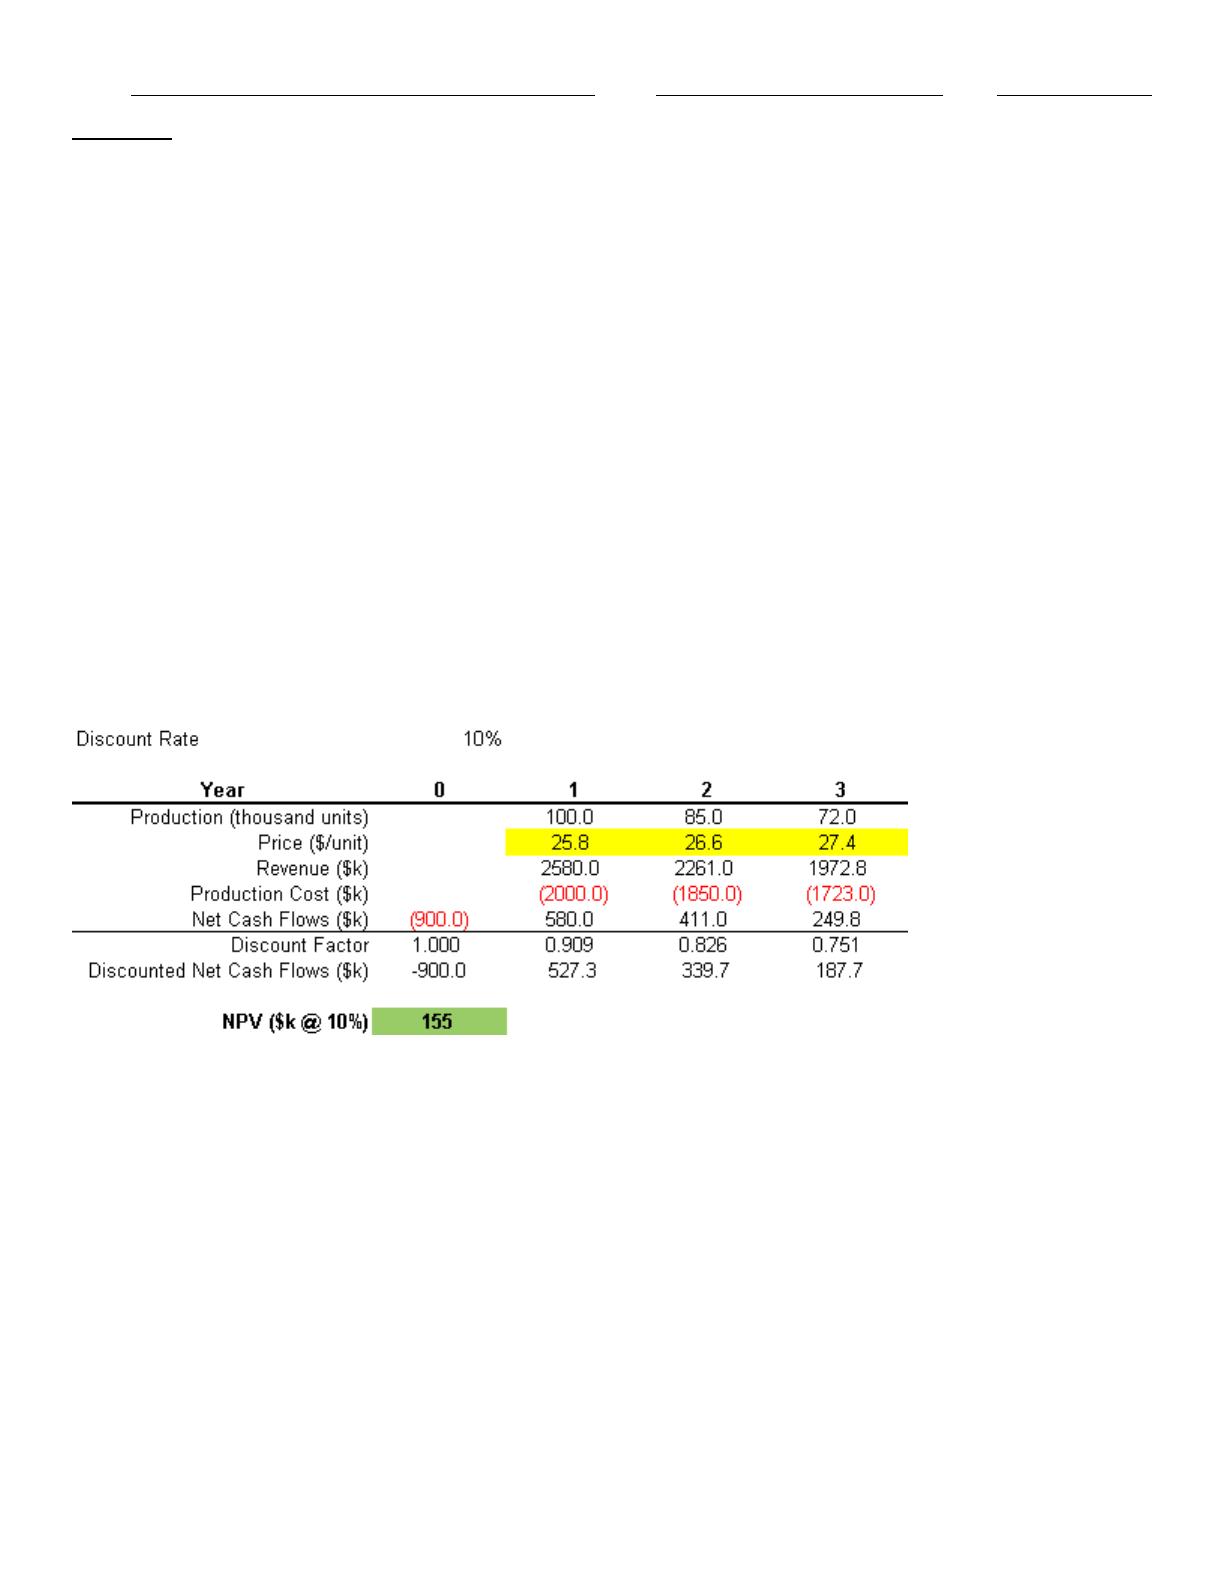
A firm is considering investing $0.9M in a typical industrial manufacturing application with a three year production planning
cycle under a forecasted market price environment. A simple three-period project pro forma cash flow sheet for this
project is shown below:
In the pro forma, the production and price forecast in each period translate to revenue, which can then be netted of
production costs to arrive at the expected cash flow in each period. The cash flows are then be discounted at a rate that is
commensurate with the riskiness of the project (here, assumed to be 10%).
61. What does the distribution of the NPV look like?
In this example we are estimating the net present value of introducing a new drug to market. We have the following
information about the market:

Name:
Class:
Date:
chapter 16
· The market size is 1,000,000 and is projected to grow at an average 5%, with a standard deviation of 1%, over the next
ten years.
· The market share captured at entry is projected to be between 20% and 70%, with most likely value 40%.
· Three competitors may enter the market in the future, with each one having a 40% probability of entry per year.
· For each new competitor per year, the market share goes down by 20%.
· The marginal profit per unit is $1.80.
· We want to evaluate the project over ten years, using a discount rate of 10%.
62. Perform a simulation with this model. What is the expected NPV? What is the standard deviation?
We are trying to determine the proper capacity level for a new electric car. A unit of capacity gives us the potential to
produce one car per year. It costs $10,000 to build a unit of capacity and the cost is charged equally over the next 5
years. It also costs $400 per year to maintain a unit of capacity (whether or not it is used). Each car sells for $14,000 and
incurs a variable production cost of $10,000. The annual demand for the electric car during each of the next 5 years is
believed to be normally distributed with mean 500,000 and standard deviation 100,000. The demands during different
years are assumed to be independent. Profits are discounted at a 10% annual interest rate. We are working with a 5-year
planning horizon. Capacity levels of 300,000, 400,000, 500,000, 600,000, and 700,000 are under consideration. (Assume
that no more than the demand is ever produced, so that no ending inventory ever occurs.)
63. (A) Assuming we are risk neutral, use simulation to find the optimal capacity level.
(B) Using the answer to (A), there a 5% chance that the actual discounted profit will exceed what value?
(C) Using the answer to (A), there is a 5% chance that the actual discounted profit will be less than what value?
(D) If we are risk averse, how might the optimal capacity level change?
Amanda is a recent college graduate, and has just started her first job. She would like to know if she saves $5,000 per
year out of her salary over the next 30 years what the distribution of the value of her retirement fund after 30 years. She
has decided that she will invest all her money in the stock market that she estimates has a return that is normally
distributed with mean 12% per year and standard deviation 25%.
64. What is the probability that Amanda will have less than $500,000 in her retirement account after 30 years under the
more conservative investing strategy?
The “winner’s curse” refers to a situation where there are several bidders on the same item. Each participant can make
his or her independent estimate for the value of the item. When all participants are equally informed their estimates will be
unbiased, but, given the difficulty of estimating the value, the estimates may vary widely. Even though the mean of the
estimates may equal the expected value, the winner’s bid will likely be more than the value of the item. Consider a case
where 3 companies are trying to decide how much to bid for a commercial real estate tract. Assume that each bidder
independently estimates the value of the tract. This estimated value is a random variable that for each bidder is drawn
from a normal distribution with a mean of $1,000,000 and a standard deviation of $200,000. The actual value is also
drawn from the same distribution.
65. What is the probability of winning for the conservative bidder?
Suppose that GM earns a $4000 profit each time a person buys a car. We want to determine how the expected profit
earned from a customer depends on the quality of GM’s cars. The customer is assumed to buy a new car every five
years, for a total of 10 cars through her lifetime. The customer will keep buying GM cars so long as they are satisfied with
them. The probability that the customer will be satisfied with her GM car is 80%. If she is not satisfied with her GM car,
she will buy another brand (we’ll call all other brands cumulatively “Toyota”). The probability that she is satisfied with
“Toyota” is 85%.
66. What if the GM satisfaction rate is raised further to 90%. What would the customer NPV be in that case?
The “winner’s curse” refers to a situation where there are several bidders on the same item. Each participant can make
his or her independent estimate for the value of the item. When all participants are equally informed their estimates will be
Name:
Class:
Date:
chapter 16
unbiased, but, given the difficulty of estimating the value, the estimates may vary widely. Even though the mean of the
estimates may equal the expected value, the winner’s bid will likely be more than the value of the item. Consider a case
where 3 companies are trying to decide how much to bid for a commercial real estate tract. Assume that each bidder
independently estimates the value of the tract. This estimated value is a random variable that for each bidder is drawn
from a normal distribution with a mean of $1,000,000 and a standard deviation of $200,000. The actual value is also
drawn from the same distribution.
67. What is the probability of winning for each bidder in the above scenario?
68. Consider a device that requires two batteries to function. If either of these batteries dies, the device will not work.
Currently there are two brand new batteries in the device, and there are three extra brand new batteries. Each battery,
once it is placed in the device, lasts a random amount of time that is triangularly distributed with parameters 15, 18, and
25 (all expressed in hours). When any of the batteries in the device dies, it is immediately replaced by an extra (if an extra
is still available). Use @RISK to simulate the time the device can last with the batteries currently available.
Suppose that GM earns a $4000 profit each time a person buys a car. We want to determine how the expected profit
earned from a customer depends on the quality of GM’s cars. The customer is assumed to buy a new car every five
years, for a total of 10 cars through her lifetime. The customer will keep buying GM cars so long as they are satisfied with
them. The probability that the customer will be satisfied with her GM car is 80%. If she is not satisfied with her GM car,
she will buy another brand (we’ll call all other brands cumulatively “Toyota”). The probability that she is satisfied with
“Toyota” is 85%.
69. Suppose that a customer satisfaction firm approaches GM with a proposal to increase satisfaction from the current
80% rate to $85% through a low cost maintenance program that will cost GM $300 per customer. Would the program be
worth it?
Amanda is a recent college graduate, and has just started her first job. She would like to know if she saves $5,000 per
year out of her salary over the next 30 years what the distribution of the value of her retirement fund after 30 years. She
has decided that she will invest all her money in the stock market that she estimates has a return that is normally
distributed with mean 12% per year and standard deviation 25%.
70. Suppose Amanda will stop investing in the stock market and transfer all of her retirement into a savings account if and
when she reaches $500,000. When can she expect to reach this goal?
An executive has been offered a compensation package that includes stock options. The current stock price is $30/share,
and she has been offered a call option on 2000 shares, which can be exercised five years from now at a price of
$42/share. Therefore, if the market price of the shares in five years is more than $42/share, she can buy 2000 shares at
$42/share, and then immediately sell the shares at the market price, earning a riskless profit. If the market price of the
shares was less than $42/share, she will obviously choose not to exercise the option, and would have zero profit.
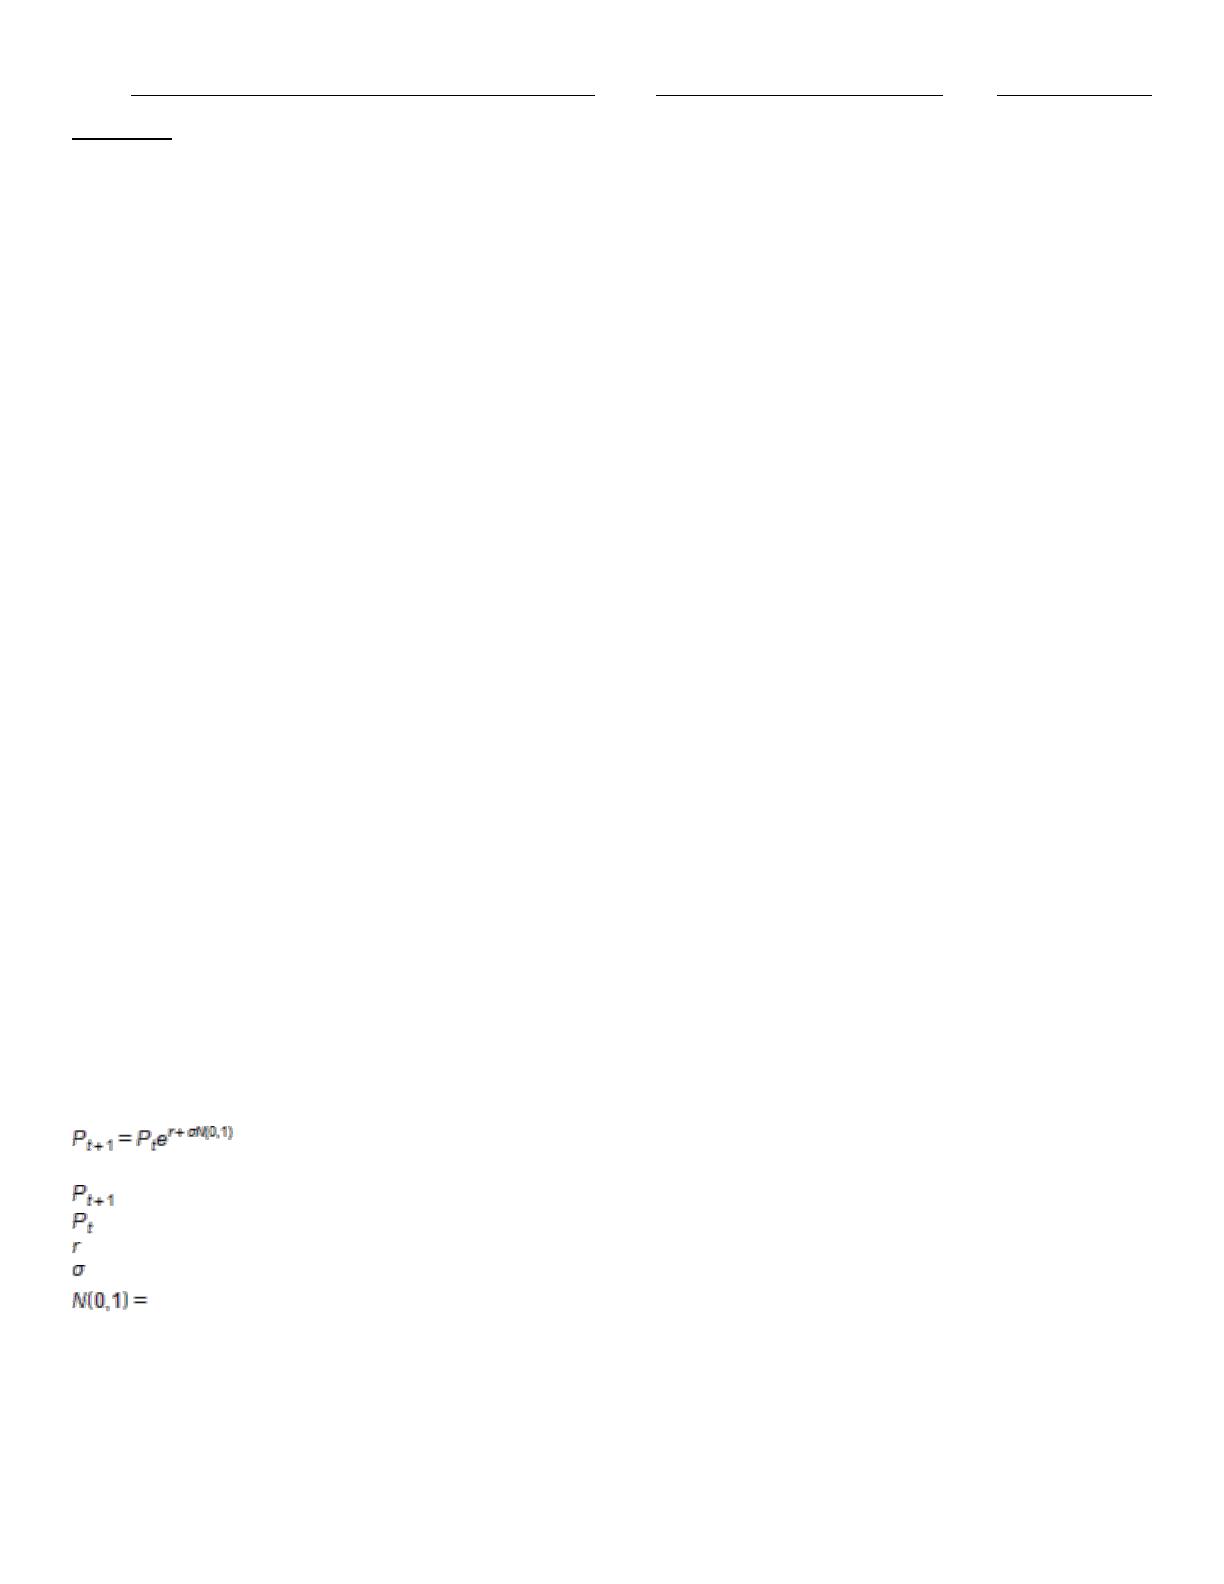
Assume the price of the stock can be modeled as exponential growth (compounding), which could be calculated as:
where,
stock price in next period (i.e., price next year)
current stock price
annual growth rate of the stock price, which has been 10%
annual volatility, which is estimated to be 18%
normal random variable with mean of zero and standard deviation of 1
71. The executive thinks the growth rate could shrink to 7% per year if the company has growing pains, but on the other
hand it could be as high as 15% per year if the company prospers. What is the expected value of the stock options in
those cases?
Suppose we want to choose capacity for a plant that will produce a new drug. In particular, we want to choose the
capacity that maximizes discounted expected profit over the next 10 years. We have the following information:
Name:
Class:
Date:
chapter 16
· Demand for the drug is expected to be normally distributed ˜ Normal (50,000, 12,000).
· A unit of capacity costs $16 to build.
· The number of units produced will equal the demand, up to capacity limits.
· The revenue per unit is $3.70 and the cost per unit is $0.20 (variable cost).
· The maintenance cost per unit of capacity is $0.40 (fixed cost).
· The discount rate is 10%.
72. Which simulation has the most risk as measured by spread or dispersion in the data? Please state clearly what
statistic you used to answer this question.
ABC sells refrigerators. Any refrigerator that fails before it is 3 years old is replaced for free. Of all refrigerators, 2% fail
during their first year of operation; 4% of all 1-year-old refrigerators fail during their second year of operation; and 8% of all
2-year-old refrigerators fail during their third year of operation. It costs ABC $500 to replace a refrigerator, and ABC sells
6,000 refrigerators per year.
73. If the warranty period were reduced to 2 years, how much per year in replacement costs would be saved?
Amanda is a recent college graduate, and has just started her first job. She would like to know if she saves $5,000 per
year out of her salary over the next 30 years what the distribution of the value of her retirement fund after 30 years. She
has decided that she will invest all her money in the stock market that she estimates has a return that is normally
distributed with mean 12% per year and standard deviation 25%.
74. What is the probability that Amanda will have less than $500,000 in her retirement account after 30 years?
ABC sells refrigerators. Any refrigerator that fails before it is 3 years old is replaced for free. Of all refrigerators, 2% fail
during their first year of operation; 4% of all 1-year-old refrigerators fail during their second year of operation; and 8% of all
2-year-old refrigerators fail during their third year of operation. It costs ABC $500 to replace a refrigerator, and ABC sells
6,000 refrigerators per year.
75. Estimate the fraction of all refrigerators that will have to be replaced.
A firm is considering investing $0.9M in a typical industrial manufacturing application with a three year production planning
cycle under a forecasted market price environment. A simple three-period project pro forma cash flow sheet for this
project is shown below:
In the pro forma, the production and price forecast in each period translate to revenue, which can then be netted of
production costs to arrive at the expected cash flow in each period. The cash flows are then be discounted at a rate that is
commensurate with the riskiness of the project (here, assumed to be 10%).
76. What are the chances the firm could lose money on this project, given the price uncertainty?
You are considering a 10-year investment project. At present, the expected cash flow each year is $1000. Suppose,
however, that each year’s cash flow is normally distributed with mean equal to last year’s actual cash flow and standard
Name:
Class:
Date:
chapter 16
deviation $100. For example, suppose that the actual cash flow in year 1 is $1300. Then year 2 cash flow is normal with
mean $1300 and standard deviation $100. Also, at the end of year 1, your best guess is that each later year’s expected
cash flow will be $1300.
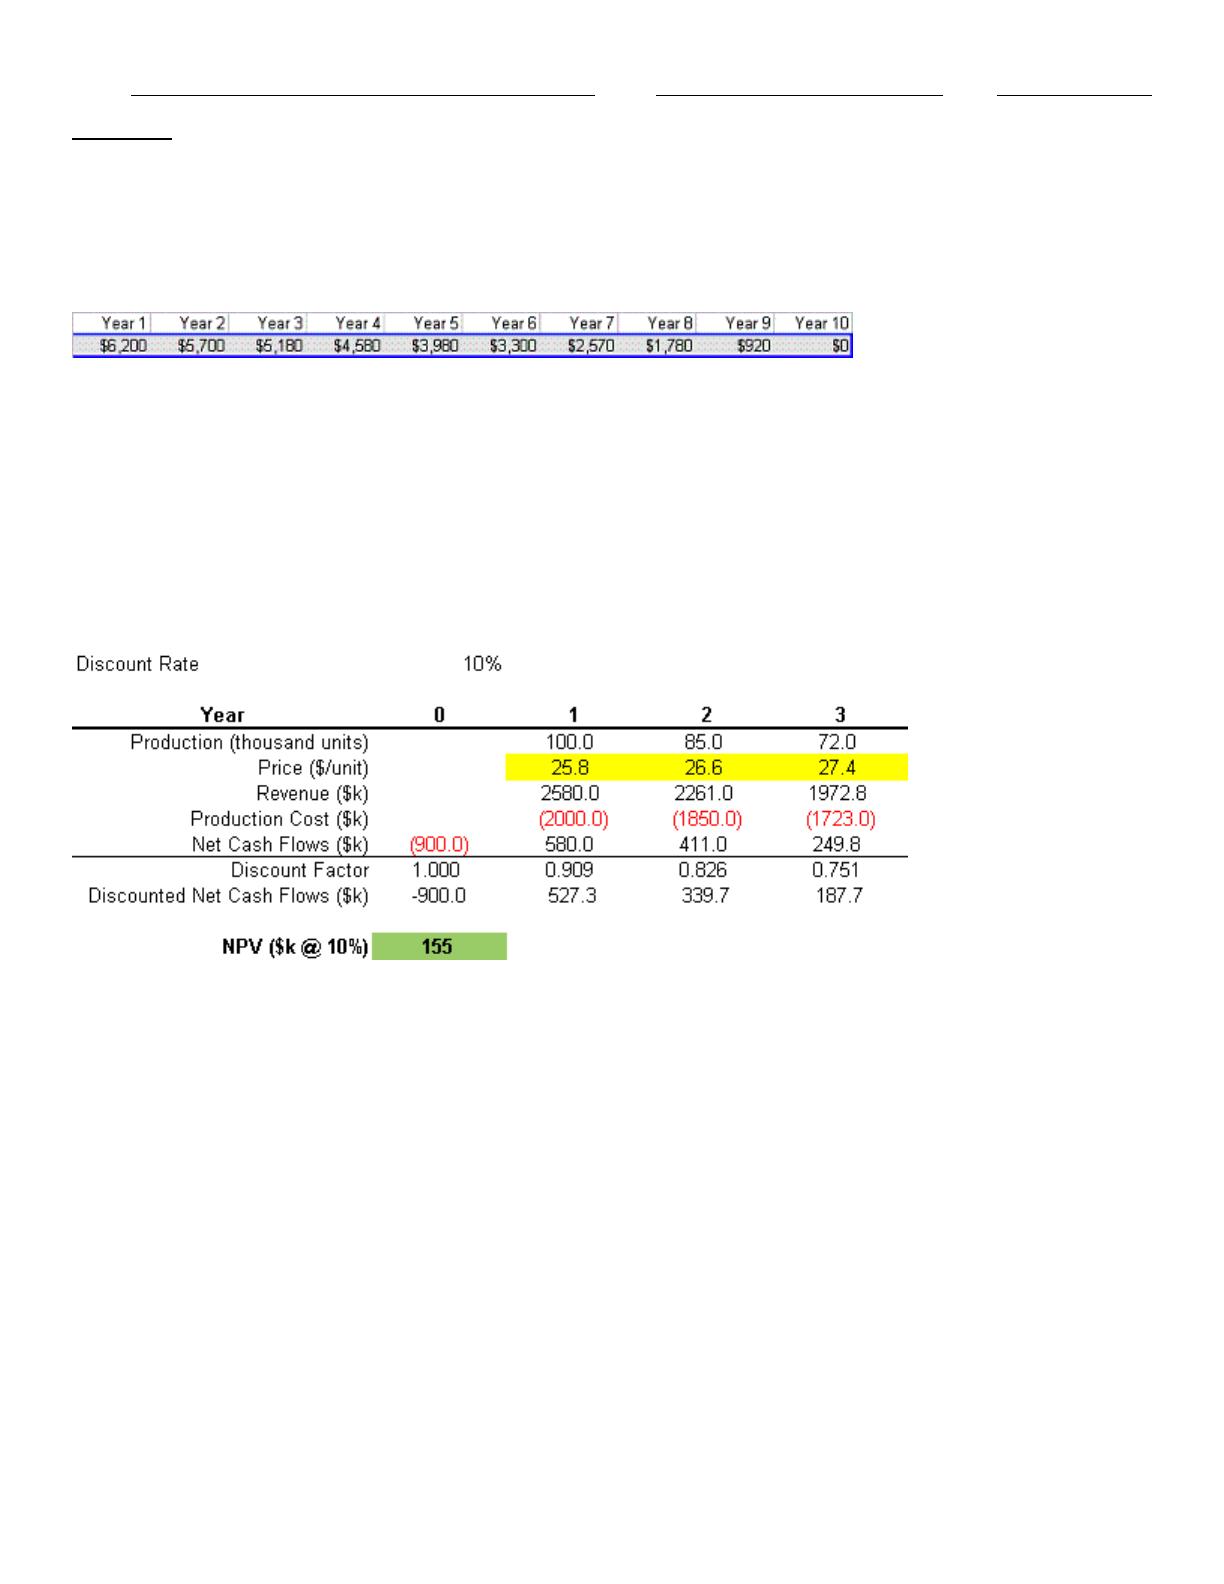
77. Now assume that the project has an abandonment option. At the end of each year you can abandon the project for the
values given below:
For example, suppose that year 1 cash flow is $400. Then at the end of year 1, you expect cash flow for each remaining
year to be $400. This has an NPV of less than $6200, so you should abandon the project and collect $6200 at the end of
year 1. Estimate the mean and standard deviation of the project with the abandonment option. How much would you pay
for the abandonment option? (Hint: You can abandon a project at most once. Thus in year 5, for example, you abandon
only if the sum of future expected NPVs is less than the year 5 abandonment value and the project has not yet been
abandoned. Also, once you abandon the project, the actual cash flows for future years will 0. So the future cash flows
after abandonment should disappear.)
A firm is considering investing $0.9M in a typical industrial manufacturing application with a three year production planning
cycle under a forecasted market price environment. A simple three-period project pro forma cash flow sheet for this
project is shown below:
In the pro forma, the production and price forecast in each period translate to revenue, which can then be netted of
production costs to arrive at the expected cash flow in each period. The cash flows are then be discounted at a rate that is
commensurate with the riskiness of the project (here, assumed to be 10%).
78. What is the standard deviation of the NPV? What does it indicate?
Suppose we want to choose capacity for a plant that will produce a new drug. In particular, we want to choose the
capacity that maximizes discounted expected profit over the next 10 years. We have the following information:
· Demand for the drug is expected to be normally distributed ˜ Normal (50,000, 12,000).
· A unit of capacity costs $16 to build.
· The number of units produced will equal the demand, up to capacity limits.
· The revenue per unit is $3.70 and the cost per unit is $0.20 (variable cost).
· The maintenance cost per unit of capacity is $0.40 (fixed cost).
· The discount rate is 10%.
79. Briefly explain why designing the plant for the expected capacity is clearly not the optimal solution.
Amanda is a recent college graduate, and has just started her first job. She would like to know if she saves $5,000 per
year out of her salary over the next 30 years what the distribution of the value of her retirement fund after 30 years. She
has decided that she will invest all her money in the stock market that she estimates has a return that is normally
distributed with mean 12% per year and standard deviation 25%.
Name:
Class:
Date:
chapter 16
80. Suppose again that Amanda will stop investing in the stock market and transfer all of her retirement into a savings
account if and when she reaches $500,000. When can she expect to reach this goal under the more conservative
investing strategy?
An executive has been offered a compensation package that includes stock options. The current stock price is $30/share,
and she has been offered a call option on 2000 shares, which can be exercised five years from now at a price of
$42/share. Therefore, if the market price of the shares in five years is more than $42/share, she can buy 2000 shares at
$42/share, and then immediately sell the shares at the market price, earning a riskless profit. If the market price of the
shares was less than $42/share, she will obviously choose not to exercise the option, and would have zero profit.
Assume the price of the stock can be modeled as exponential growth (compounding), which could be calculated as:
where,
stock price in next period (i.e., price next year)
current stock price
annual growth rate of the stock price, which has been 10%
annual volatility, which is estimated to be 18%
normal random variable with mean of zero and standard deviation of 1
81. Simulate the price of the stock in five years by calculating five annual increments (steps) with this model, starting from
the current price of $30/share. For each price simulated five years from now, model the exercise decision and calculate
the resulting profit, which should then be discounted for five years at the current discount rate (5%) to obtain the present
value of the options. What is the expected value of the stock options?
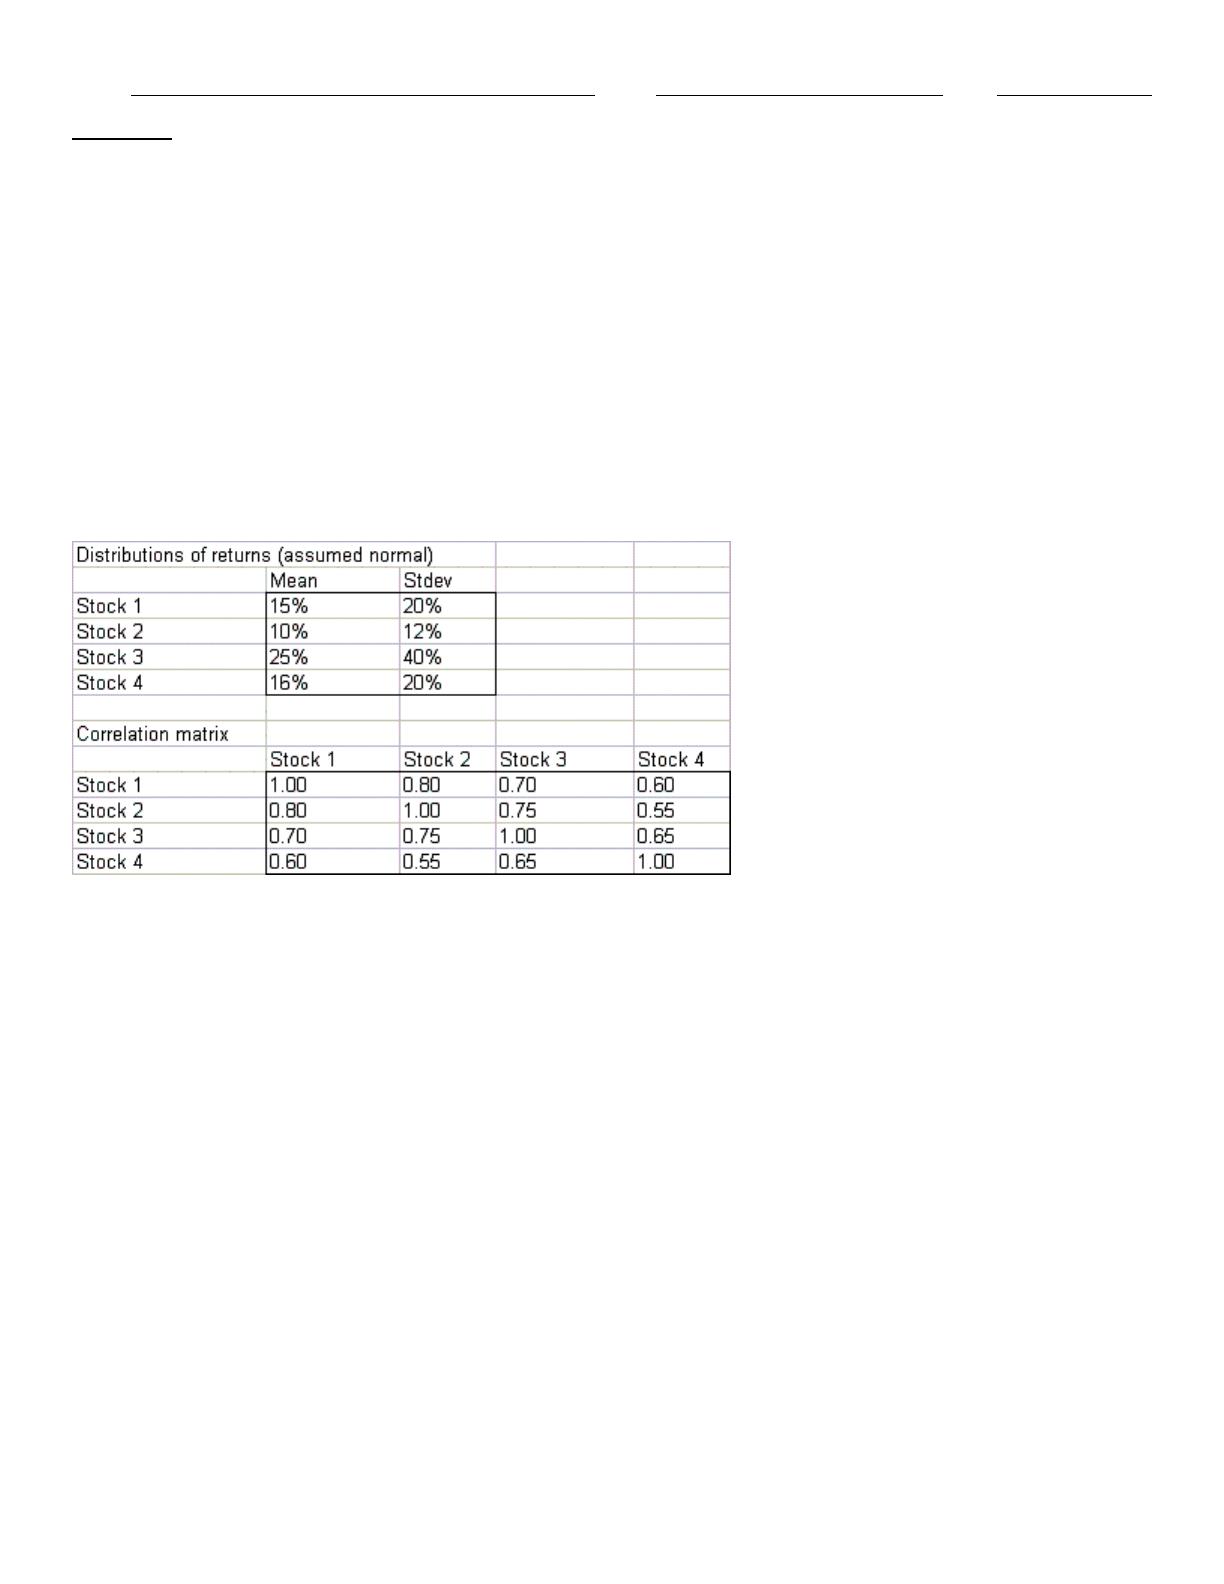
Suppose you have invested 25% of your portfolio in four different stocks. The mean and standard deviation of the annual
return on each stock are as shown below. The correlations between the annual returns on the four stocks are also shown
below.
82. What is the probability that your portfolio will lose money during the course of a year?
Suppose that GM earns a $4000 profit each time a person buys a car. We want to determine how the expected profit
earned from a customer depends on the quality of GM’s cars. The customer is assumed to buy a new car every five
years, for a total of 10 cars through her lifetime. The customer will keep buying GM cars so long as they are satisfied with
them. The probability that the customer will be satisfied with her GM car is 80%. If she is not satisfied with her GM car,
she will buy another brand (we’ll call all other brands cumulatively “Toyota”). The probability that she is satisfied with
“Toyota” is 85%.
83. Suppose GM could raise it customer satisfaction to 85%, to match Toyota’s. What would the customer NPV be in that

Name:
Class:
Date:
chapter 16
case?
In this example we are estimating the net present value of introducing a new drug to market. We have the following
information about the market:
· The market size is 1,000,000 and is projected to grow at an average 5%, with a standard deviation of 1%, over the next
ten years.
· The market share captured at entry is projected to be between 20% and 70%, with most likely value 40%.
· Three competitors may enter the market in the future, with each one having a 40% probability of entry per year.
· For each new competitor per year, the market share goes down by 20%.
· The marginal profit per unit is $1.80.
· We want to evaluate the project over ten years, using a discount rate of 10%.
84. What is the appropriate distribution for the probability of competitor entry?
Suppose we want to choose capacity for a plant that will produce a new drug. In particular, we want to choose the
capacity that maximizes discounted expected profit over the next 10 years. We have the following information:
· Demand for the drug is expected to be normally distributed ˜ Normal (50,000, 12,000).
· A unit of capacity costs $16 to build.
· The number of units produced will equal the demand, up to capacity limits.
· The revenue per unit is $3.70 and the cost per unit is $0.20 (variable cost).
· The maintenance cost per unit of capacity is $0.40 (fixed cost).
· The discount rate is 10%.
85. For each simulation what is the probability of exceeding $75,000 in NPV (approximate these numbers as closely as
possible from the data given in the above table). Please put your answer in the following table:
Suppose that GM earns a $4000 profit each time a person buys a car. We want to determine how the expected profit
earned from a customer depends on the quality of GM’s cars. The customer is assumed to buy a new car every five
years, for a total of 10 cars through her lifetime. The customer will keep buying GM cars so long as they are satisfied with
them. The probability that the customer will be satisfied with her GM car is 80%. If she is not satisfied with her GM car,
she will buy another brand (we’ll call all other brands cumulatively “Toyota”). The probability that she is satisfied with
“Toyota” is 85%.
86. Using your answers to Questions 69 and 70, and without simulating the model again, estimate how much an extra 5%
customer satisfaction is worth to GM.
Suppose that a recent study shows that each week each of 300 families buys a gallon of apple juice from company A, B,
or C. Let denote the probability that a gallon produced by company A is of unsatisfactory quality, and define
and similarly for companies B and C. If the last gallon of juice purchased by a family is satisfactory, the next week they
will purchase a gallon of juice from the same company. If the last gallon of juice purchased by a family is not satisfactory,
then the family will purchase a gallon from a competitor. Consider one week in which A families have purchased juice A, B
families have purchased juice B, and C families have purchased juice C. Assume that families that switch brands during a
period are allocated to the remaining brands in a manner that is proportional to the current market shares of the other
brands. Thus, if a customer switches from brand A, there is probability B/(B + C) that he will switch to brand B and
probability C/(B + C) that he will switch to brand C. Suppose that the market is currently divided equally: 100 families for
each of the three brands.
87. After a year, what will the market share for each of the three companies be? Assume = 0.10, = 0.15, and =
0.20. (Hint: Use the RISKBINOMIAL function to model how many people switch from A, then how many switch from A to B
and from A to C.)
Suppose we want to choose capacity for a plant that will produce a new drug. In particular, we want to choose the
capacity that maximizes discounted expected profit over the next 10 years. We have the following information:
· Demand for the drug is expected to be normally distributed ˜ Normal (50,000, 12,000).
Name:
Class:
Date:
chapter 16
· A unit of capacity costs $16 to build.
· The number of units produced will equal the demand, up to capacity limits.
· The revenue per unit is $3.70 and the cost per unit is $0.20 (variable cost).
· The maintenance cost per unit of capacity is $0.40 (fixed cost).
· The discount rate is 10%.
88. Which simulation yields the largest median NPV?
In this example we are estimating the net present value of introducing a new drug to market. We have the following
information about the market:
· The market size is 1,000,000 and is projected to grow at an average 5%, with a standard deviation of 1%, over the next
ten years.
· The market share captured at entry is projected to be between 20% and 70%, with most likely value 40%.
· Three competitors may enter the market in the future, with each one having a 40% probability of entry per year.
· For each new competitor per year, the market share goes down by 20%.
· The marginal profit per unit is $1.80.
· We want to evaluate the project over ten years, using a discount rate of 10%.
89. What is the appropriate distribution for initial market size?
A firm is considering investing $0.9M in a typical industrial manufacturing application with a three year production planning
cycle under a forecasted market price environment. A simple three-period project pro forma cash flow sheet for this
project is shown below:
In the pro forma, the production and price forecast in each period translate to revenue, which can then be netted of
production costs to arrive at the expected cash flow in each period. The cash flows are then be discounted at a rate that is
commensurate with the riskiness of the project (here, assumed to be 10%).
90. Suppose that the forecasted price levels shown in the pro forma cash flow sheet are not deterministic, but rather are
expected to fluctuate due to market forces. The prices are expected to be normally distributed in each year, with the
means equal to the expected values shown in the pro forma, but with standard deviations of $5.2, $5.3, and $5.5 in years
1, 2, and 3, respectively. Enter this pro forma in an Excel worksheet, with the appropriate @RISK functions for the random
prices, and simulate 1,000 iterations. What is the expected NPV now? Would you recommend investing in this project?
Explain.
Assume you have $1000, all of which is invested in a basketball team. Each year there is a 60% chance that the value of
the team will increase by 60% and a 40% chance that the value of the team will decrease by 60%.
91. (A) Estimate the mean and median value of your investment after 100 years.
(B) Explain the large difference between the estimated mean and median.
In this example we are estimating the net present value of introducing a new drug to market. We have the following
Name:
Class:
Date:
chapter 16
information about the market:
· The market size is 1,000,000 and is projected to grow at an average 5%, with a standard deviation of 1%, over the next
ten years.
· The market share captured at entry is projected to be between 20% and 70%, with most likely value 40%.
· Three competitors may enter the market in the future, with each one having a 40% probability of entry per year.
· For each new competitor per year, the market share goes down by 20%.
· The marginal profit per unit is $1.80.
· We want to evaluate the project over ten years, using a discount rate of 10%.
92. Suppose this new drug will cost $3 million to develop. What is the chance that we could loose money on this project?
Suppose you have invested 25% of your portfolio in four different stocks. The mean and standard deviation of the annual
return on each stock are as shown below. The correlations between the annual returns on the four stocks are also shown
below.
93. What is the probability that your portfolio’s annual return will exceed 20%?
The “winner’s curse” refers to a situation where there are several bidders on the same item. Each participant can make
his or her independent estimate for the value of the item. When all participants are equally informed their estimates will be
unbiased, but, given the difficulty of estimating the value, the estimates may vary widely. Even though the mean of the
estimates may equal the expected value, the winner’s bid will likely be more than the value of the item. Consider a case
where 3 companies are trying to decide how much to bid for a commercial real estate tract. Assume that each bidder
independently estimates the value of the tract. This estimated value is a random variable that for each bidder is drawn
from a normal distribution with a mean of $1,000,000 and a standard deviation of $200,000. The actual value is also
drawn from the same distribution.
94. Next, assume that one of the bidders bids 20% below his or her estimated value, while the other two bidders follow the
same strategy as in Question 74. Using 1000 iterations report the expected profit or loss to the conservative bidder.
95. Suppose first that all three bidders are aware of the winner’s curse so they have decided (independently) to bid 10%
below their estimated values. Using 1000 iterations report the expected profit (or loss) to the winner.
Suppose we want to choose capacity for a plant that will produce a new drug. In particular, we want to choose the
capacity that maximizes discounted expected profit over the next 10 years. We have the following information:
· Demand for the drug is expected to be normally distributed ˜ Normal (50,000, 12,000).
· A unit of capacity costs $16 to build.
· The number of units produced will equal the demand, up to capacity limits.
· The revenue per unit is $3.70 and the cost per unit is $0.20 (variable cost).
· The maintenance cost per unit of capacity is $0.40 (fixed cost).
Name:
Class:
Date:
chapter 16
· The discount rate is 10%.
96. Use RISKSIMTABLE with a range of possible values to help the firm decide what the plant capacity should be.
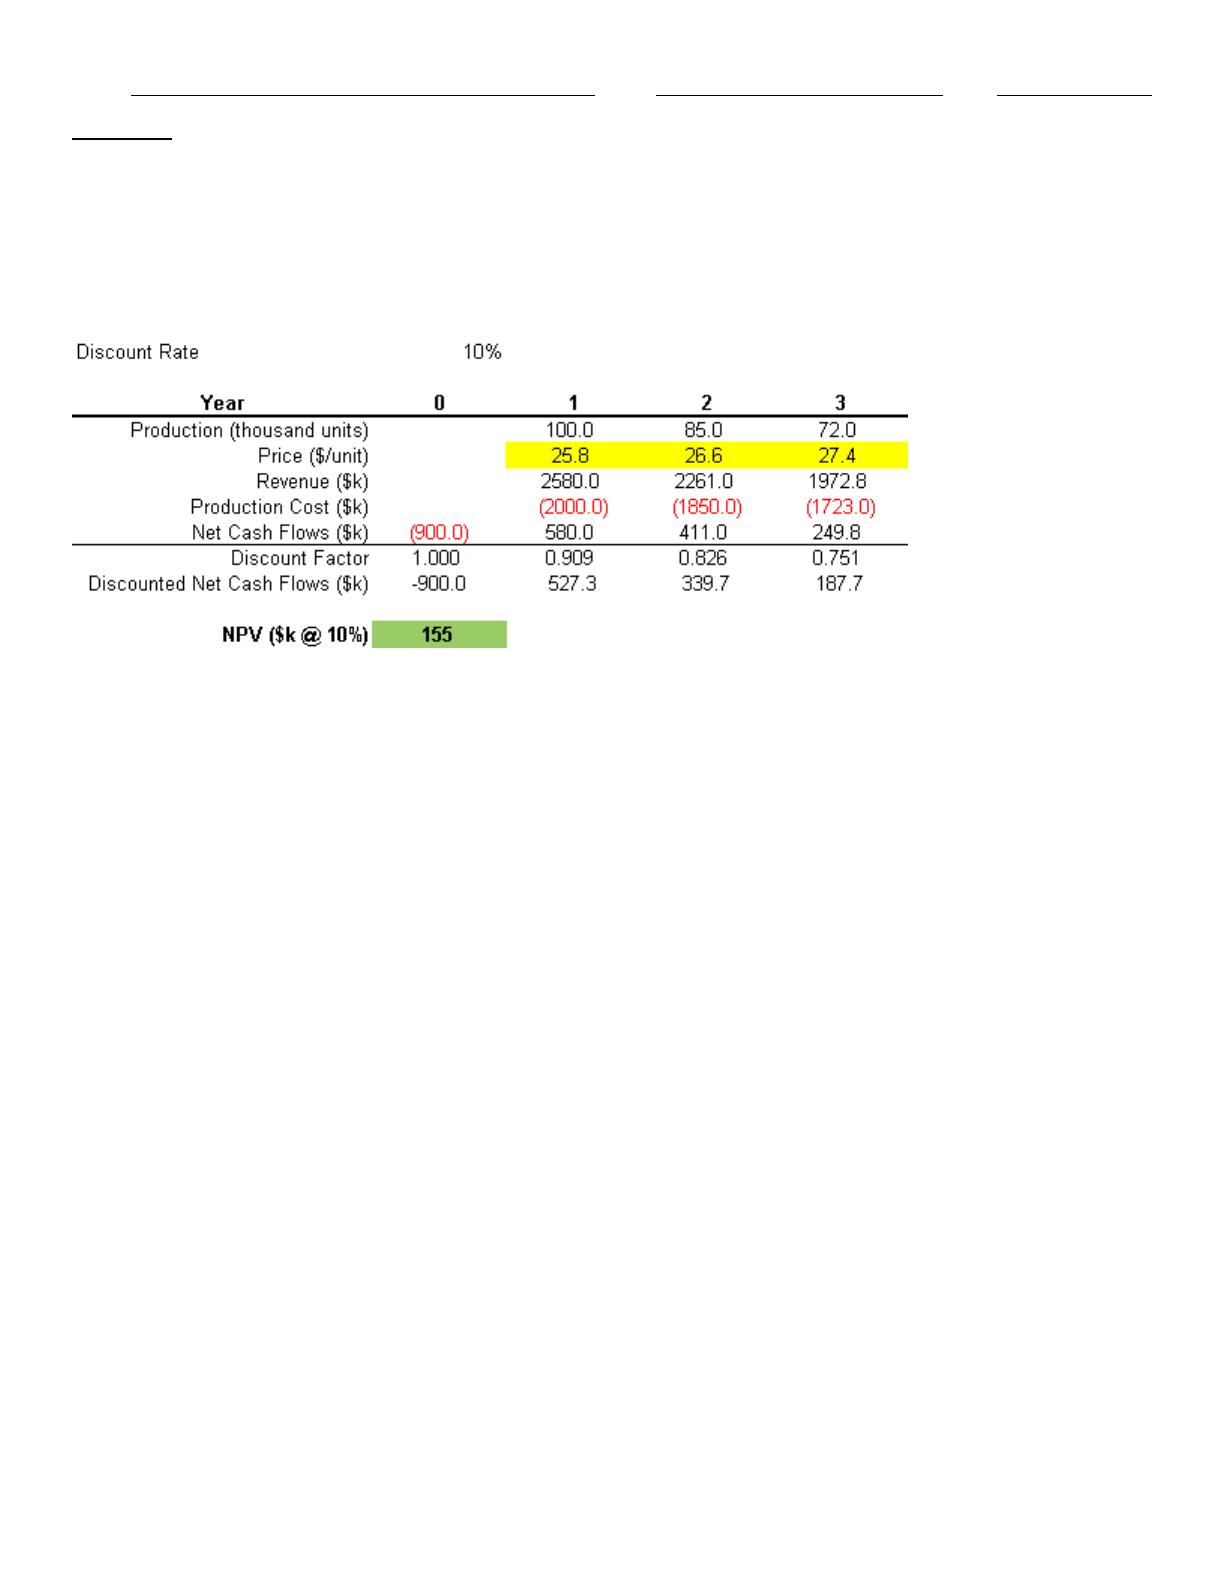
A firm is considering investing $0.9M in a typical industrial manufacturing application with a three year production planning
cycle under a forecasted market price environment. A simple three-period project pro forma cash flow sheet for this
project is shown below:
In the pro forma, the production and price forecast in each period translate to revenue, which can then be netted of
production costs to arrive at the expected cash flow in each period. The cash flows are then be discounted at a rate that is
commensurate with the riskiness of the project (here, assumed to be 10%).
97. The Net Present Value (NPV) is the sum of the discounted cash flows. What is the NPV of the project, including the
required investment?
Suppose we want to choose capacity for a plant that will produce a new drug. In particular, we want to choose the
capacity that maximizes discounted expected profit over the next 10 years. We have the following information:
· Demand for the drug is expected to be normally distributed ˜ Normal (50,000, 12,000).
· A unit of capacity costs $16 to build.
· The number of units produced will equal the demand, up to capacity limits.
· The revenue per unit is $3.70 and the cost per unit is $0.20 (variable cost).
· The maintenance cost per unit of capacity is $0.40 (fixed cost).
· The discount rate is 10%.
98. Perform a simulation assuming the plant will be designed to meet the expected demand. What is the NPV in that
case?
Amanda is a recent college graduate, and has just started her first job. She would like to know if she saves $5,000 per
year out of her salary over the next 30 years what the distribution of the value of her retirement fund after 30 years. She
has decided that she will invest all her money in the stock market that she estimates has a return that is normally
distributed with mean 12% per year and standard deviation 25%.
99. Simulate Amanda’s portfolio over the next 30 years and determine how much she can expect to have in her account
at the end of that period. At the beginning of each year, compute the beginning balance in Amanda’s account. Note that
this balance is either 0 (for year 1) or equal to the ending balance of the previous year. The contribution of $5,000 is then
added to calculate the new balance. The market return for each year is given by a normal random variable with the
parameters above (assume the market returns in each year are independent of the other years). The ending balance for
the each year is then equal to the beginning balance, augmented by the contribution, and multiplied by (1+Market return).
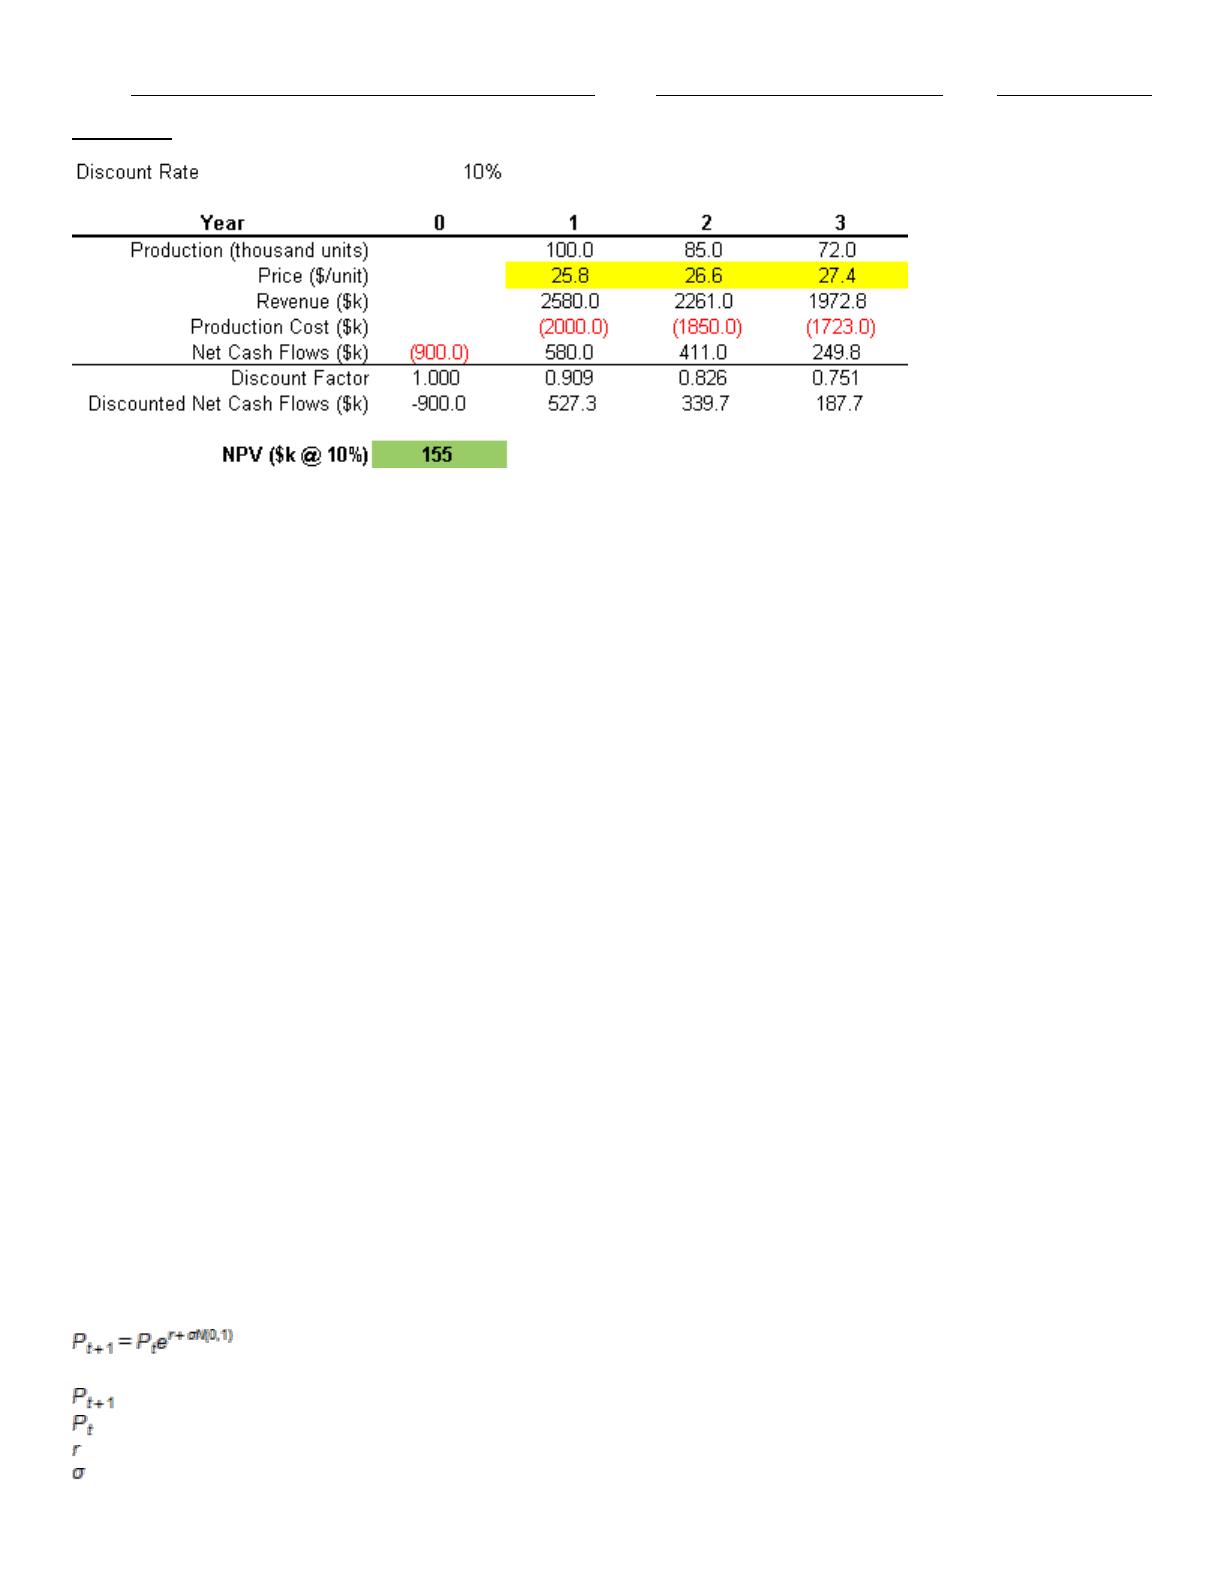
A firm is considering investing $0.9M in a typical industrial manufacturing application with a three year production planning
cycle under a forecasted market price environment. A simple three-period project pro forma cash flow sheet for this
project is shown below:
Name:
Class:
Date:
chapter 16
In the pro forma, the production and price forecast in each period translate to revenue, which can then be netted of
production costs to arrive at the expected cash flow in each period. The cash flows are then be discounted at a rate that is
commensurate with the riskiness of the project (here, assumed to be 10%).
100. Given your answers to Questions 51 through 55, would you invest in this project?
Suppose that GM earns a $4000 profit each time a person buys a car. We want to determine how the expected profit
earned from a customer depends on the quality of GM’s cars. The customer is assumed to buy a new car every five
years, for a total of 10 cars through her lifetime. The customer will keep buying GM cars so long as they are satisfied with
them. The probability that the customer will be satisfied with her GM car is 80%. If she is not satisfied with her GM car,
she will buy another brand (we’ll call all other brands cumulatively “Toyota”). The probability that she is satisfied with
“Toyota” is 85%.
101. Consider a customer whose first car is GM. If profits are discounted at 10% annually, use simulation to estimate the
value of this customer to GM over the customer’s lifetime.
Suppose we want to choose capacity for a plant that will produce a new drug. In particular, we want to choose the
capacity that maximizes discounted expected profit over the next 10 years. We have the following information:
· Demand for the drug is expected to be normally distributed ˜ Normal (50,000, 12,000).
· A unit of capacity costs $16 to build.
· The number of units produced will equal the demand, up to capacity limits.
· The revenue per unit is $3.70 and the cost per unit is $0.20 (variable cost).
· The maintenance cost per unit of capacity is $0.40 (fixed cost).
· The discount rate is 10%.
102. Considering your answers for Questions 78 through 83, please state how many units of capacity you think the plant
should be built for and explain why.
An executive has been offered a compensation package that includes stock options. The current stock price is $30/share,
and she has been offered a call option on 2000 shares, which can be exercised five years from now at a price of
$42/share. Therefore, if the market price of the shares in five years is more than $42/share, she can buy 2000 shares at
$42/share, and then immediately sell the shares at the market price, earning a riskless profit. If the market price of the
shares was less than $42/share, she will obviously choose not to exercise the option, and would have zero profit.
Assume the price of the stock can be modeled as exponential growth (compounding), which could be calculated as:
where,
stock price in next period (i.e., price next year)
current stock price
annual growth rate of the stock price, which has been 10%
annual volatility, which is estimated to be 18%

Name:
Class:
Date:
chapter 16
normal random variable with mean of zero and standard deviation of 1
103. Until uncertainty about the growth rate is resolved, the volatility of the stock price could well be much higher than
18% – perhaps as high at 25%. What would the value be in that case?
In this example we are estimating the net present value of introducing a new drug to market. We have the following
information about the market:
· The market size is 1,000,000 and is projected to grow at an average 5%, with a standard deviation of 1%, over the next
ten years.
· The market share captured at entry is projected to be between 20% and 70%, with most likely value 40%.
· Three competitors may enter the market in the future, with each one having a 40% probability of entry per year.
· For each new competitor per year, the market share goes down by 20%.
· The marginal profit per unit is $1.80.
· We want to evaluate the project over ten years, using a discount rate of 10%.
104. Develop an @Risk model to estimate the NPV given an assumed capacity. What are the variable inputs and
outputs?
Name:
Class:
Date:
chapter 16
Answer Key
Name:
Class:
Date:
chapter 16
Name:
Class:
Date:
chapter 16
Name:
Class:
Date:
chapter 16
The change is clearly worth the cost.
was still positive in both cases).
Name:
Class:
Date:
chapter 16
Name:
Class:
Date:
chapter 16
Name:
Class:
Date:
chapter 16
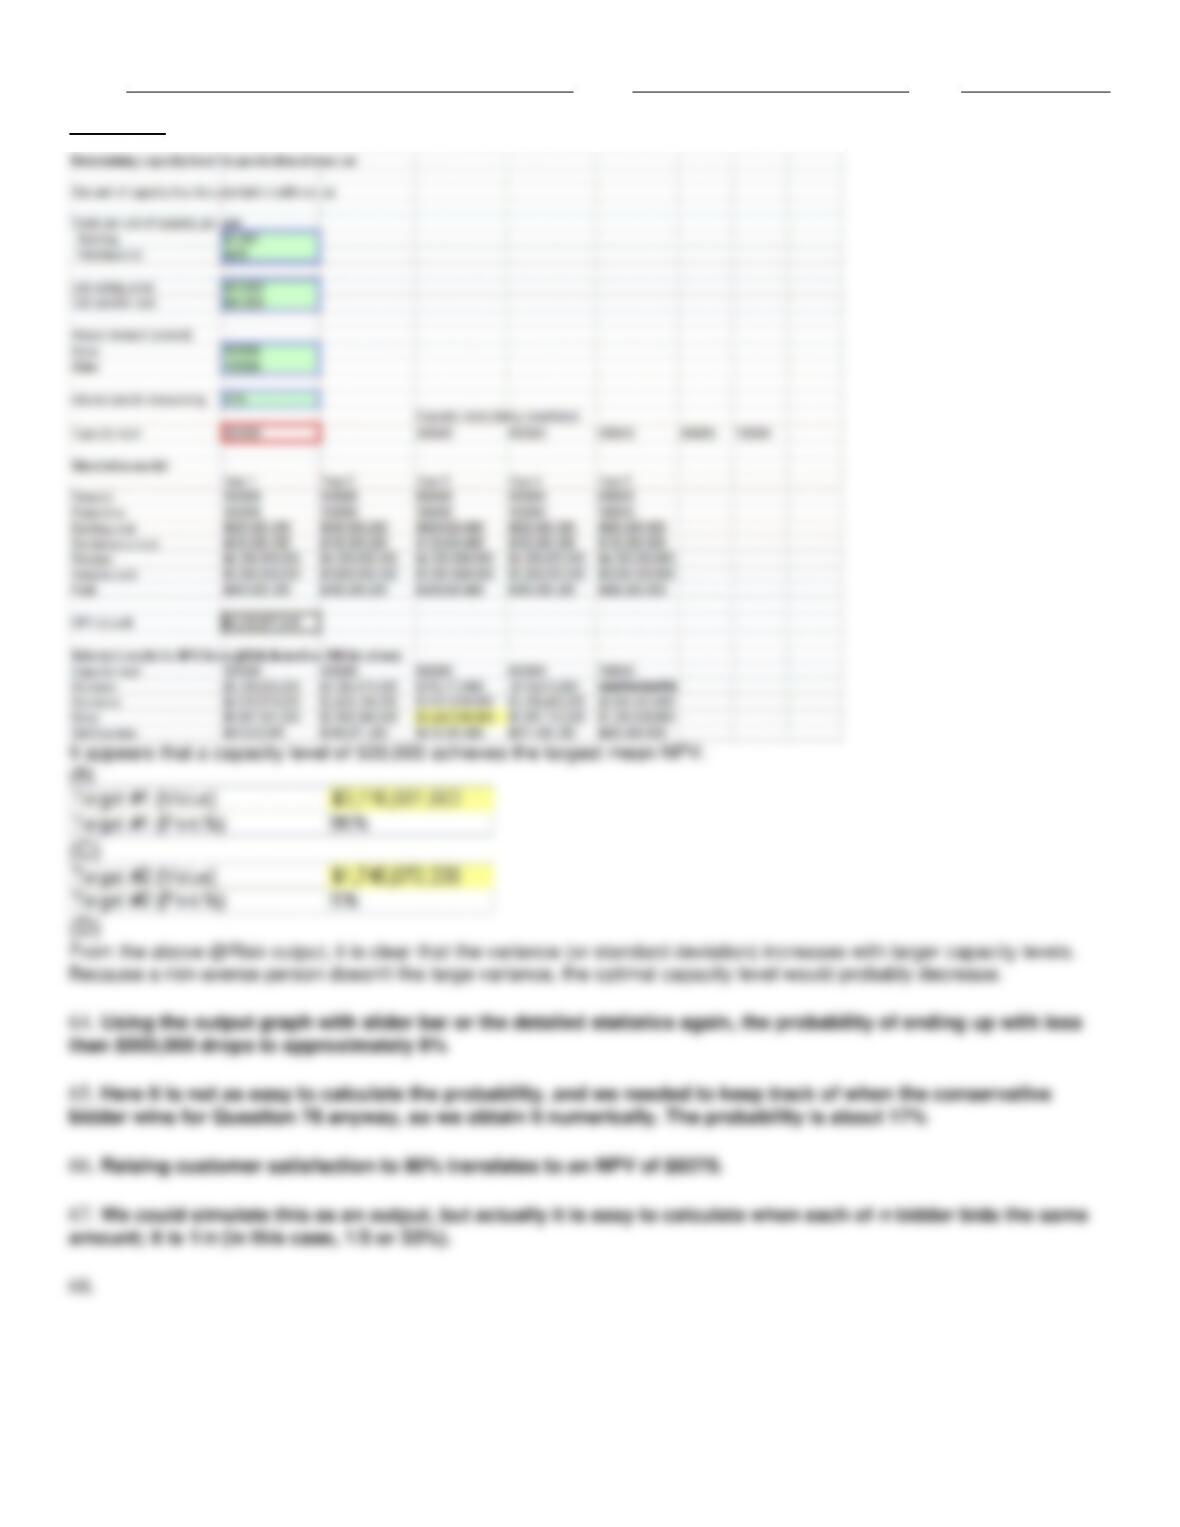
Because a risk-averse person doesn’t like large variance, the optimal capacity level would probably decrease.
Name:
Class:
Date:
chapter 16
Name:
Class:
Date:
chapter 16
Name:
Class:
Date:
chapter 16
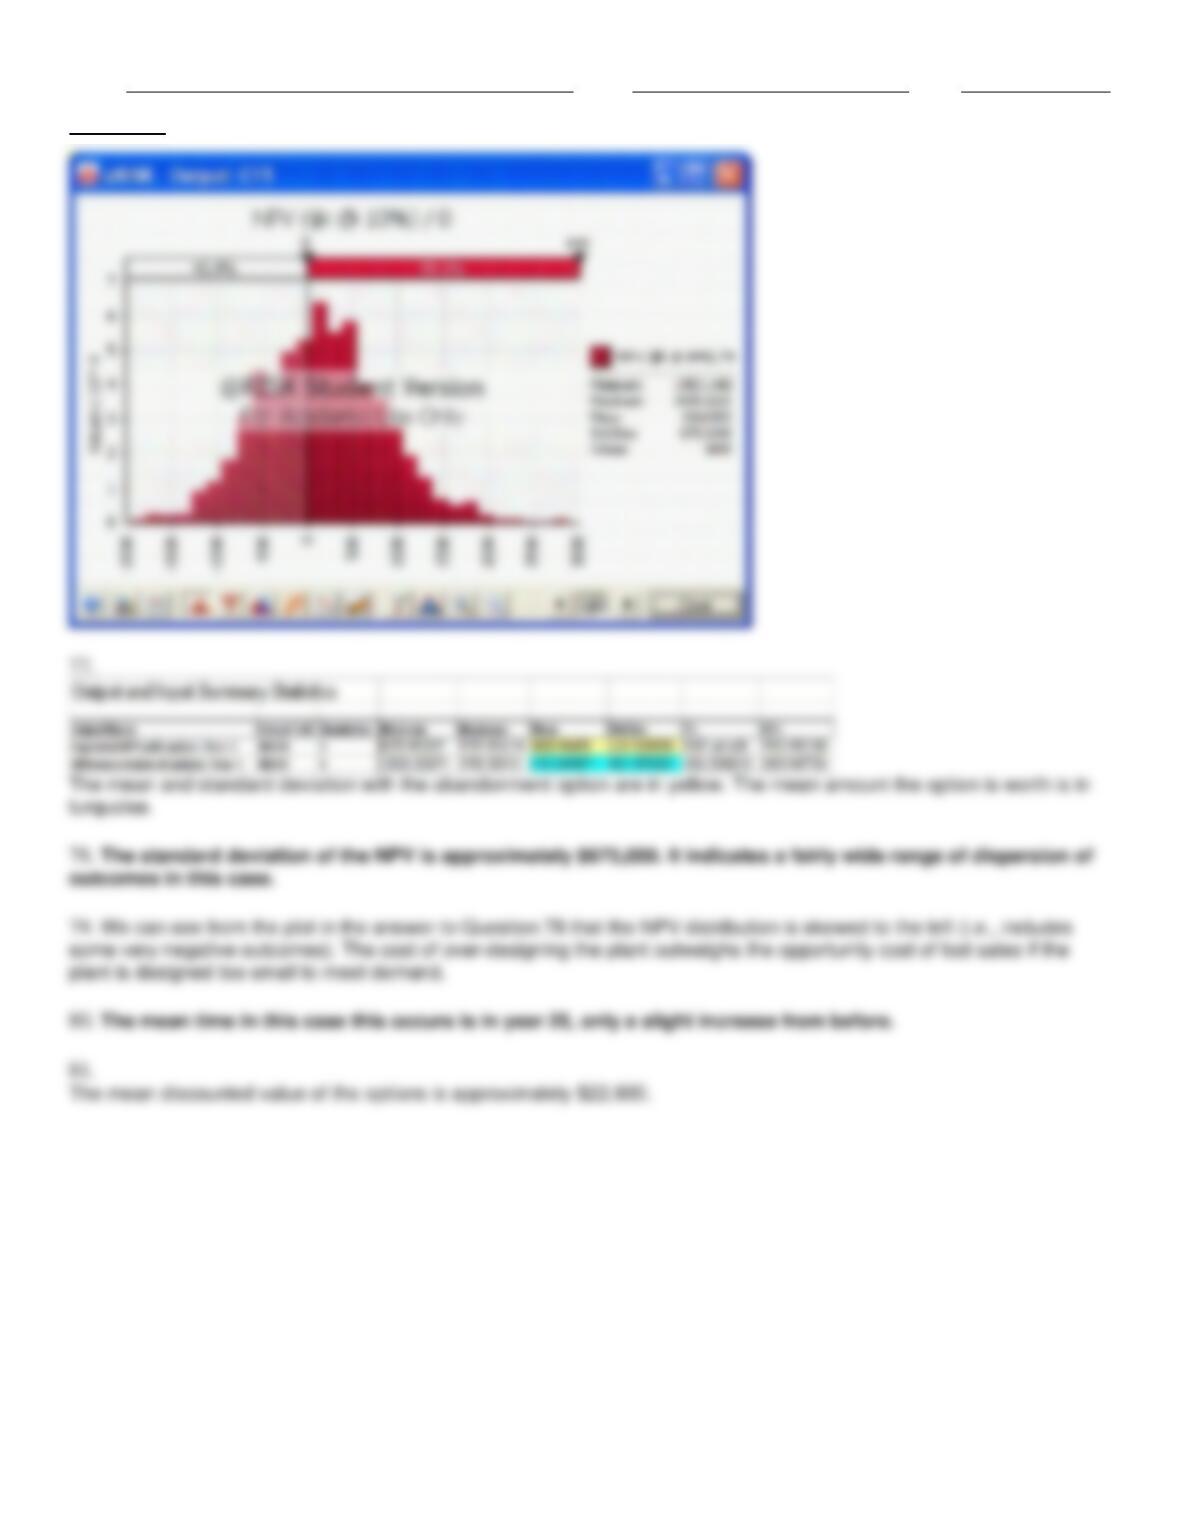
$420,000.
Name:
Class:
Date:
chapter 16
turquoise.
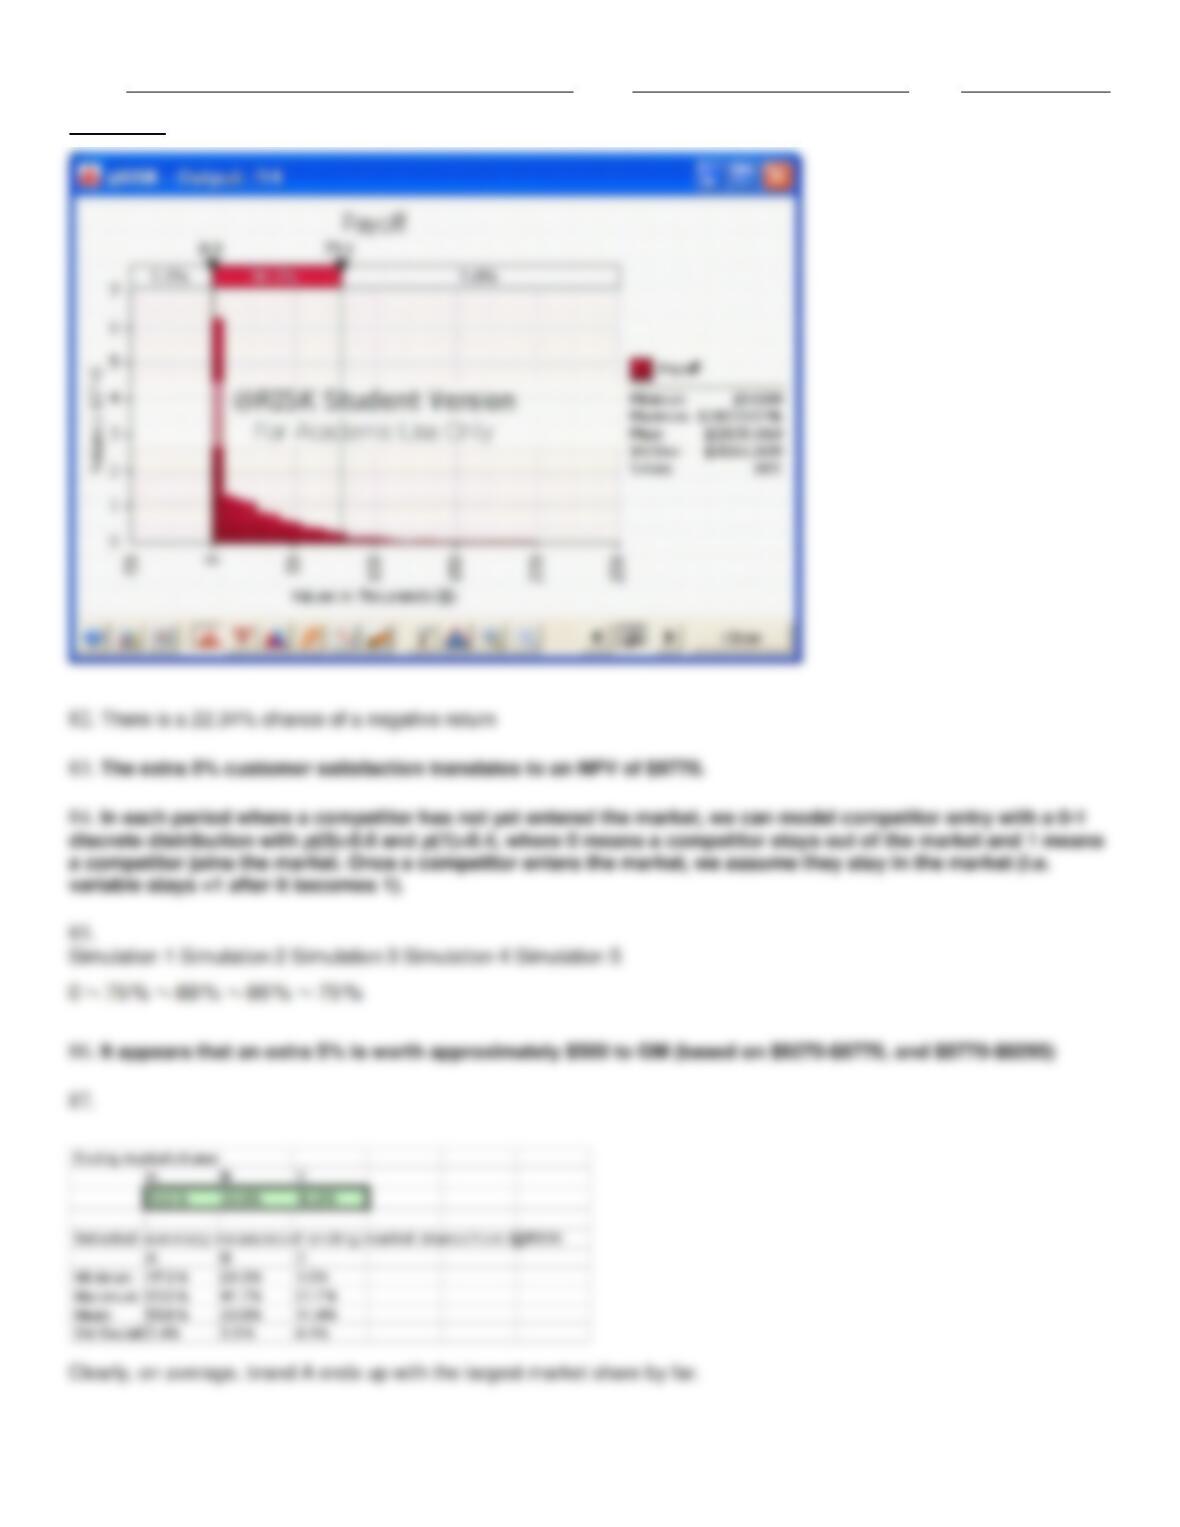
plant is designed too small to meet demand.
Name:
Class:
Date:
chapter 16
Name:
Class:
Date:
chapter 16
Name:
Class:
Date:
chapter 16
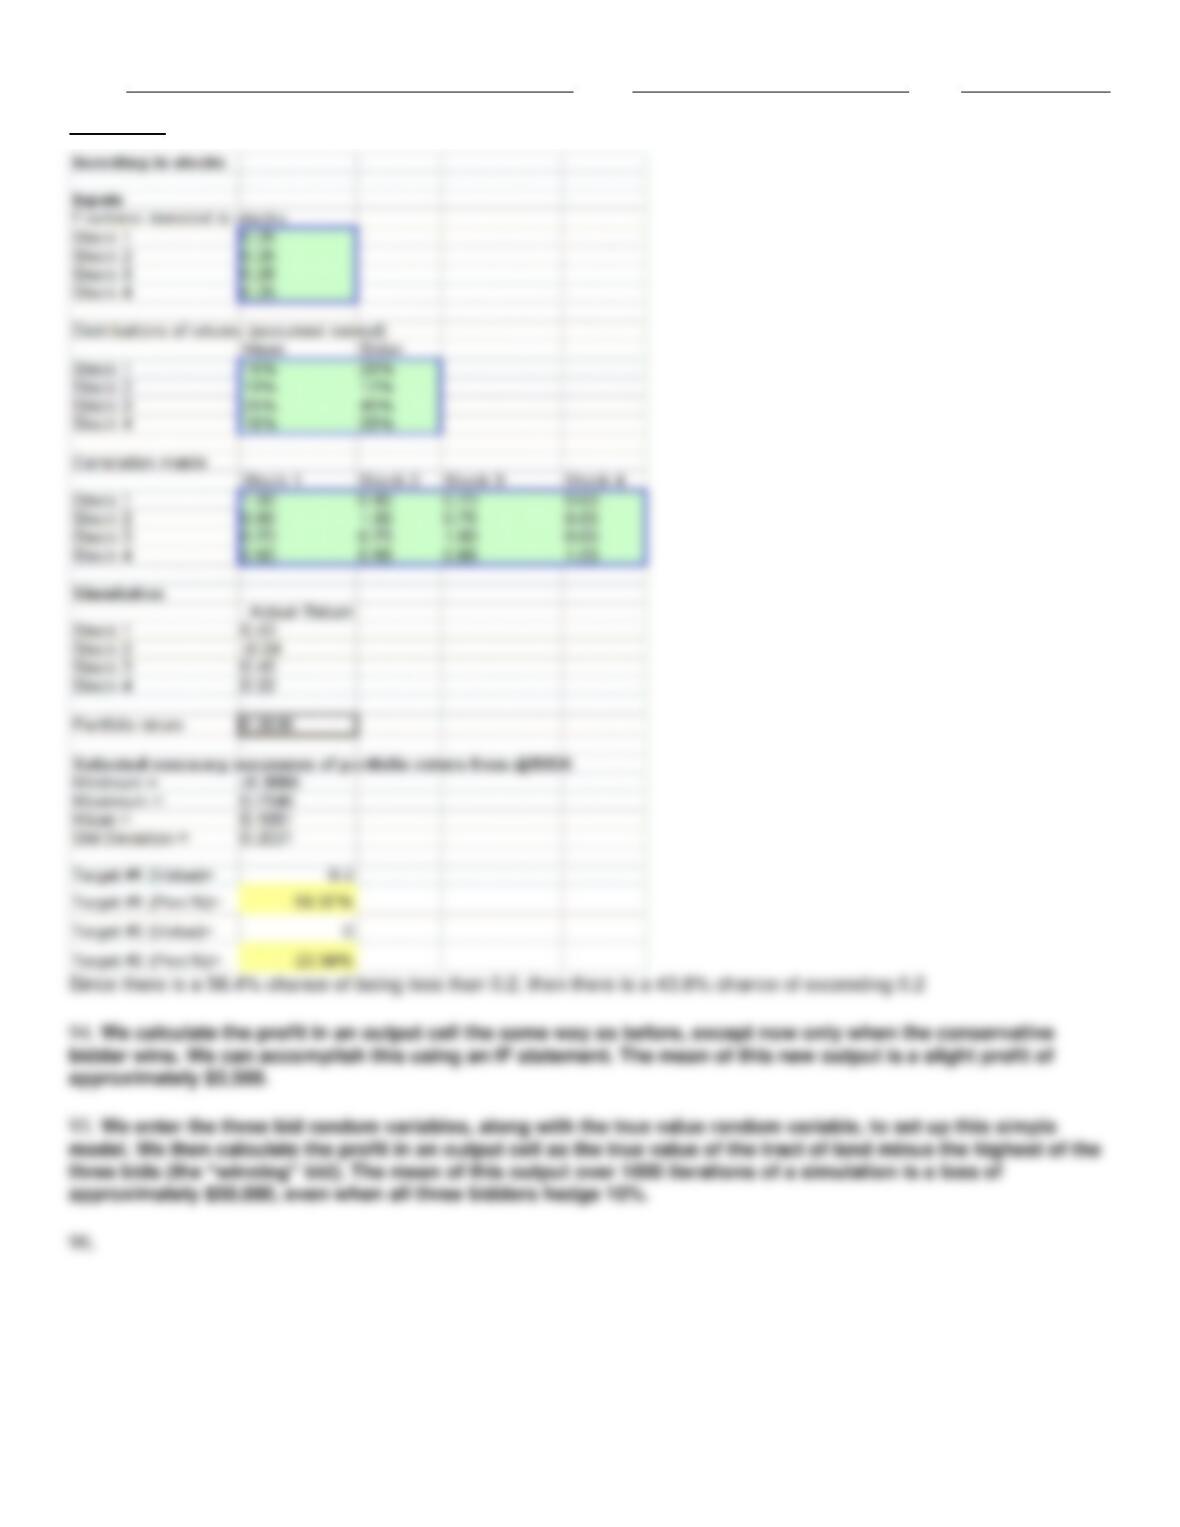
Since there is a 56.4% chance of being less than 0.2, then there is a 43.6% chance of exceeding 0.2
Name:
Class:
Date:
chapter 16
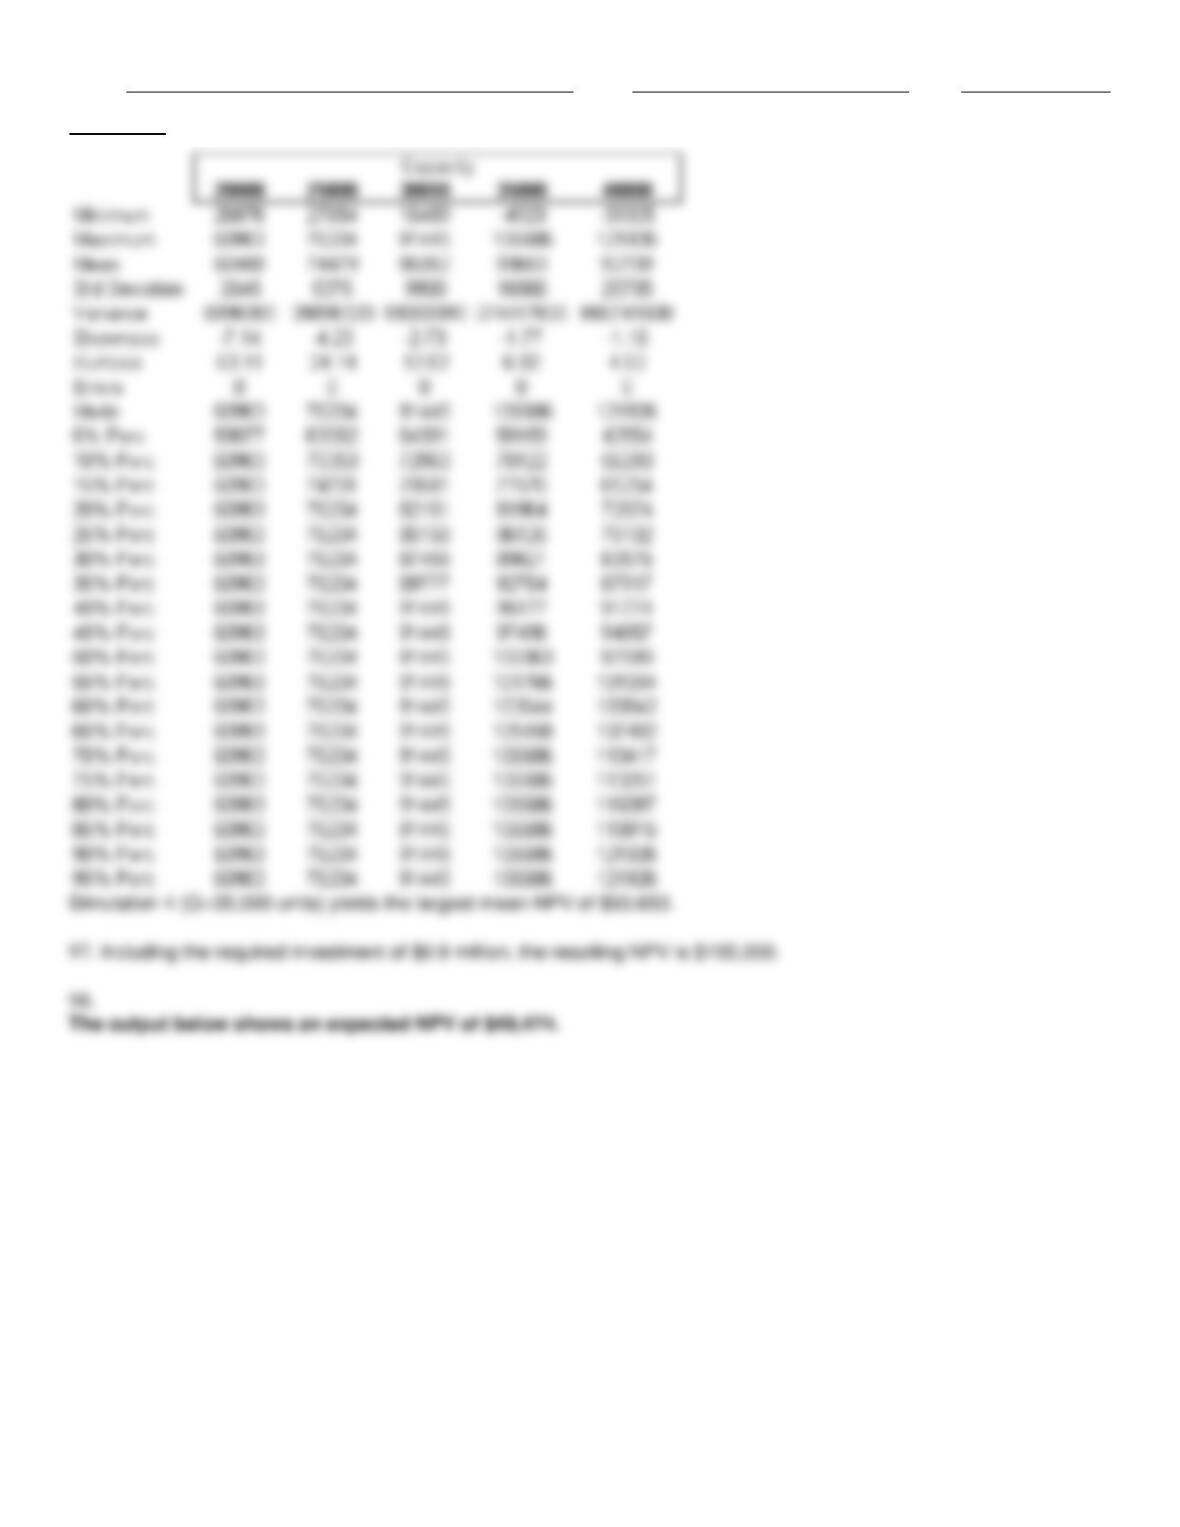
Simulation 4 (Q=35,000 units) yields the largest mean NPV of $93,653.
Name:
Class:
Date:
chapter 16
Name:
Class:
Date:
chapter 16
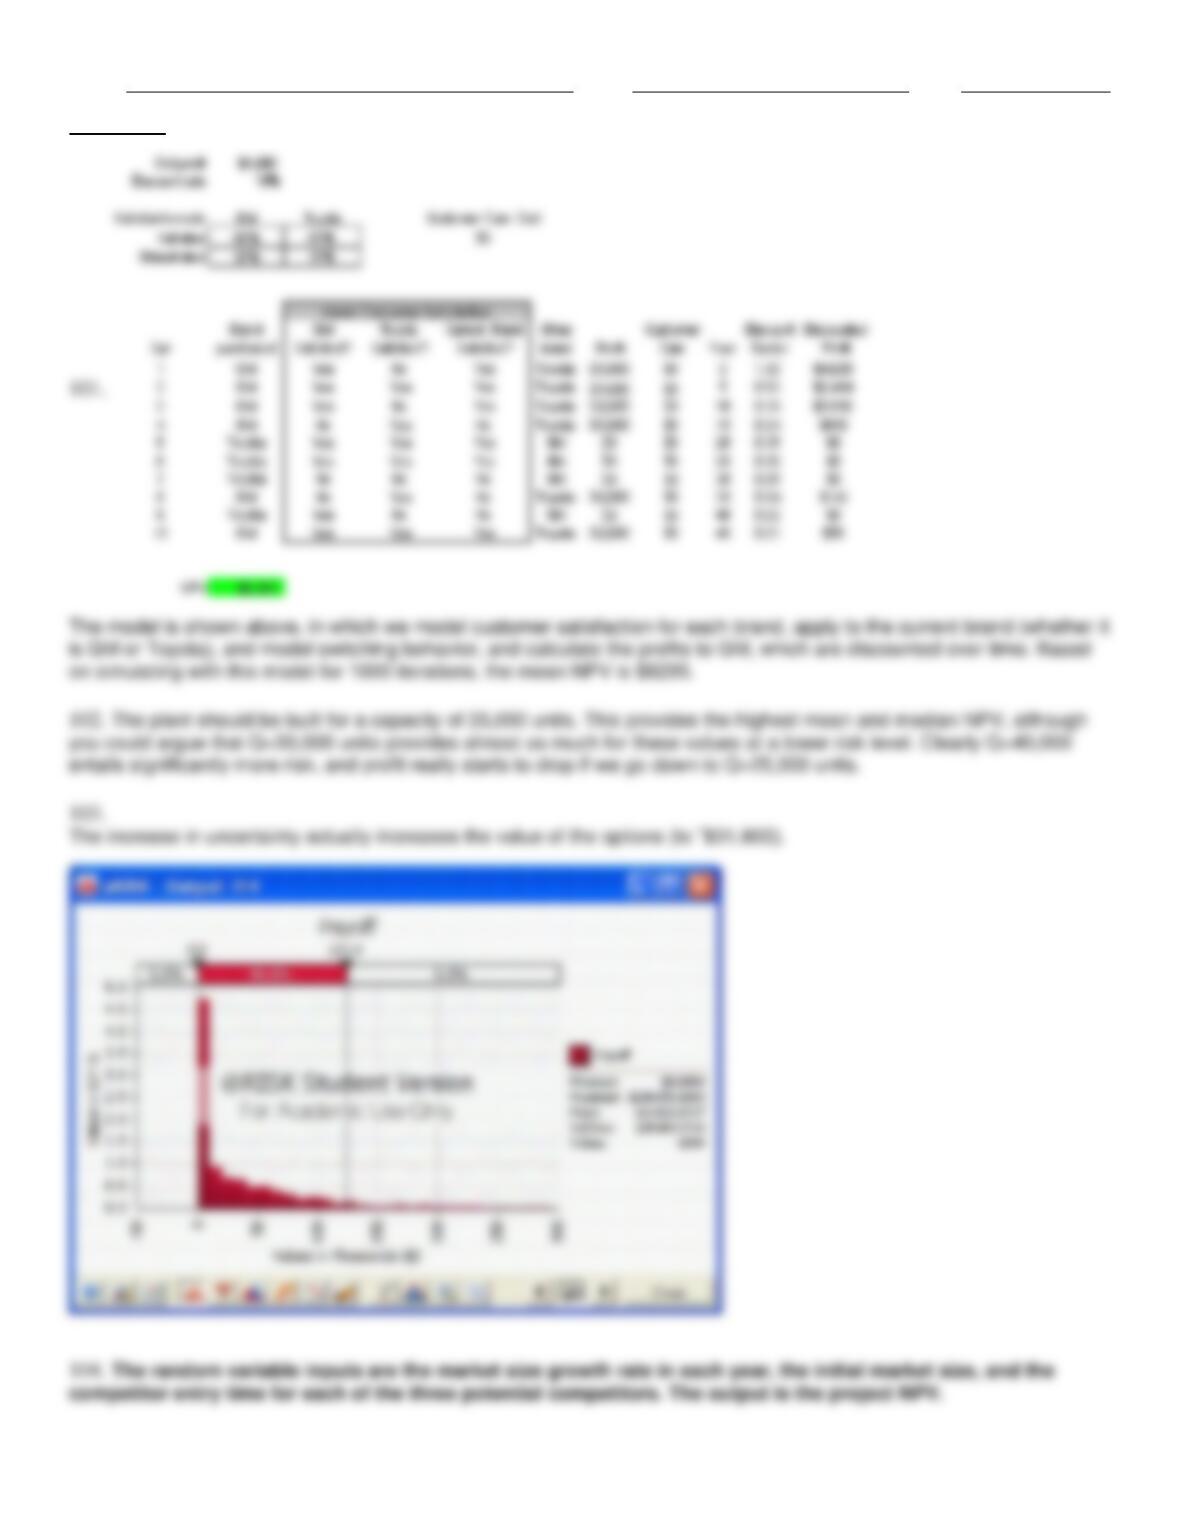
entails significantly more risk, and profit really starts to drop if we go down to Q=25,000 units.

Name:
Class:
Date:
chapter 16