93)
The Federal Reserve’s two main monetary policy targets are
93)
A)
price stability and the money supply.
B)
interest rates and high employment.
C)
the money supply and interest rates.
D)
price stability and high employment.
94)
Monetary policy could be procyclical if the Federal Reserve
94)
A)
is quick to recognize that a recession has begun and conducts expansionary monetary policy.
B)
is late recognizing that a recession has begun and conducts expansionary monetary policy.
C)
is late recognizing that a recession has begun and does not conduct expansionary monetary
policy.
D)
is quick to recognize that a recession has begun and does not conduct expansionary monetary
policy.
95)
The interest rate on a Treasury bill that you pay $980 for today that matures in one year and pays
$1,000 is
95)
A)
4 percent.
B)
1 percent.
C)
2 percent.
D)
3 percent.
SHORT ANSWER. Write the word or phrase that best completes each statement or answers the question.
96)
What is the interest rate for a Treasury bill that pays $1,000 in one year, if the price of the
Treasury bill today is 943? What is the interest rate for the Treasury bill if its price is 917?
96)
32
97)
What is the price of a Treasury bill that pays $1,000 in one year, if its interest rate is 10
percent? What is the price of the Treasury bill if its interest rate is 8 percent?
97)
98)
According to the Taylor rule, does the target for the federal funds rate respond differently
for an increase in inflation caused by an increase in aggregate demand and for an increase
in inflation caused by a decrease in short–run aggregate supply? Explain whether there is
or is not a difference in how the target for the federal funds rate changes.
98)
99)
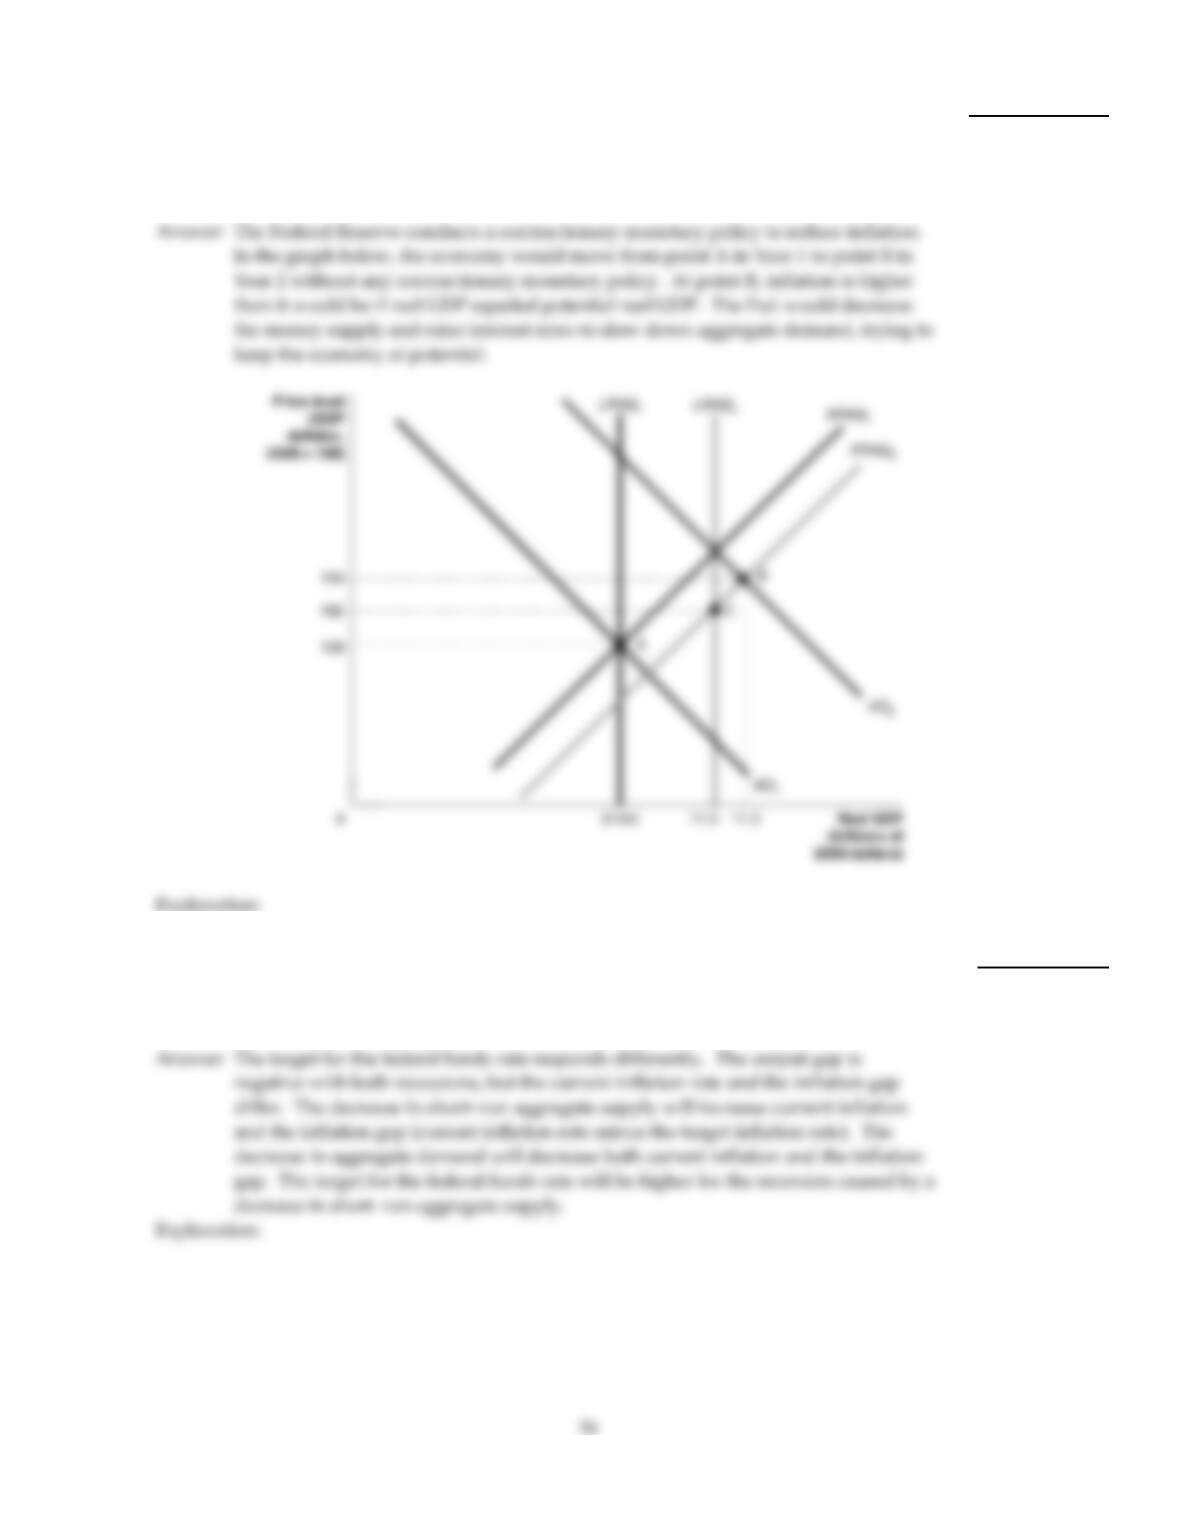
Use the dynamic aggregate demand and aggregate supply model and start with Year 1 in
long–run macroeconomic equilibrium. For Year 2, graph aggregate demand, long–run
aggregate supply, and short–run aggregate supply such that the condition of the economy
will induce the Federal Reserve to conduct a contractionary monetary policy. Briefly
explain the condition of the economy and what the Federal Reserve is attempting to do.
99)
100)
In the Taylor rule, does the target for the federal funds rate respond differently for a
recession caused by a decrease in aggregate demand and for a recession caused by a
decrease in short–run aggregate supply? Explain whether there is or is not a difference in
how the target for the federal funds rate changes.
100)
101)
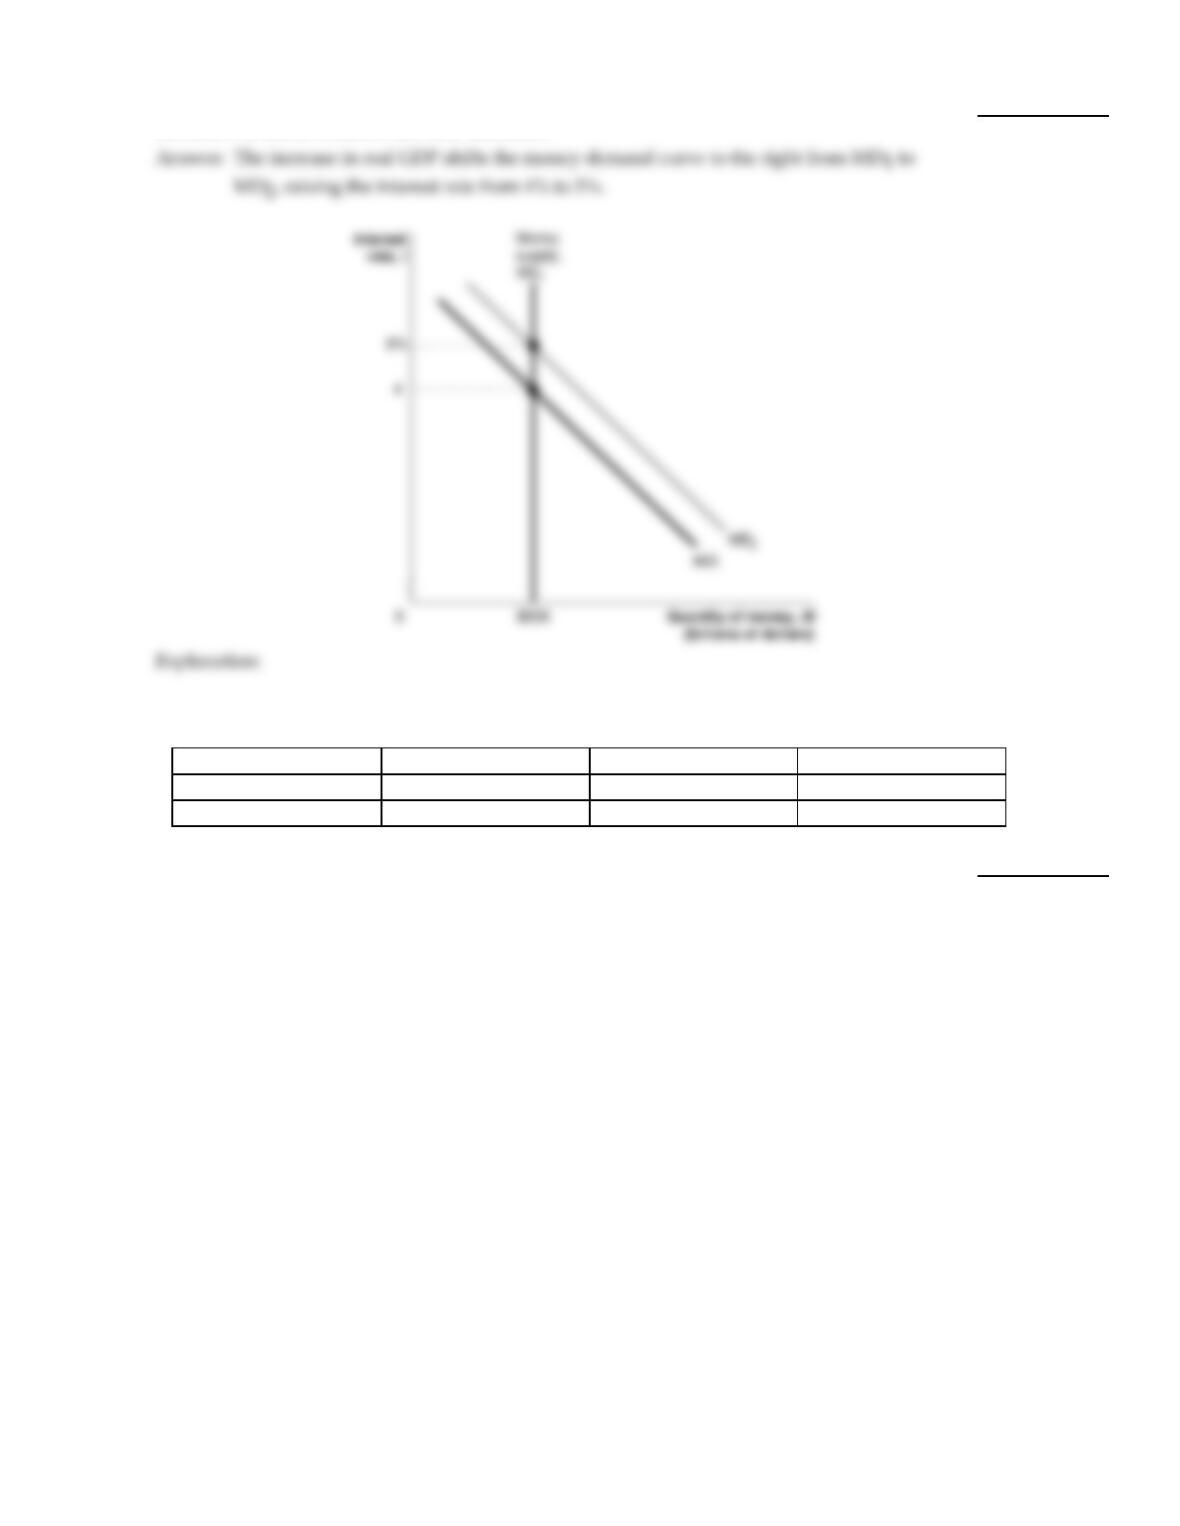
Use the money demand and money supply model to show graphically and briefly explain
the effect on interest rates if real GDP increases.
101)
Table 16–2
Year Potential Real GDP Real GDP Price Level
2010 $13.5 trillion $13.5 trillion 142
2015 $14.0 trillion $14.4 trillion 150
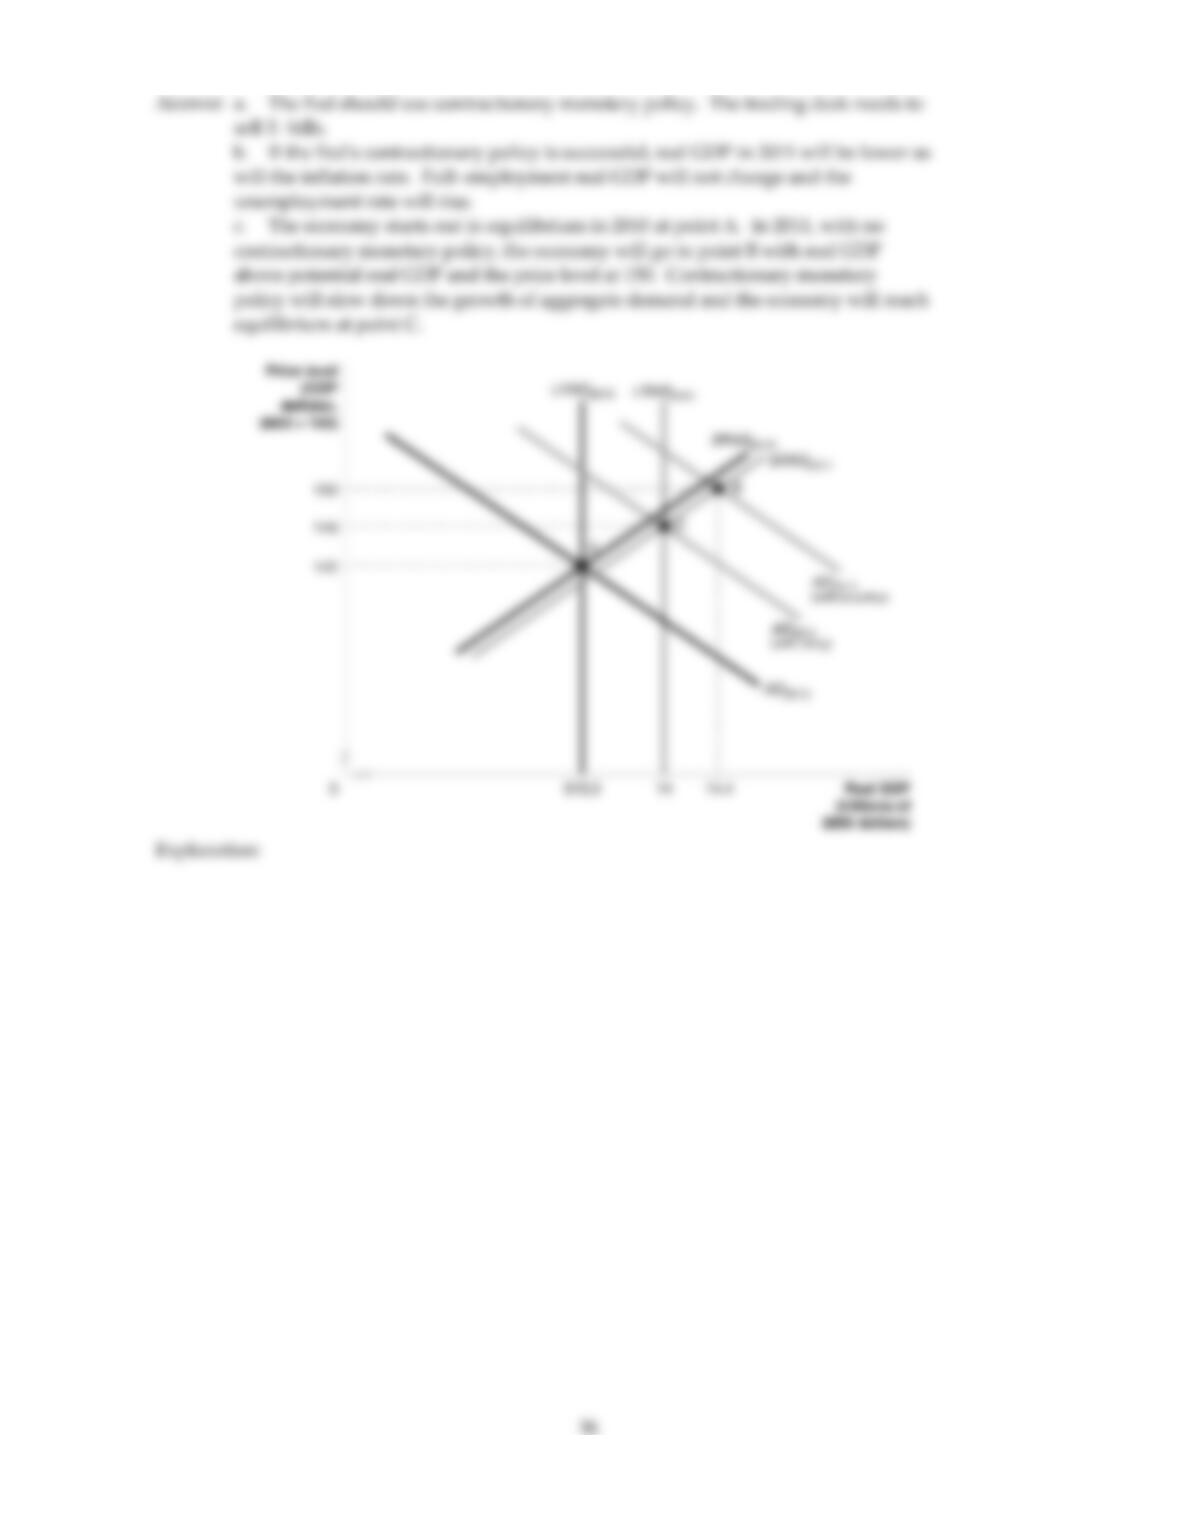
102)
Refer to Table 16–2. The hypothetical information in the table shows what the values for
real GDP and the price level will be in 2011 if the Federal Reserve does not use monetary
policy:
a. If the Fed wants to keep real GDP at its potential level in 2011, should it use an
expansionary policy or a contractionary policy? Should the trading desk buy T–bills or
sell them?
b. Suppose the Fed’s policy is successful in keeping real GDP at its potential level in 2011.
State whether each of the following will be higher or lower than if the Fed had taken no
action:
(i) Real GDP
(ii) Full–employment real GDP
(iii) The inflation rate
(iv) The unemployment rate
c. Draw an aggregate demand and aggregate supply graph to illustrate your answer. Be
sure that your graph contains LRAS curves for 2010 and 2011; SRAS curves 2010 and
2011; AD curve for 2010 and 2011, with and without monetary policy actions; and
equilibrium real GDP and the price level in 2011 with and without policy.
102)
35
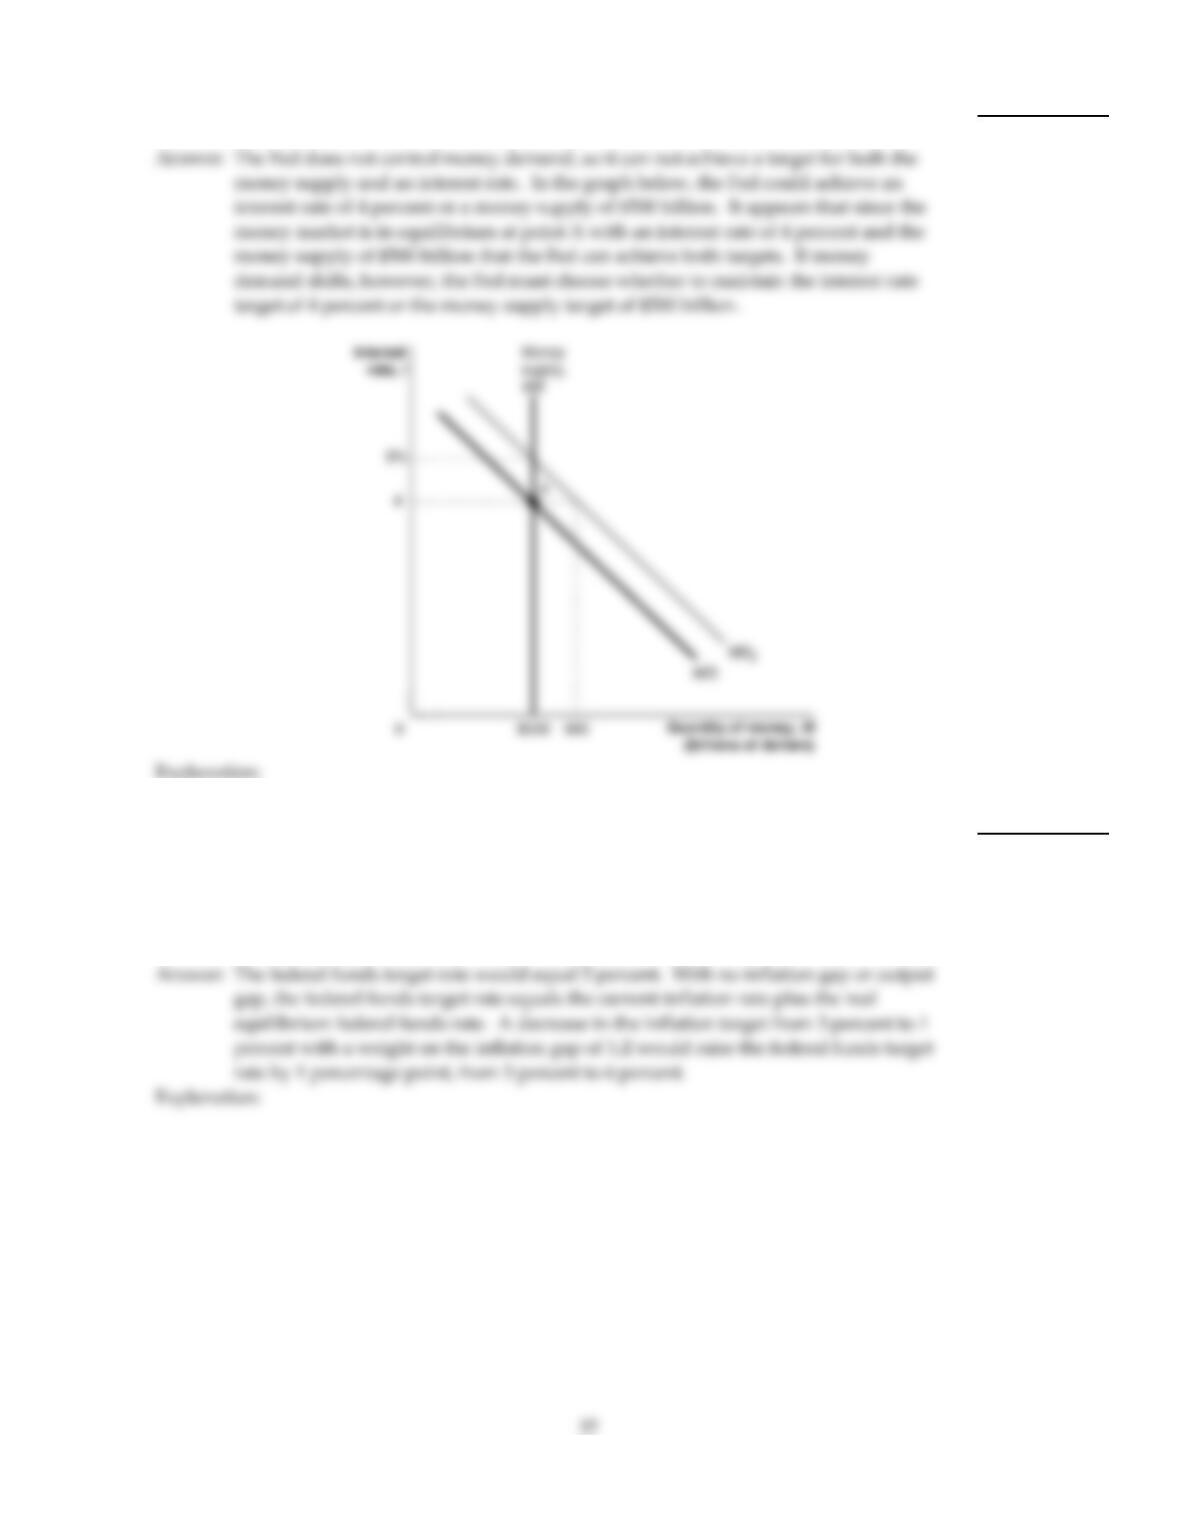
103)
Using the money demand and money supply model, show and explain why the Federal
Reserve cannot achieve a target for both the money supply and an interest rate.
103)
104)
Consider the Taylor rule for the target of the federal funds rate. Suppose the equilibrium
real federal funds rate is 2 percent, the target rate of inflation is 3 percent, the current
inflation rate is 3 percent, real GDP equals potential real GDP, and the weights are 1/2 for
the inflation gap and the output gap. Using the Taylor rule, what does the target for the
federal funds rate equal? Next, if the Federal Reserve lowered the target for the inflation
rate to 1 percent, how much would the target for the federal funds rate change?
104)
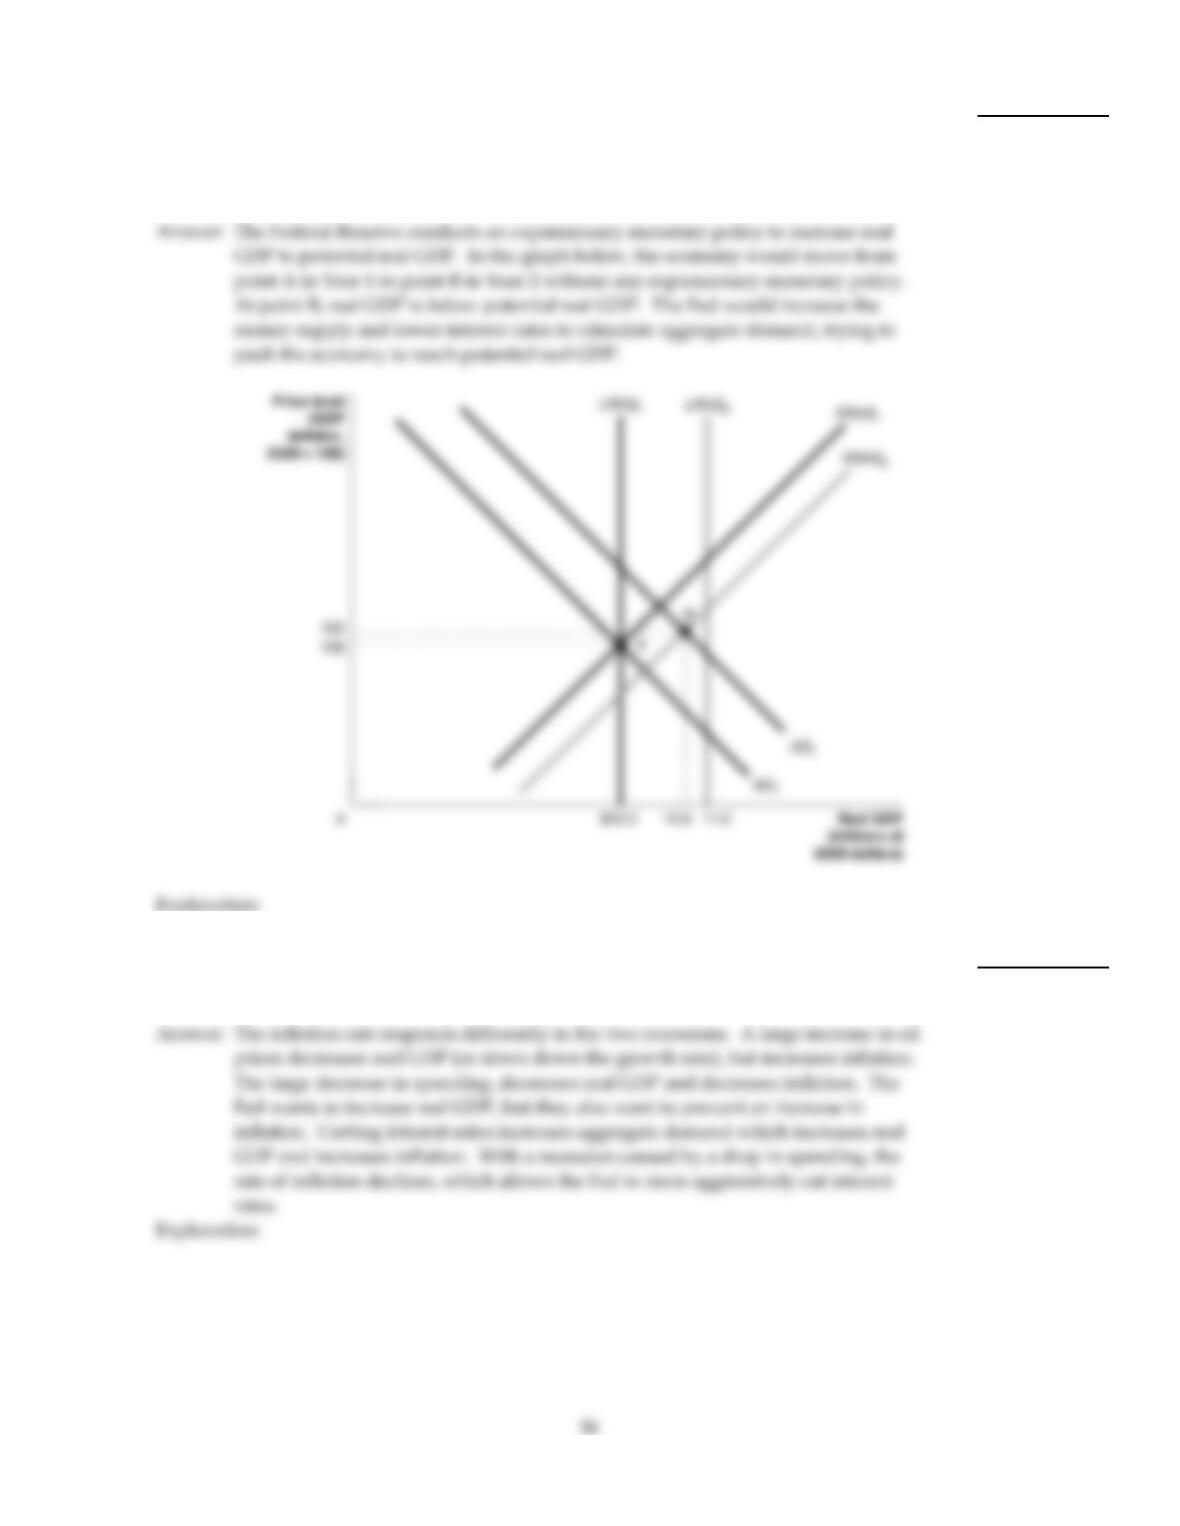
105)
Use the dynamic aggregate demand and aggregate supply model and start with Year 1 in
long–run macroeconomic equilibrium. For Year 2, graph aggregate demand, long–run
aggregate supply, and short–run aggregate supply such that the condition of the economy
will induce the Federal Reserve to conduct an expansionary monetary policy. Briefly
explain the condition of the economy and what the Federal Reserve is attempting to do.
105)
106)
Would the Federal Reserve respond more aggressively with interest rate cuts in a recession
caused by a decrease in spending, as in the 2001 recession, than in a recession caused by an
increase in oil prices, as in the 1974–75 recession?
106)
107)
Does the money demand curve have a positive slope or a negative slope? Why does it
have this slope? Explain why an increase in the variable on the vertical axis of the money
demand curve causes either an increase or a decrease in the variable on the horizontal axis
of the money demand curve.
107)
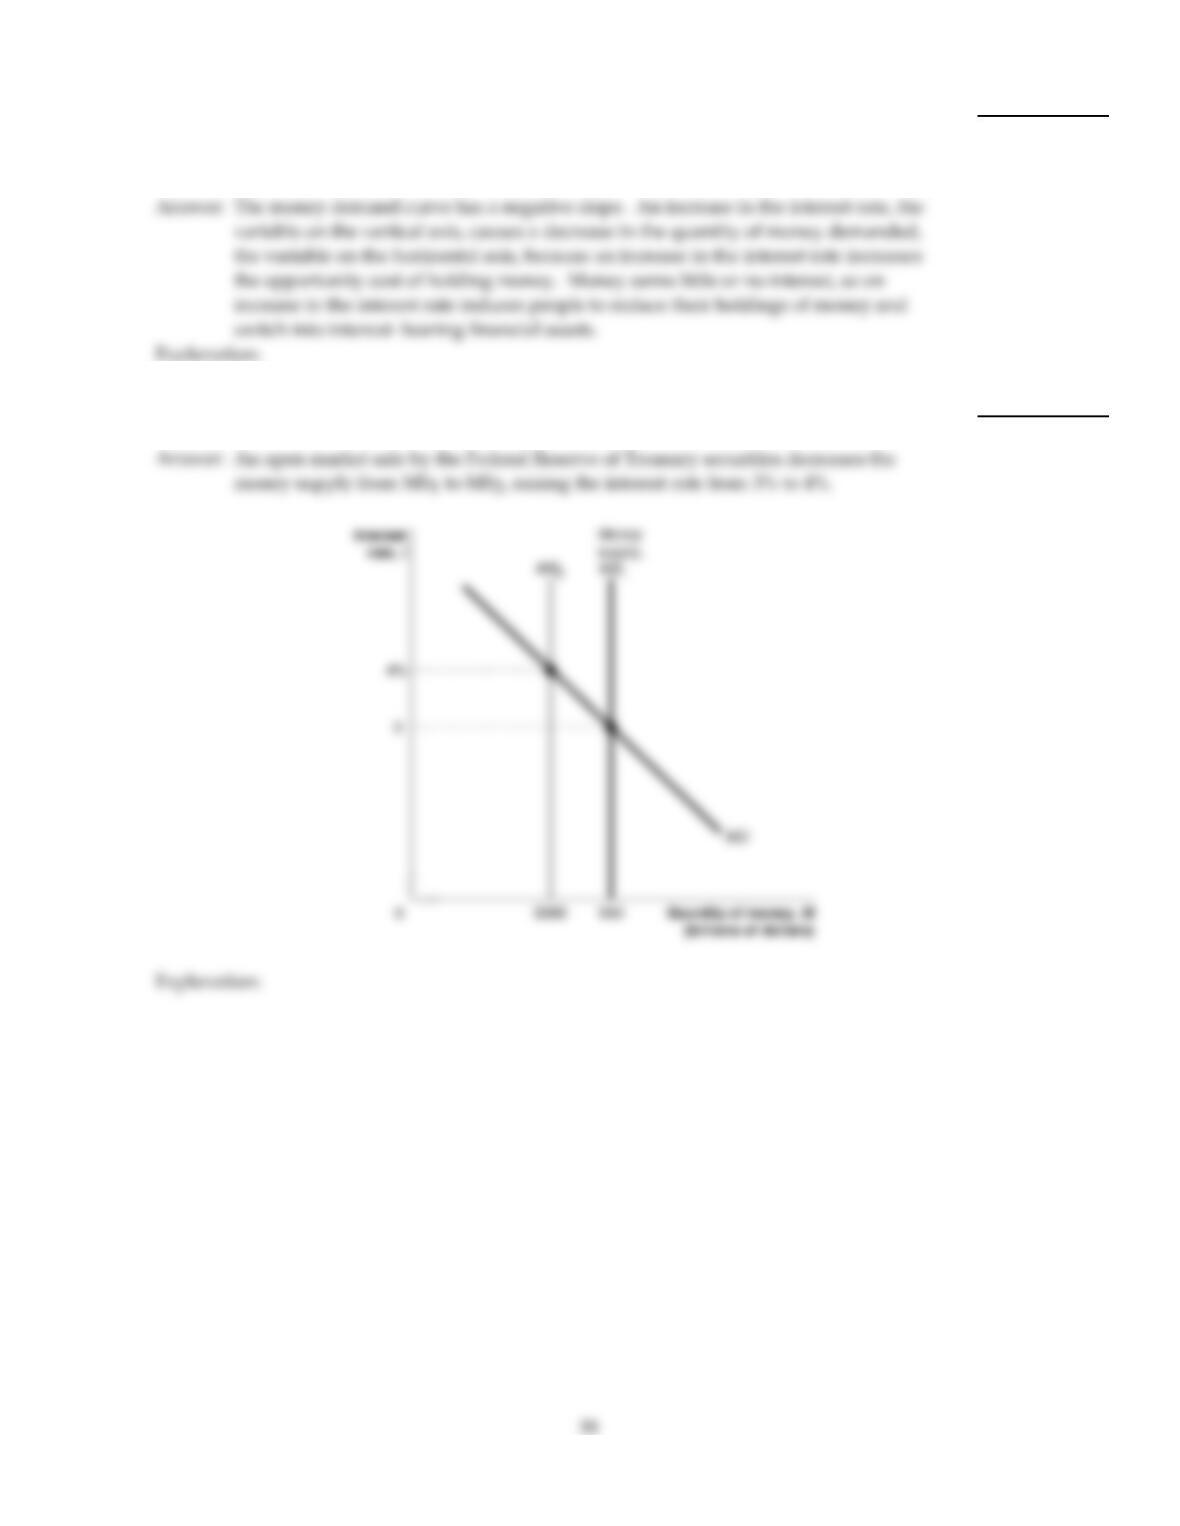
108)
Use the money demand and money supply model to show graphically and explain the
effect on interest rates of the Federal Reserve’s open market sale of Treasury securities.
108)
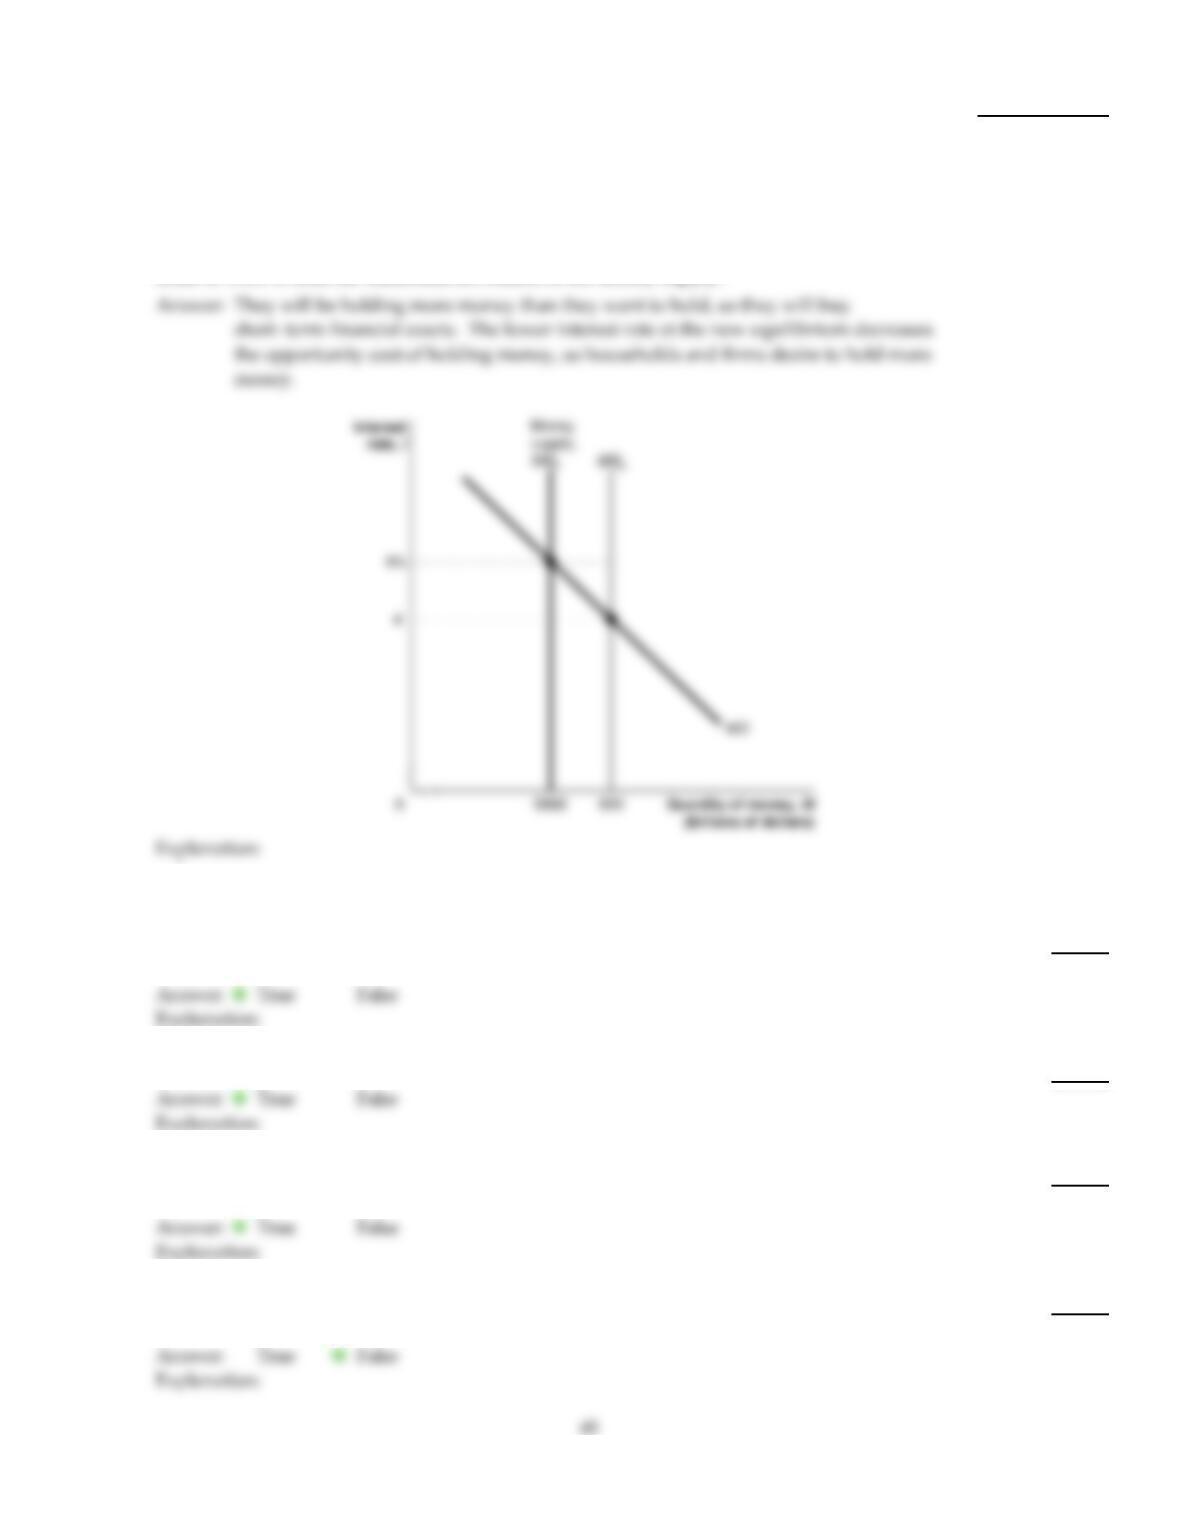
109)
Use the money demand and money supply model to show the money market in
equilibrium with an interest rate of 5 percent and the quantity of money of $800 billion.
Suppose the Federal Reserve increases the money supply to $850 billion. At the previous
equilibrium interest rate of 5 percent, will households and firms now be holding more
money or less money than they want to hold, and will they be buying or selling short–term
financial assets? At the new equilibrium interest rate, households and firms will desire to
hold the entire $850 billion quantity of the money supply. What causes households and
firms to want to hold the additional $50 billion of the money supply?
109)
TRUE/FALSE. Write ‘T’ if the statement is true and ‘F’ if the statement is false.
110)
Inflation rates during the years 1979–1981 were the highest the United States has ever experienced
during peacetime.
110)
111)
The prices of financial assets and their interest rates move in opposite directions.
111)
112)
The Federal Reserve’s performance in the mid–to–late 1980s, 1990s, and early 2000s has received
high marks from economists, even without inflation targeting.
112)
113)
The Federal Home Loan Mortage Corporation and the Federal National Mortgage Association were
established by Congress in order to regulate banks that buy and sell mortage–backed securities.
113)
114)
The Fed can simultaneously reduce the inflation rate and stimulate growth through lowering
interest rates.
114)
115)
The relationship between GDP and the money supply has gotten stronger since the 1980s.
115)
116)
The Fed can directly lower the inflation rate.
116)
117)
The Fed has adopted an interest rate target for most of the time since World War II.
117)
118)
A borrower defaults on a loan when he stops making payments on the loan.
118)