Chapter 16 – Financial Statement Analysis
20X1
20X0
Accounts payable
$ 80,000
$ 40,000
Accrued liabilities
65,000
25,000
Taxes payable
10,000
20,000
Short-term notes payable
-0-
60,000
Bonds payable due within next year
200,000
200,000
Total current liabilities
$355,000
$345,000
Bonds payable
$800,000
$300,000
Common stock, $5 par
$1,000,000
$1,000,000
Retained earnings
695,000
55,000
Total stockholders’ equity
$1,695,000
$1,055,000
Total liabilities and stockholders’ equity
$2,850,000
$1,700,000
Net income for 20X1 and 20X0 was $340,000 and $300,000, respectively. Interest expense was $45,000 for 20X1 and the
tax rate is 30%. Answer the following:
A.
Calculate the return on common stockholders’ equity ratio for 20X1.
B.
Calculate the return on total assets ratio for 20X1.
C.
What is the difference between the return on stockholders’ equity and the return on
assets?
B.
{Net income + [interest expense × (1 − tax rate)]} / Average total assets =
[$340,000 + ($45,000 × 0.70)] / [($2,850,000 + $1,700,000) / 2] = 16.3%
158. The following ratios have been computed for Gilbert Company for 20X1.
Return on sales
20%
Times-interest-earned ratio
15
Accounts receivables turnover ratio
5
Acid-test ratio
1.60 : 1
Current ratio
3 : 1
Debt ratio
26%
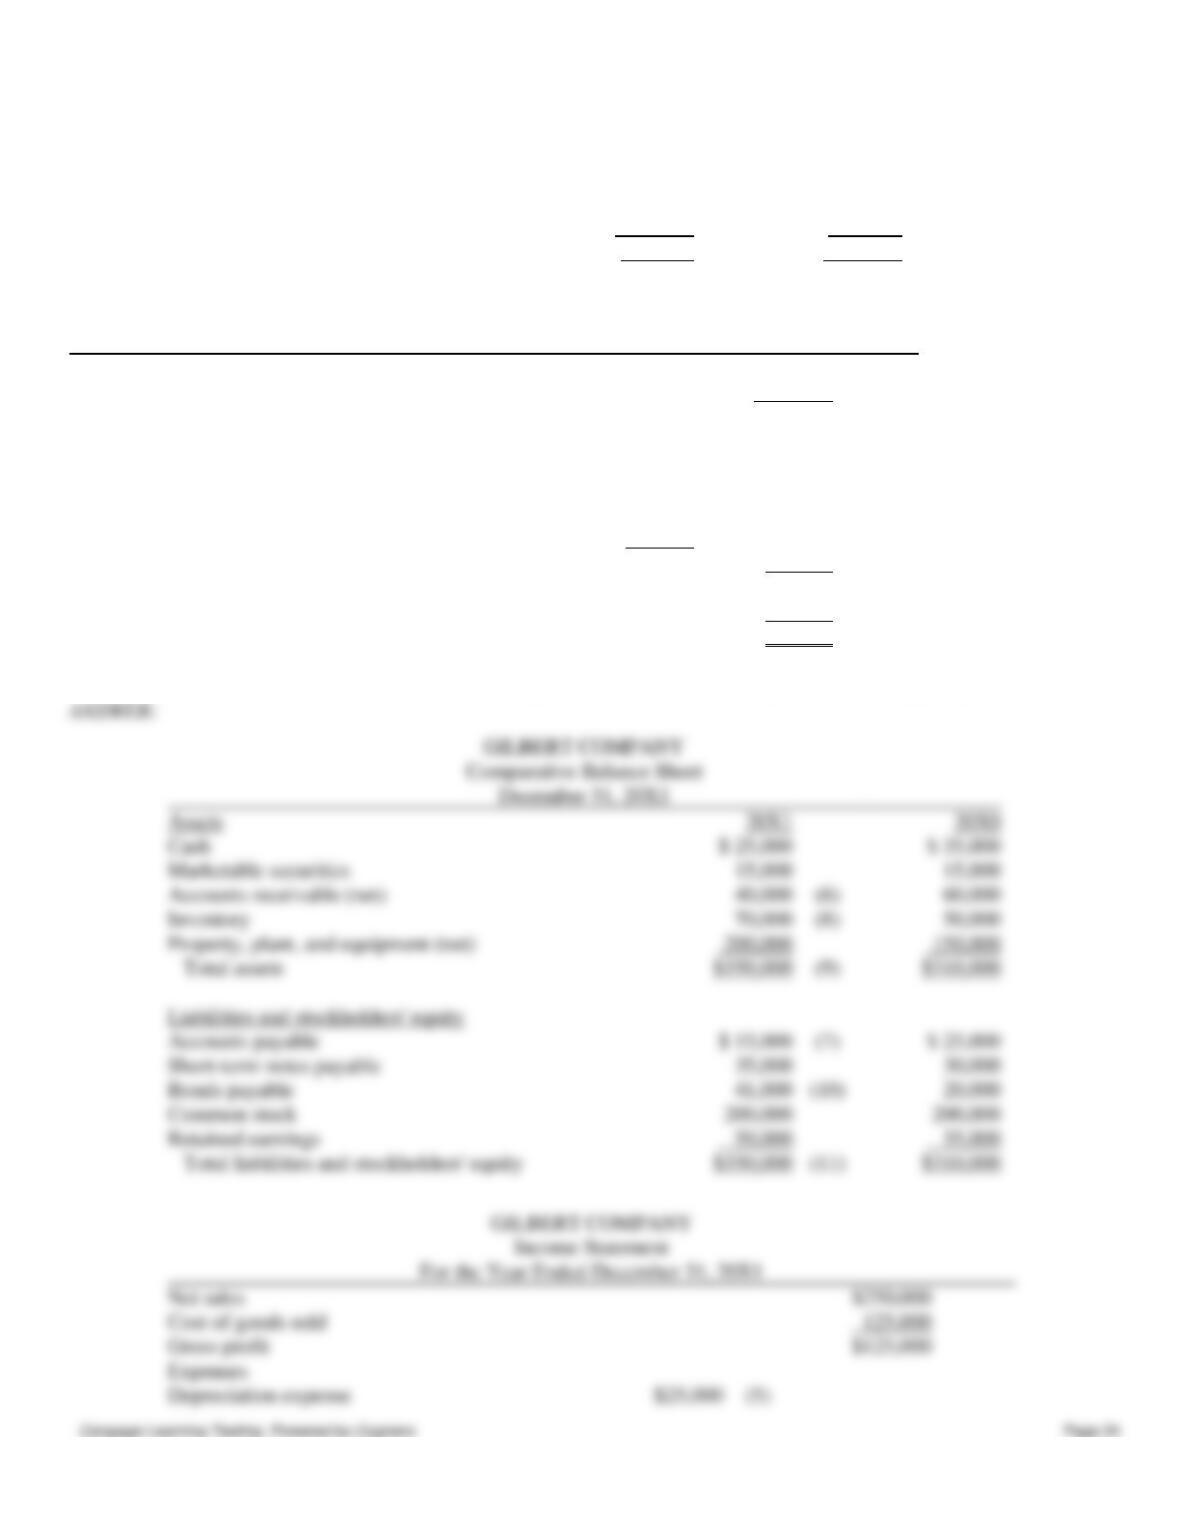
Gilbert Company’s 20X1 financial statements with missing information follow:
GILBERT COMPANY
Comparative Balance Sheet
December 31, 20X1
Assets
20X1
20X0
Cash
$ 25,000
$ 35,000
Short-term Investments
15,000
15,000
Accounts receivable (net)
?
(6)
60,000
Inventory
?
(8)
50,000
Property, plant, and equipment (net)
200,000
150,000
Total assets
$ ?
(9)
$310,000
Liabilities and stockholders’ equity
Chapter 16 – Financial Statement Analysis
Accounts payable
$ ?
(7)
$ 25,000
Short-term notes payable
35,000
30,000
Bonds payable
?
(10)
20,000
Common stock
200,000
200,000
Retained earnings
59,000
35,000
Total liabilities and stockholders’ equity
$ ?
(11)
$310,000
GILBERT COMPANY
Income Statement
For the Year Ended December 31, 20X1
Net sales
$250,000
Cost of goods sold
125,000
Gross profit
$125,000
Expenses:
Depreciation expense
$ ?
(5)
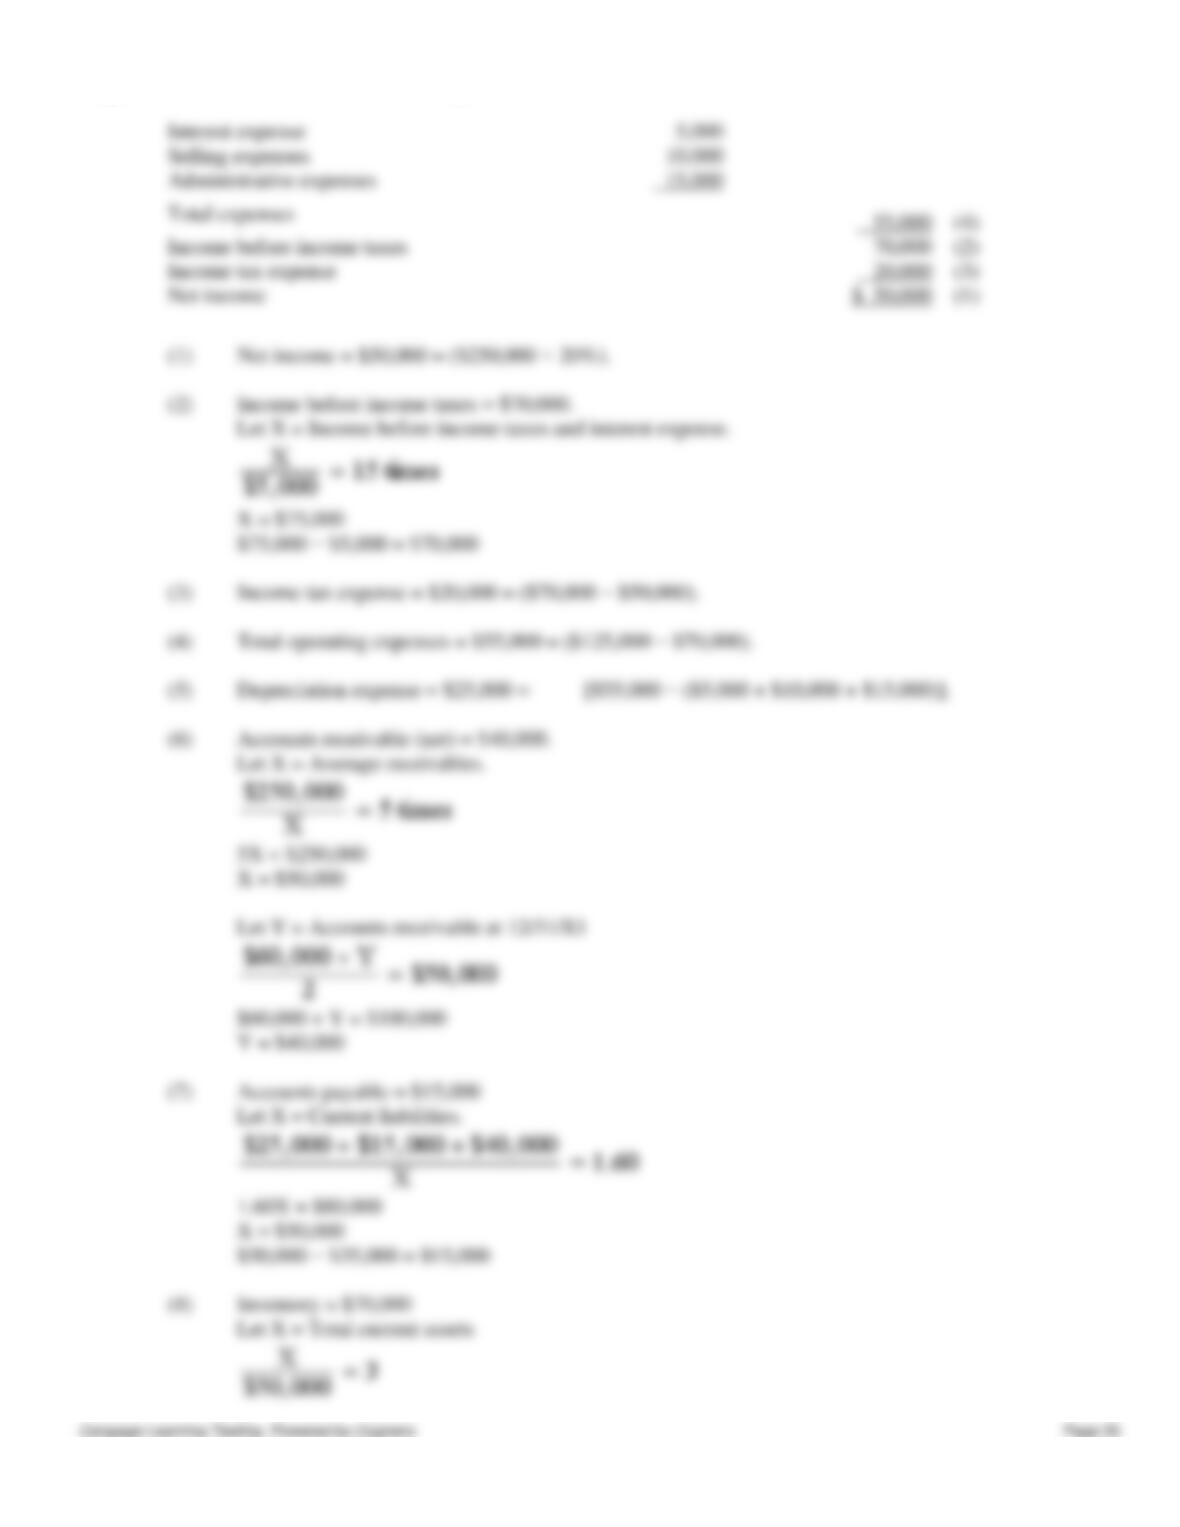
Interest expense
5,000
Selling expenses
10,000
Administrative expenses
15,000
Total expenses
?
(4)
Income before income taxes
$ ?
(2)
Income tax expense
?
(3)
Net income
$ ?
(1)
Required: Use the above ratios and information from the Gilbert Company financial statements to fill in the missing
information on the financial statements. Follow the sequence indicated. Show computations that support your answers.
Assets
20X1
20X0
Cash
$ 25,000
$ 35,000
Marketable securities
15,000
15,000
Accounts receivable (net)
40,000
(6)
60,000
Inventory
70,000
(8)
50,000
Property, plant, and equipment (net)
200,000
150,000
Total assets
$350,000
(9)
$310,000
Liabilities and stockholders’ equity
Accounts payable
$ 15,000
(7)
$ 25,000
Short-term notes payable
35,000
30,000
Bonds payable
41,000
(10)
20,000
Common stock
200,000
200,000
Retained earnings
59,000
35,000
Total liabilities and stockholders’ equity
$350,000
(11)
$310,000
GILBERT COMPANY
Income Statement
For the Year Ended December 31, 20X1
Net sales
$250,000
Cost of goods sold
125,000
Gross profit
$125,000
Expenses
Depreciation expense
$25,000
(5)
Chapter 16 – Financial Statement Analysis
Chapter 16 – Financial Statement Analysis
159. Winter Corporation has issued common stock only. The company has been successful and has a gross profit rate of
20%. The information shown below was taken from the company’s financial statements.
Beginning inventory
$ 482,000
Purchases
5,636,000
Ending inventory
?
Average accounts receivable
700,000
Average common stockholders’ equity
3,500,000
Sales (all on credit)
7,000,000
Net income
525,000
Required: Compute the following:
A.
Receivables turnover and the average collection period.
B.
Inventory turnover and the days in inventory.
C.
Return on common stockholders’ equity.
= $7,000,000 ÷ $700,000
= 10 times
= 365 ÷ 10 times
= 36.5 days
Inventory turnover = Cost of goods sold ÷ Average inventory
First calculate ending inventory.
Beginning Inventory
+ Purchases
Ending Inventory
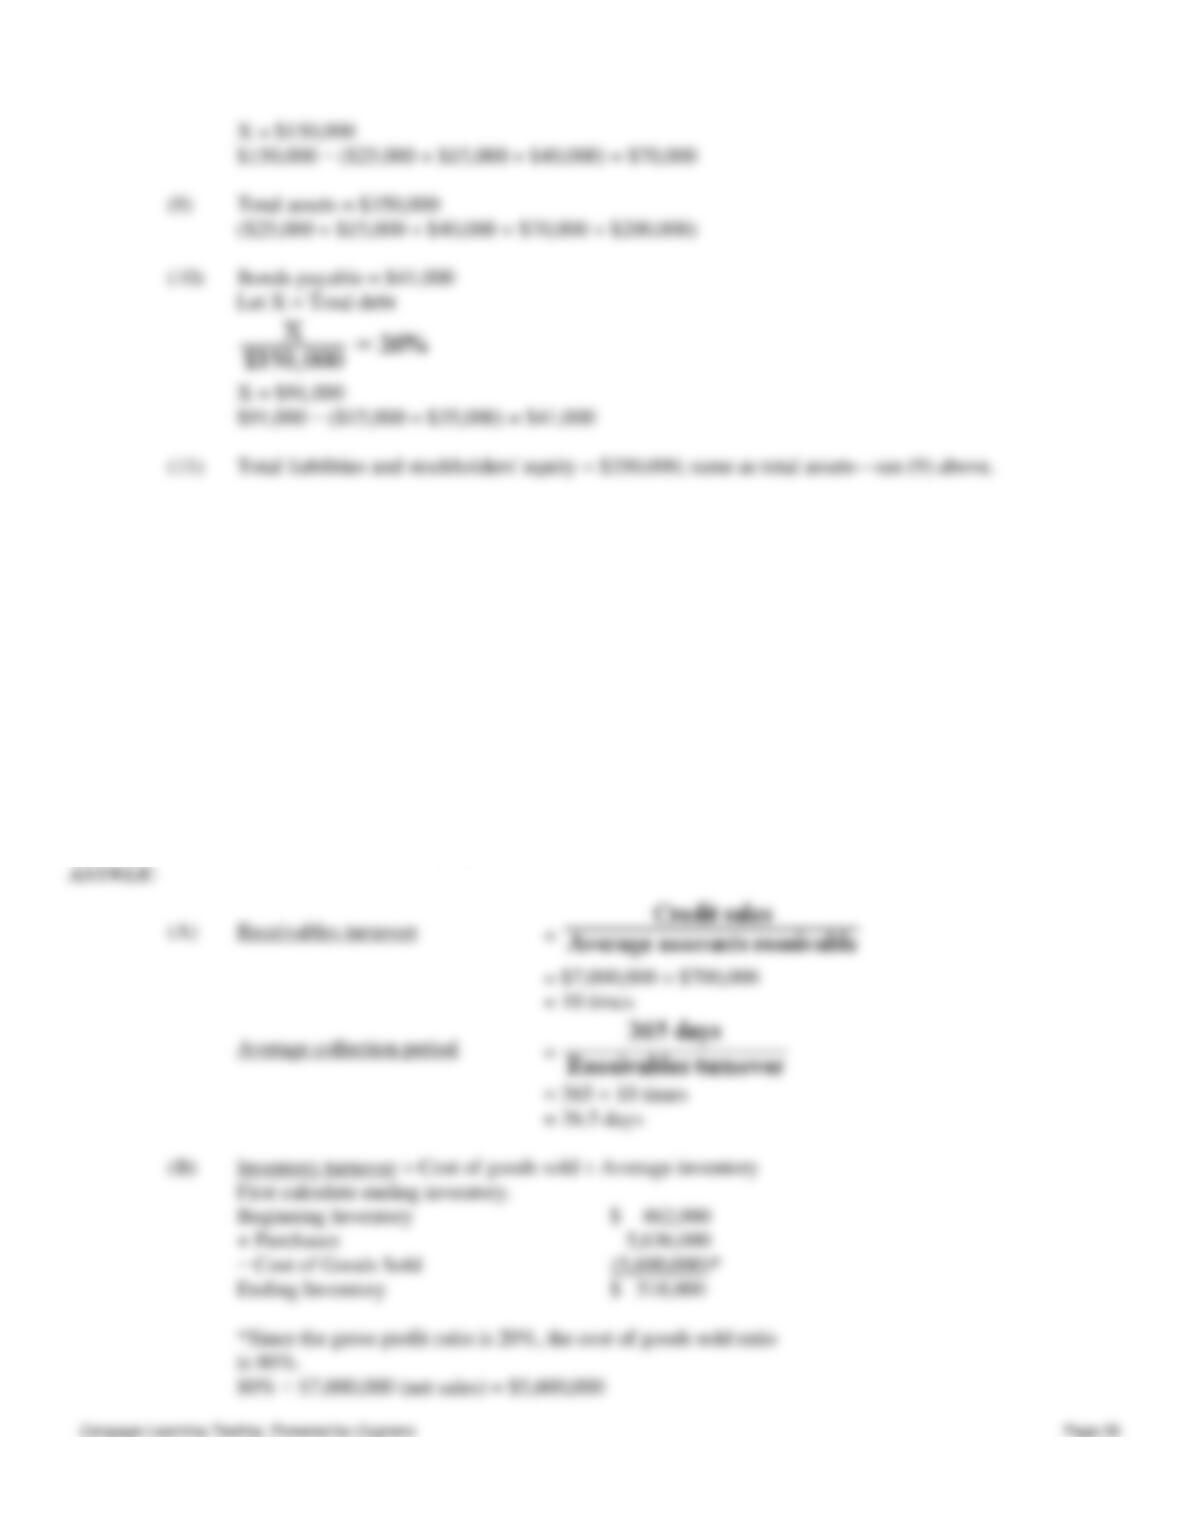
X = $150,000
$150,000 − ($25,000 + $15,000 + $40,000) = $70,000
(9)
Total assets = $350,000
($25,000 + $15,000 + $40,000 + $70,000 + $200,000)
(10)
Bonds payable = $41,000
Let X = Total debt
X = $91,000
$91,000 − ($15,000 + $35,000) = $41,000
(11)
Total liabilities and stockholders’ equity = $350,000; same as total assets—see (9) above.
Chapter 16 – Financial Statement Analysis
Ending Inventory = $518,000 (per above)
Average Inventory = ($482,000 + $518,000) ÷ 2 = $500,000
Inventory Turnover = $5,600,000 ÷ $500,000 = 11.2 times
Days in Inventory = 365 days ÷ 11.2 times = 32.6 days
$525,000 ÷ $3,500,000 = 15%
Figure 16–4.
Condensed financial statements for Black Company appear below:
Comparative Balance Sheets
20X1
20X0
Cash
$ 128,000
$ 201,000
Accounts receivable
472,000
438,000
Inventories
797,000
673,000
Prepaid expenses
81,000
92,000
Plant and equipment (net)
2,655,000
2,428,000
Total assets
$4,133,000
$3,832,000
Accounts payable
$ 198,000
$ 280,600
Long-term bonds payable
1,000,000
1,000,000
Preferred stock, 10%, $100 par
450,000
450,000
Common stock, no par
1,800,000
1,800,000
Retained earnings
685,000
301,400
Total liabilities and stockholders’ equity
$4,133,000
$3,832,000
Income Statement
December 31, 20X1
Sales, net
$5,400,000
Less cost of goods sold
3,240,000
Gross margin
2,160,000
Less operating expenses
1,010,000
Net operating income
1,150,000
Interest expense
80,000
Net income before taxes
1,070,000
Less income taxes
321,000
Net income
$ 749,000
There were 72,000 shares of common stock outstanding throughout the 20X1. Dividends on common stock amounted to
$320,400 and dividends on preferred stock amounted to $45,000. The market value of a share of common stock was $54
at the end of 20X1. The income tax rate is 30%.
160. Refer to Figure 16–4.
Required: Calculate the following liquidity ratios for 20X1.
A.
Current Ratio
B.
Quick Ratio
C.
Accounts Receivable Turnover Ratio
D.
Inventory Turnover Ratio
E.
Inventory Turnover in Days
Chapter 16 – Financial Statement Analysis
A.
Current ratio = current assets / current liabilities = $1,478,000 / $198,000 = 7.46 to 1
$128,000 + 0 + $472,000 / $198,000 = $600,000 / $198,000 = 3.03 to 1
$5,400,000 / [($472,000 + $438,000) / 2] = $5,400,000 / $455,000 = 11.87 times
[($797,000 + $673,000) / 2] = $3,240,000 / $735,000 = 4.41 times
82.77 days
161. Refer to Figure 16–4.
Required: Calculate the following leverage ratios for 20X1:
A.
times-interest-earned ratio
B.
debt ratio
C.
debt-to-equity ratio
= $1,150,000 / $80,000 = 14.38
B.
Debt ratio = Total Liabilities / Total Assets = $1,198,000 / $4,133,000 = 0.29
162. Refer to Figure 16–4.
Required: Calculate the following profitability ratios for 20X1.
A.
Return on Sales
B.
Return on Total Assets
C.
Return on Common Stockholders’ Equity
D.
Earnings per share
A.
Return on Sales = Net Income / Sales = $749,000 / $5,400,000 = 0.1387 or 13.87%
D.
Earnings per share = (Net income − Preferred Dividends) / Average common shares

Chapter 16 – Financial Statement Analysis
Figure 16-7
Kooper Co.
Income Statement
For the Year Ended December 31, 20X0
Revenues:
Net sales
$383,000
Less: Cost of goods sold
121,700
Gross margin
$261,300
Less Operating expenses:
Selling expenses
$41,500
Administrative expenses
56,500
Interest expense
12,000
Total expenses
100,000
Net income
$151,300
Kooper Co.
Balance Sheet
December 31, 20X0
Assets
Current assets:
Cash
$ 53,000
Accounts receivable
64,300
Marketable securities
10,500
Inventory
93,250
Total current assets
$221,050
Property, plant, and equipment:
Store equipment
$325,000
Less Accumulated depreciation
162,100
$162,900
Office equipment
$149,750
Less Accumulated depreciation
72,750
77,000
Total property, plant, and equipment
239,900
Total assets
$460,950
Liabilities
Current liabilities:
Accounts payable
$97,200
Salaries payable
28,700
Total current liabilities
$125,900
Long-term liabilities:
Note payable (due 20X0)
154,000
Total liabilities
$279,900
Stockholders’ Equity
Total stockholders’ equity
181,050
Total liabilities and equity
$460,950
There were 30,000 shares of common stock outstanding throughout 20X0. Dividends on common stock amounted to
outstanding = ($749,000 − $45,000) / $72,000 = $704,000 / $72,000 = $9.78
Chapter 16 – Financial Statement Analysis
$21,000 and dividends on preferred stock amounted to $30,000. The market value of a share of common stock was $36 at
the end of 20X0. The income tax rate is 40%. The accounts receivable and inventory accounts had beginning balances of
$58,500 and $101,400 respectively. Total assets at the beginning of the year were $430,500.
163. Refer to Figure 16–7.
Required: Calculate the following ratios:
A. Current ratio
B. Quick ratio
C. Accounts receivable turnover ratio and accounts receivable turnover in days
D. Inventory turnover ratio and inventory turnover in days
164. Refer to Figure 16–7.
Required: Calculate the following ratios:
A. return on sales
B. return on total assets
C. earnings per share
D. price-earnings ratio
Chapter 16 – Financial Statement Analysis
165. Refer to Figure 16–7.
Required: Calculate the following ratios:
A. Debt ratio
B. Debt-to-equity ratio
State what information each ratio is providing to the company.
166. The two major forms of common-size analysis are horizontal analysis and vertical analysis. What type of information
or insights can be obtained by using these two techniques of financial statement analysis? Explain how the output of
horizontal analysis and vertical analysis can be compared to industry averages and/or competitive companies.
You decide
167. Ratios by themselves tell little about the financial well-being of a company. For meaningful analysis, the ratios
should be compared with a standard. Describe the two standards commonly used.
168. Why is liquidity important for businesses?
Chapter 16 – Financial Statement Analysis
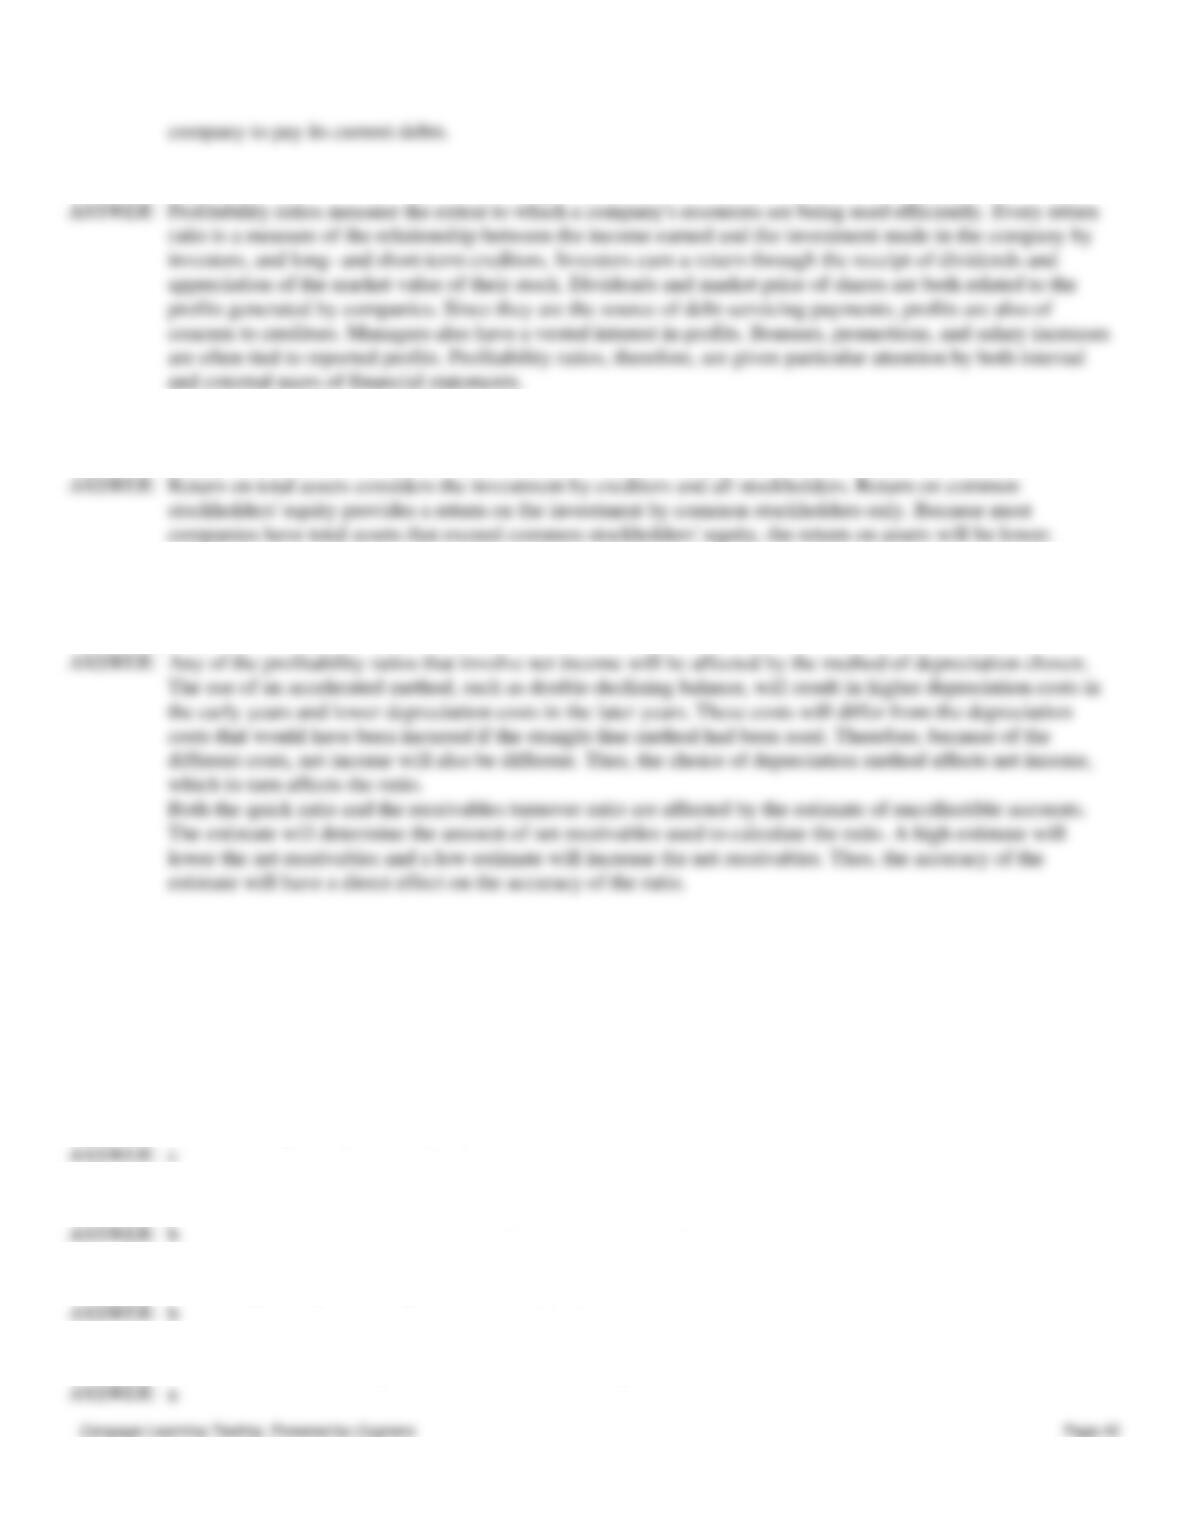
169. What do profitability ratios measure and what is their significance?
170. Carter Company has a return on total assets of 12% and a return on common stockholders’ equity of 15%. What
causes the difference in the two returns?
171. The use of estimates, cost, alternative accounting methods, the presence of atypical data, and diversification of firms
are all factors that may limit the usefulness of financial statement analysis. Identify a ratio and explain how one or more of
the limiting factors can affect the usefulness of that ratio.
Match the classifications of ratios with each description.
a.
Liquidity Ratio
b.
Leverage Ratio
c.
Profitability Ratio
d.
Horizontal Analysis
e.
Trend Analysis
172. Measures the earning ability of a company
173. Measures the ability of a company to meet long and short term obligations
174. Measures the degree of protection provided to company creditors
175. Measures the ability of the company to meet its current obligations
company to pay its current debts.

Chapter 16 – Financial Statement Analysis
176. Allows evaluation of the extent to which funds are used efficiently
c
Indicate the type of each ratio listed below.
a.
Liquidity Ratio
b.
Leverage Ratio
c.
Profitability Ratio
177. Current ratio
a
178. Debt-to-equity ratio
179. Earnings per share
c
180. Return on sales
c
181. Dividend payout ratio
c
182. Inventory turnover ratio
a
183. Times-interest-earned ratio
184. Return on total assets ratio
c
185. Debt ratio
186. Price-earnings ratio
c
Select the ratio that each statement below most properly satisfies.
a.
Dividend yield ratio
b.
Current ratio
c.
Debt ratio
d.
Return on common stockholders’ equity ratio
e.
Times-interest-earned ratio
f.
Quick ratio
g.
Debt-to-equity ratio
h.
Dividend payout ratio

Chapter 16 – Financial Statement Analysis
i.
Price-earnings ratio
187. A measure of the company’s ability to pay its short-term liabilities out of short-term assets
188. A measure that compares only the most liquid assets to current liabilities
189. An income statement measure of the ability of a company to service its debts
190. A measure of the degree of protection afforded creditors in case of insolvency
191. A ratio that indicates what proportion of equity and debt the company is using to finance its assets.
192. A measure of the company’s success in earning a return for the common stockholders
193. The relationship between dividends and the market price of a company’s stock
194. A measure viewed by many investors as an important indicator of stock values. It is found by dividing the market
price per share by the earnings per share
195. A measure that tells an investor the proportion of earnings that a company pays in dividends