OM5 C16
Test Bank
20. An R-chart is always analyzed first because the control limits in the R-chart depend on the
mean of the data.
21. As long as there are no points outside of the control limits in a control chart, the process would
always be considered to be in control.
22. A c-chart is used to monitor the proportion of nonconforming units, whereas a p-chart is used to
monitor the number of nonconformances per unit.
23. It is not necessary to have a process in control when establishing control limits.
24. Both the p-chart and c-chart use continuous data.
25. Larger sample sizes allow smaller changes in process characteristics to be detected with higher
probability.
26. The lower the rate of defects, the higher the sample size should be in p-charts.
27. If process quality approaches six sigma levels, then standard types of control charts are not
useful.
28. To account for the process centering, two-sided capability index is often used.
29. Process capability quantifies the variation that results from common causes.
OM5 C16
Test Bank
30. When the range of process variation does not conform to the design specifications, the process
capability index will be less than 1.
31. The value of Cpk is the average of the lower and upper capability indexes; that is, Cpk = (Cpl +
Cpu)/2.
Case Study Questions (To reward students who attend class, listen and learn, and take good class
notes on the case discussion and/or student team presentation.)
1. Which one of the following statements about the Casey Company case study on quality
management is TRUE?
a. The first step in this case analysis was to create a process flowchart and checksheet.
b. Control charts verify that all aspects of the process are in statistical process control.
c. Control charts verify that the data entry employee was doing an excellent job.
d. The R-chart for this statistical process control analysis was out of control.
Problems for Manual Grading, Take-Home Exams and Partial Credit (Also, review the OM
Instructor’s Manual for end-of-chapter questions/problems)
1. Define and give an example of the three components of any control system.
ANS:
2. Explain and give the significance of the 1:10:100 Rule.
3. Define quality at the source.
4. Discuss the three basic quality control practices used in manufacturing.
5. Define statistical process control (SPC), and differentiate between common cause and special (or
assignable) cause variation.
OM5 C16
Test Bank
6. Alico Steel manufactures steel tubes that are used in gas grills for residential customers. The
tube’s overall length is crucial to assure a proper fit, and this dimension has been targeted as an
important dimension to be stabilized for the steel tube manufacturing process. Gas grill
performance and customer safety are key objectives and highlight the importance of producing
high quality steel tubes. Tubes are cut from rolls of steel tubing using a punch press. The tubes are
measured using an operationally defined method, and Table 1 below summarizes the results.
Appendix B with all factors for control charts will be given as a separate class handout.
Table 1 Tube Length (in centimeters)
Sample Observations 1 to 6
Number Average x-bar Average range (R)
1 12.90 0.35
2 13.30 0.50
3 12.87 0.32
4 10.93 0.44
5 11.43 0.91
6 11.93 0.42
7 12.90 0.29
8 13.03 0.58
9 13.70 0.21
10 13.70 0.11
Total 126.69 4.13
(a) The center line for the trial R-chart is _____.
The center line for the trial X-chart is _____.
The trial UCL for the R-chart is _____.
The trial LCL for the R-chart is _____.
OM5 C16
Test Bank
(b) Assuming that special causes for out-of-control situations in (a) are investigated and
corrected using the seven tools of quality management, find the “final set of revised control
limits” (i.e., take out any special cause sample(s) from your trial charts and recompute the
following). (6 points)
The center line for the final revised R-chart is _____. (1 point each)
The center line for the final revised X-chart is _____.
The final revised UCL for the R-chart is _____.
The final revised LCL for the R-chart is _____.
The final revised UCL for the x-bar chart is _____.
The final revised LCL for the x-bar chart is _____.
(c)Plot the X-chart below and make sure you label the chart correctly. (8 points)
OM5 C16
Test Bank
(d) Is the process in statistical process control (SPC)? Justify and explain using facts. What action
would you take given your “management by fact” data analysis? (6 points)
_______________________________________________________________________
_______________________________________________________________________
_______________________________________________________________________
_______________________________________________________________________
_______________________________________________________________________
_______________________________________________________________________
_______________________________________________________________________
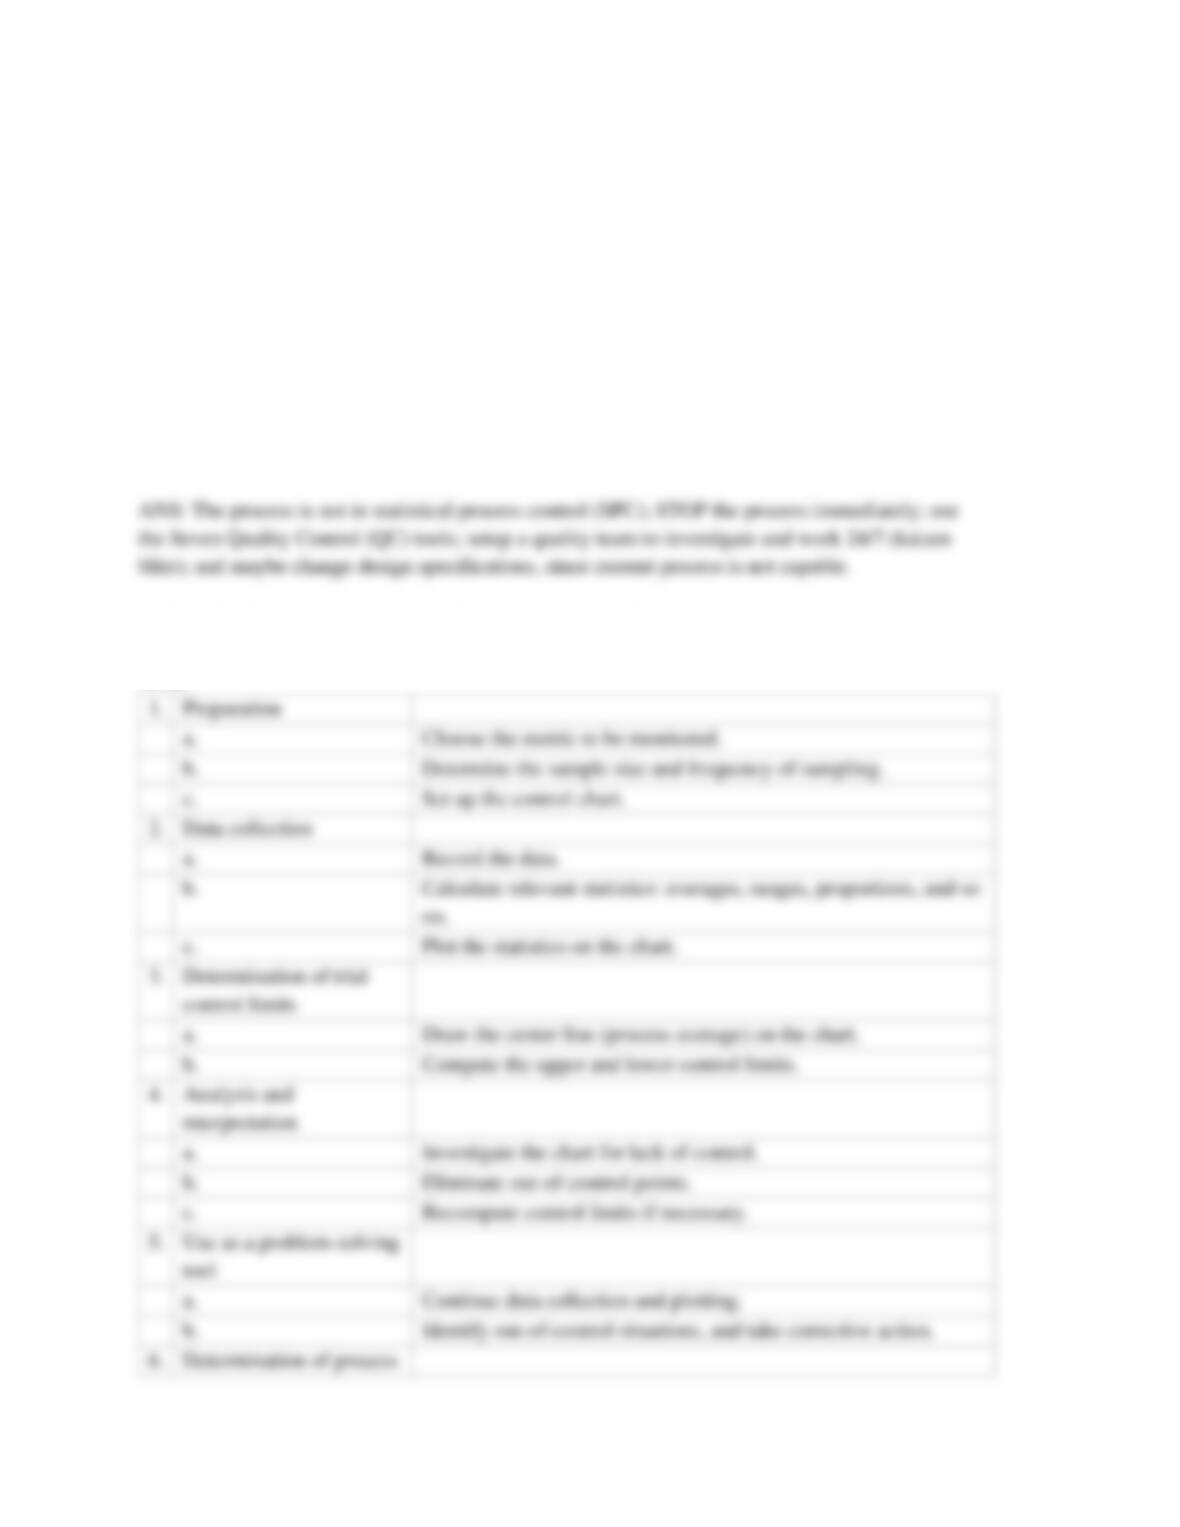
7. Describe the steps required to develop and use control charts.
ANS:
OM5 C16
Test Bank
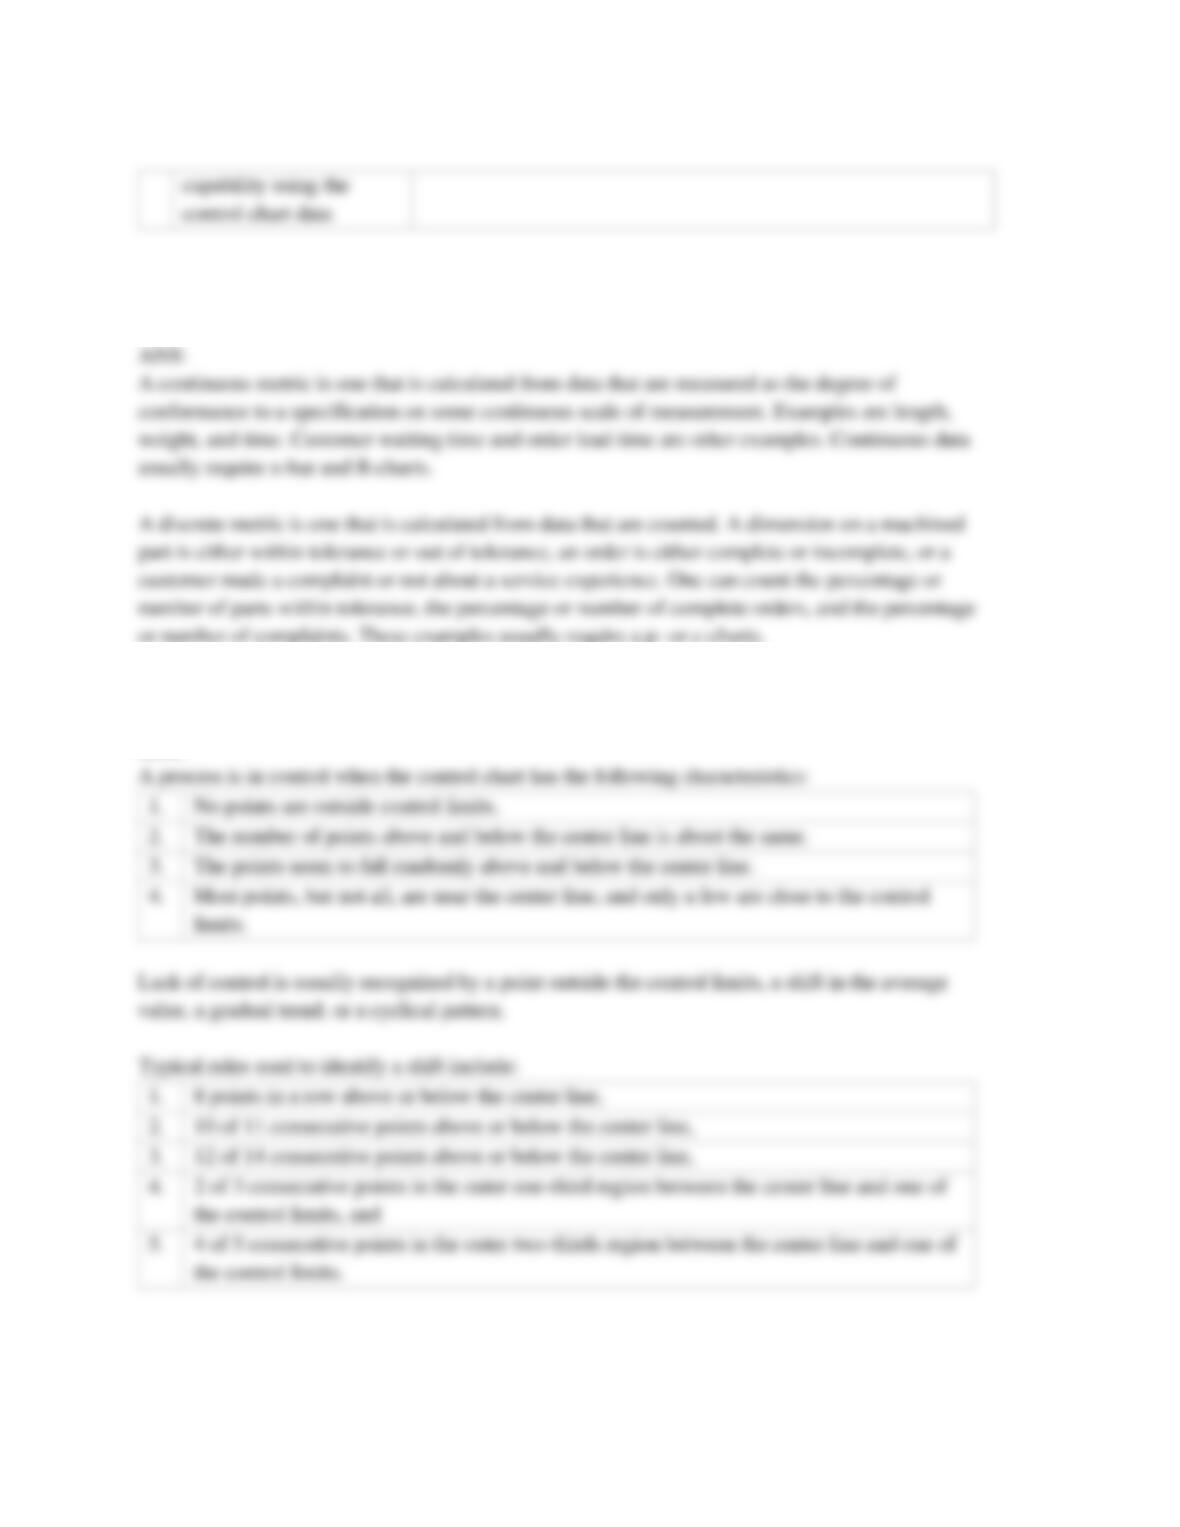
8. Discuss the difference between a continuous metric and a discrete metric, give examples of each,
and list the common control charts associated with each.
9. In general, discuss how to interpret control charts.
ANS:
10. A production process is sampled 24 times with a sample size of 6 yields, an overall mean of
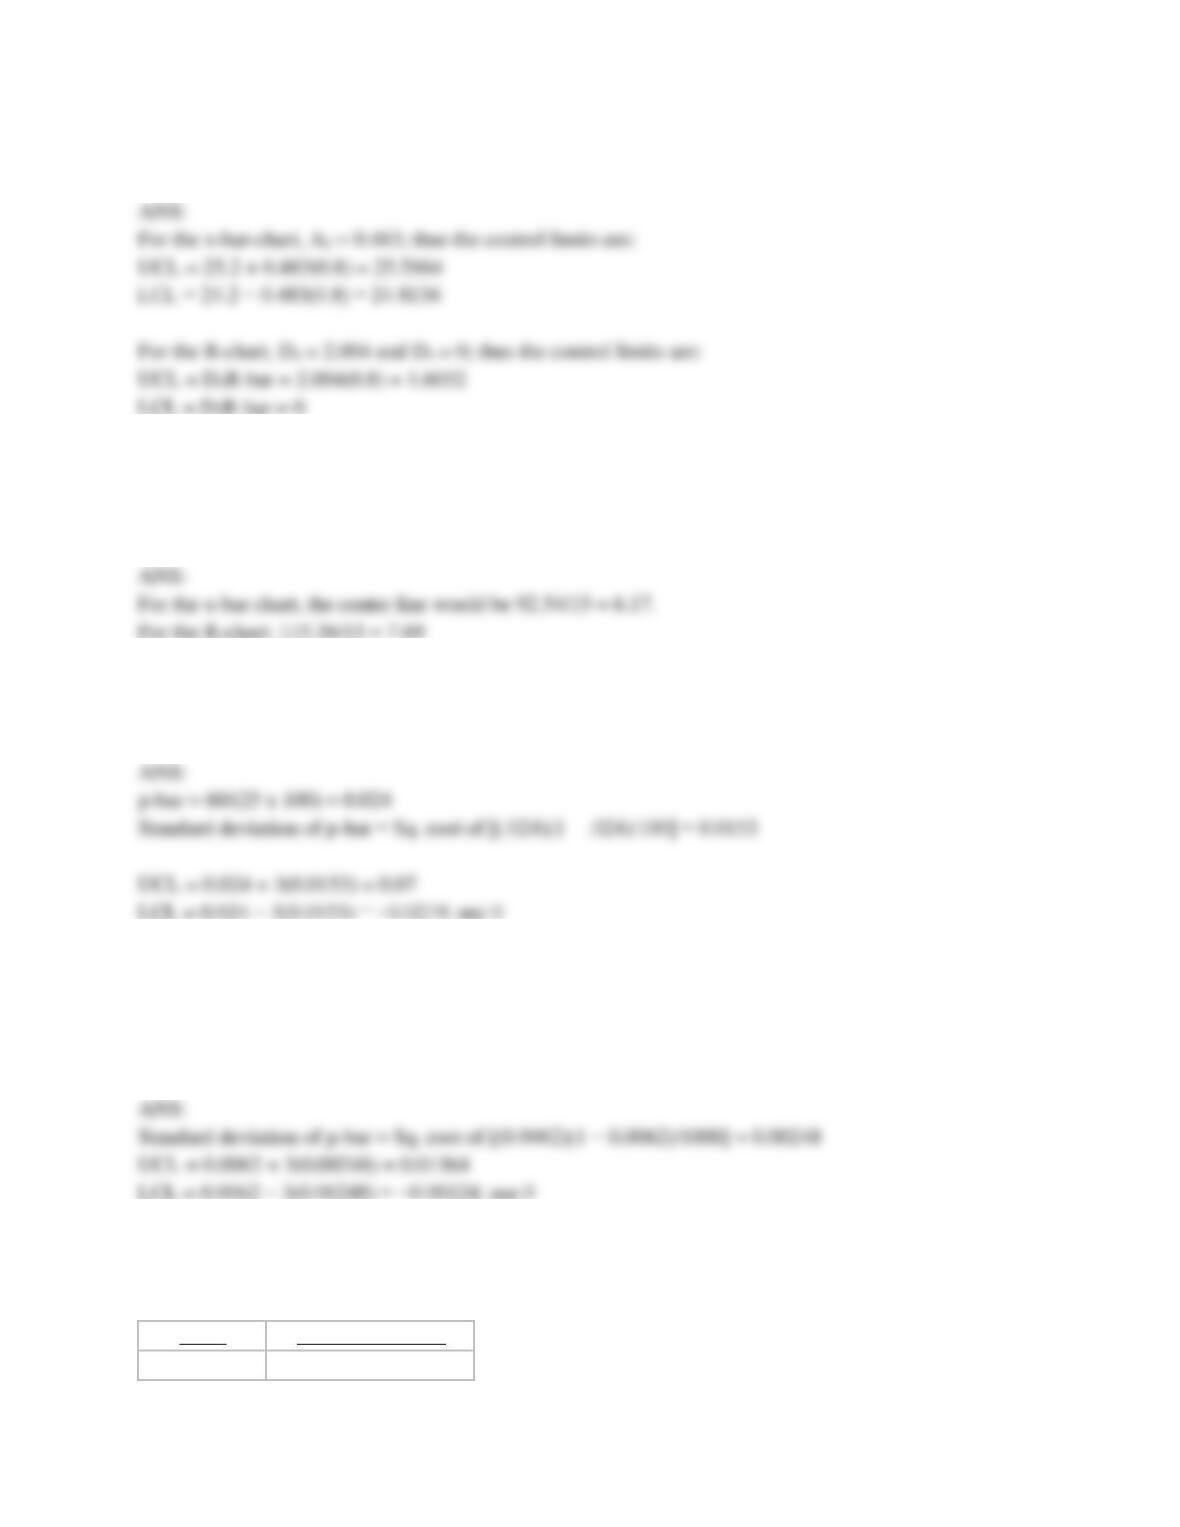
25.2, and an average range of 0.8. Determine the control limits for the x-bar and R-charts.
OM5 C16
Test Bank
11. Fifteen samples of size 5 have been taken from a production process. The sum of the sample
averages was found to be 92.54 cm, while the sum of the ranges was 115.36. Find the values of the
center lines for the x-bar and R-charts.
12. Over several days, 25 samples of 100 items each were tested for electrical resistance. A total of
60 items failed. Determine the control limits for a p-chart.
13. An airline found that on average, 0.62 percent of the luggage they received from passengers at
LAX (Los Angeles Airport) is lost or damaged. On a typical day, 1000 pieces of luggage pass
through this airport. What are the control limits for a p-chart for monitoring the daily fraction
nonconforming?
14. Flaws are counted on a standard steel plate (sheet). Each sheet has the exact same dimensions.
Ten sheets are selected at random and the number of flaws per sheet is as follows:
Sheet
Number of Flaws
1
3
OM5 C16
Test Bank
2
1
3
3
4
0
5
2
6
2
7
0
8
1
9
1
10
2
Determine the lower and upper control limits for a c-chart.
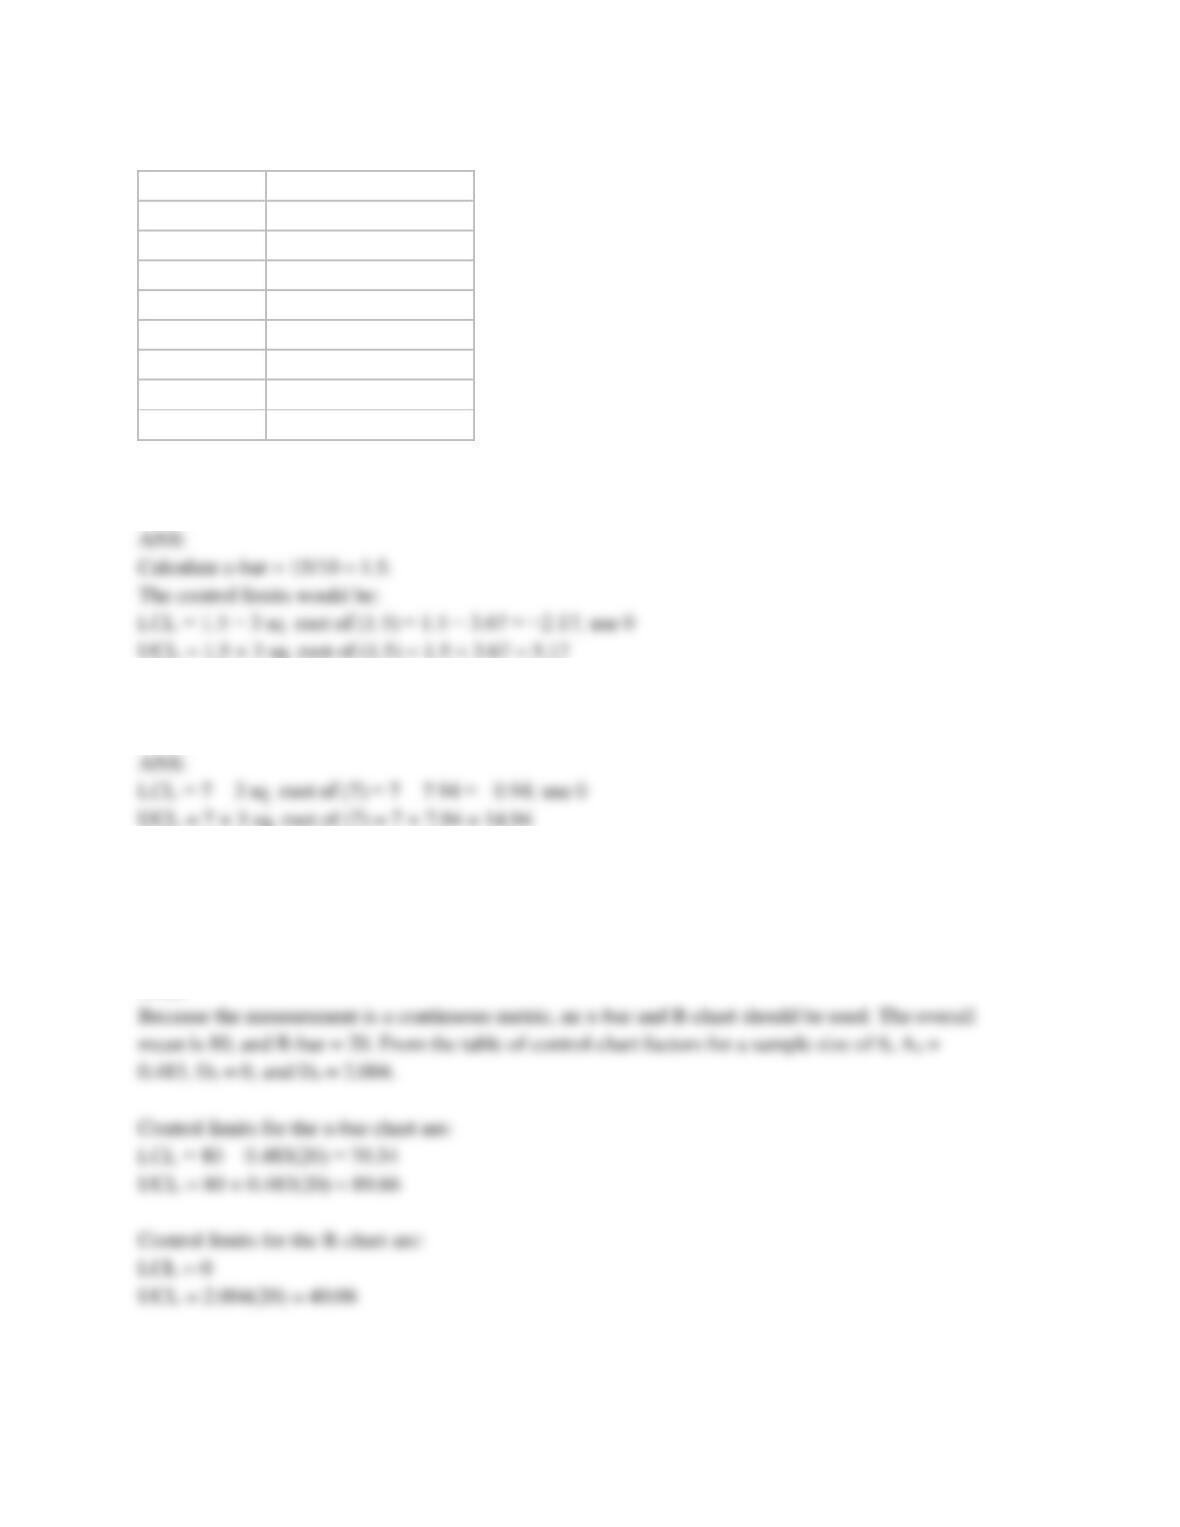
15. Find the control limits for a c-chart with c-bar= 7.
16. A company is measuring the time it takes to complete an order. Twenty-five samples of size 6
resulted in an average time of 80 minutes with an average range of 20 minutes. Find control limits
for the appropriate control chart(s) that would be used to monitor this process.
ANS:
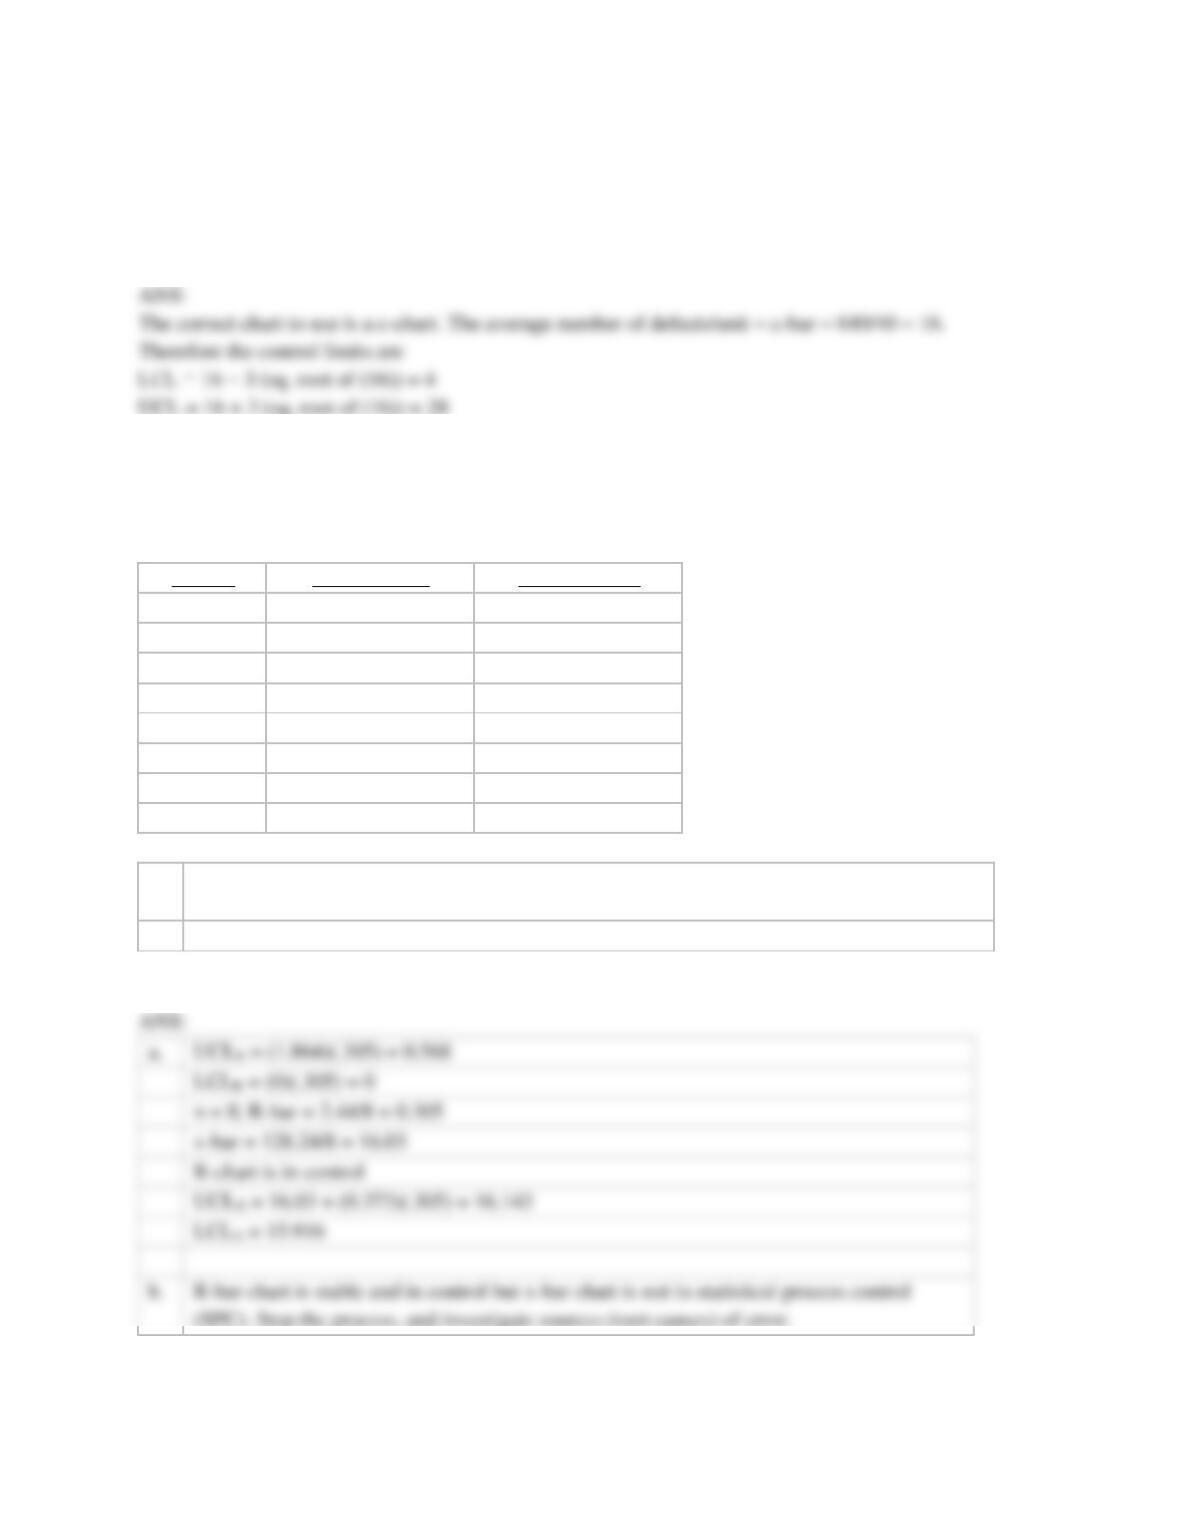
17. A manufacturer inspected 40 circuit boards and found a total of 640 defects. If the company
OM5 C16
Test Bank
wants to use statistical process control (SPC) to control the manufacturing process by monitoring
the number of defects per circuit board, what type of chart should they use and what should be the
control limits?
18. A Proctor and Gamble factory process fills boxes with detergent. Construct an appropriate set
of control charts to monitor the process. Historical data for fill weight (in ounces) of eight samples
is presented below. A sample size of eight was used.
Sample
Sample Mean
Sample Range
1
15.80
0.42
2
16.10
0.38
3
16.02
0.08
4
15.95
0.15
5
16.12
0.42
6
16.18
0.23
7
15.87
0.36
8
16.20
0.40
a.
Compute the limits for both an R-chart and x-bar chart. Compare the sample results to the
limits of the charts.
b.
Briefly explain what the quality control charts tell you. What actions, if any, would you take?
n = 8; R-bar = 2.44/8 = 0.305
x-bar = 128.24/8 = 16.03
R-chart is in control
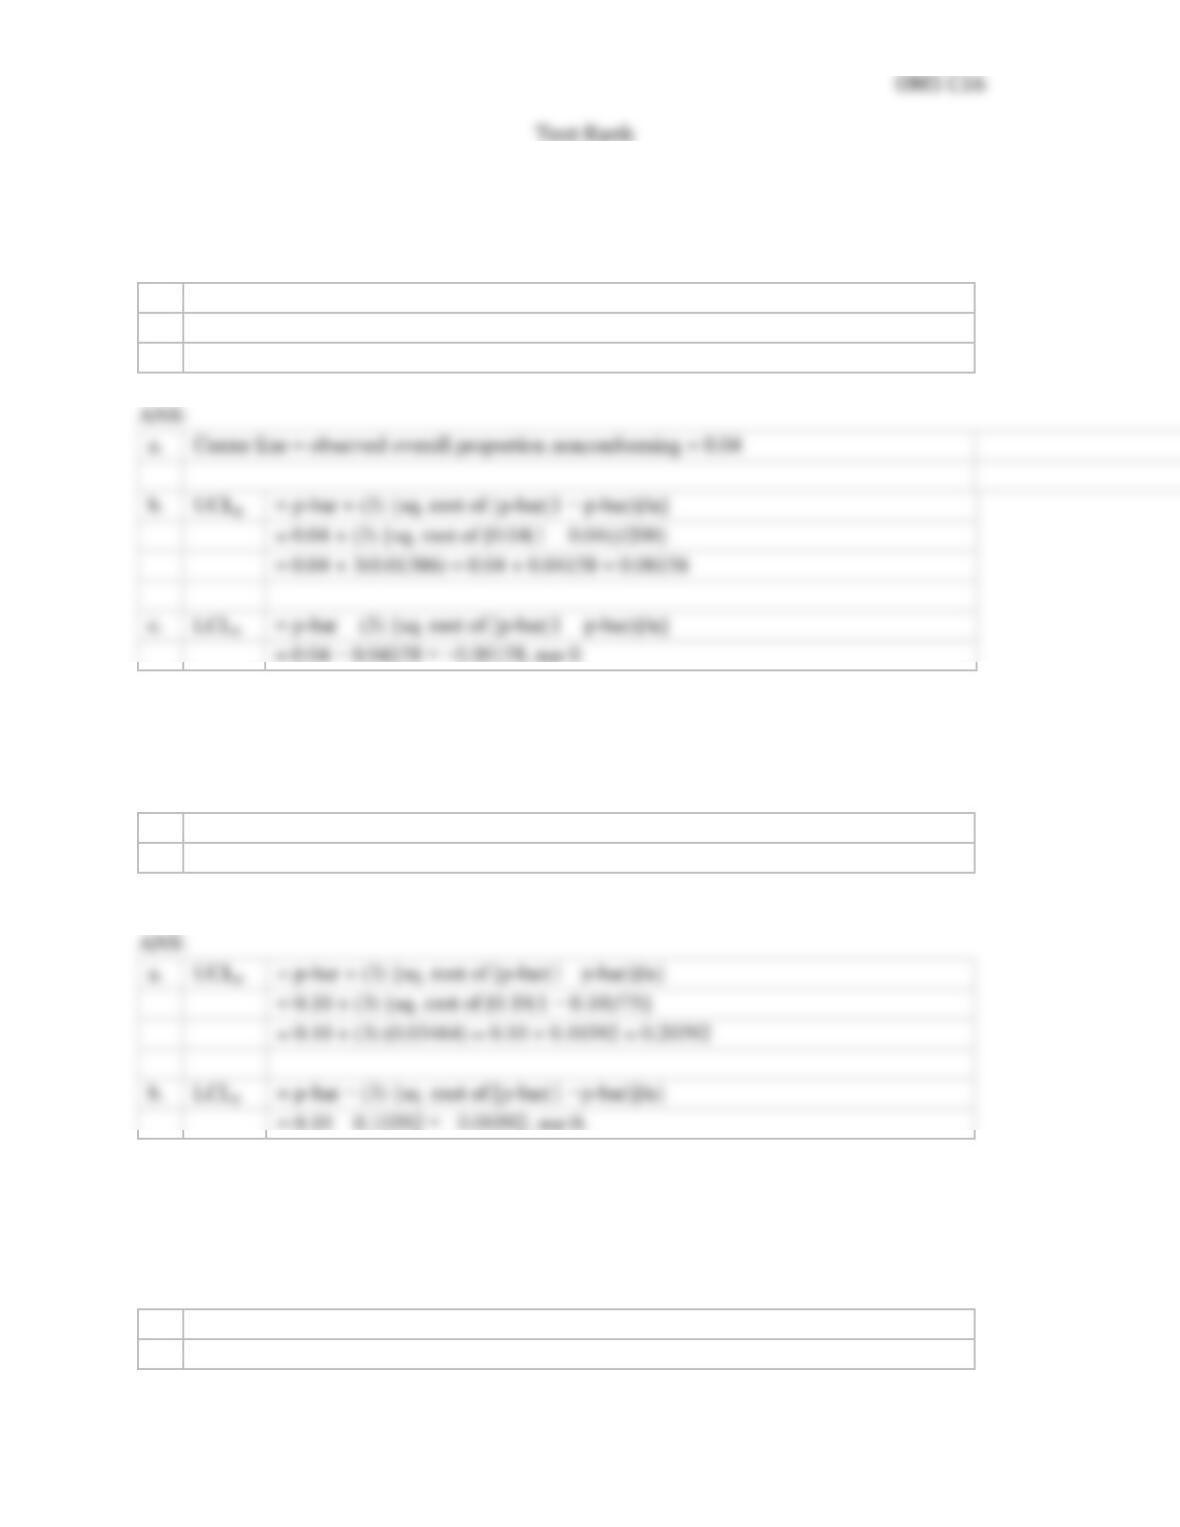
19. A manufacturing company has a production process that has a target percentage of
nonconformance as 4 percent which was developed based on numerous samples of 200
observations each. They want to develop control charts using 3 standard deviation limits.
a.
What is the center line for the p-chart?
b.
What is the upper control limit for a p-chart?
c.
What is the lower control limit for a p-chart?
a.
Center line = observed overall proportion nonconforming = 0.04
b.
= p-bar + (3) {sq. root of [p-bar(1 − p–bar)]/n}
c.
= p-bar − (3) {sq. root of [p–bar(1 − p–bar)]/n}
20. An operator has determined the percentage of defectives for a machine which she operates.
Based on several samples of 75 observations, she found the p-bar to be 10 percent. She wants to set
up a control chart using 3 standard deviation control limits.
a.
What is the upper control limit for a p-chart?
b.
What is the lower control limit for a p-chart?
a.
= p-bar + (3) {sq. root of [p-bar(1 −p–bar)]/n}
b.
= p-bar − (3) {sq. root of [p–bar(1 −p–bar)]/n}
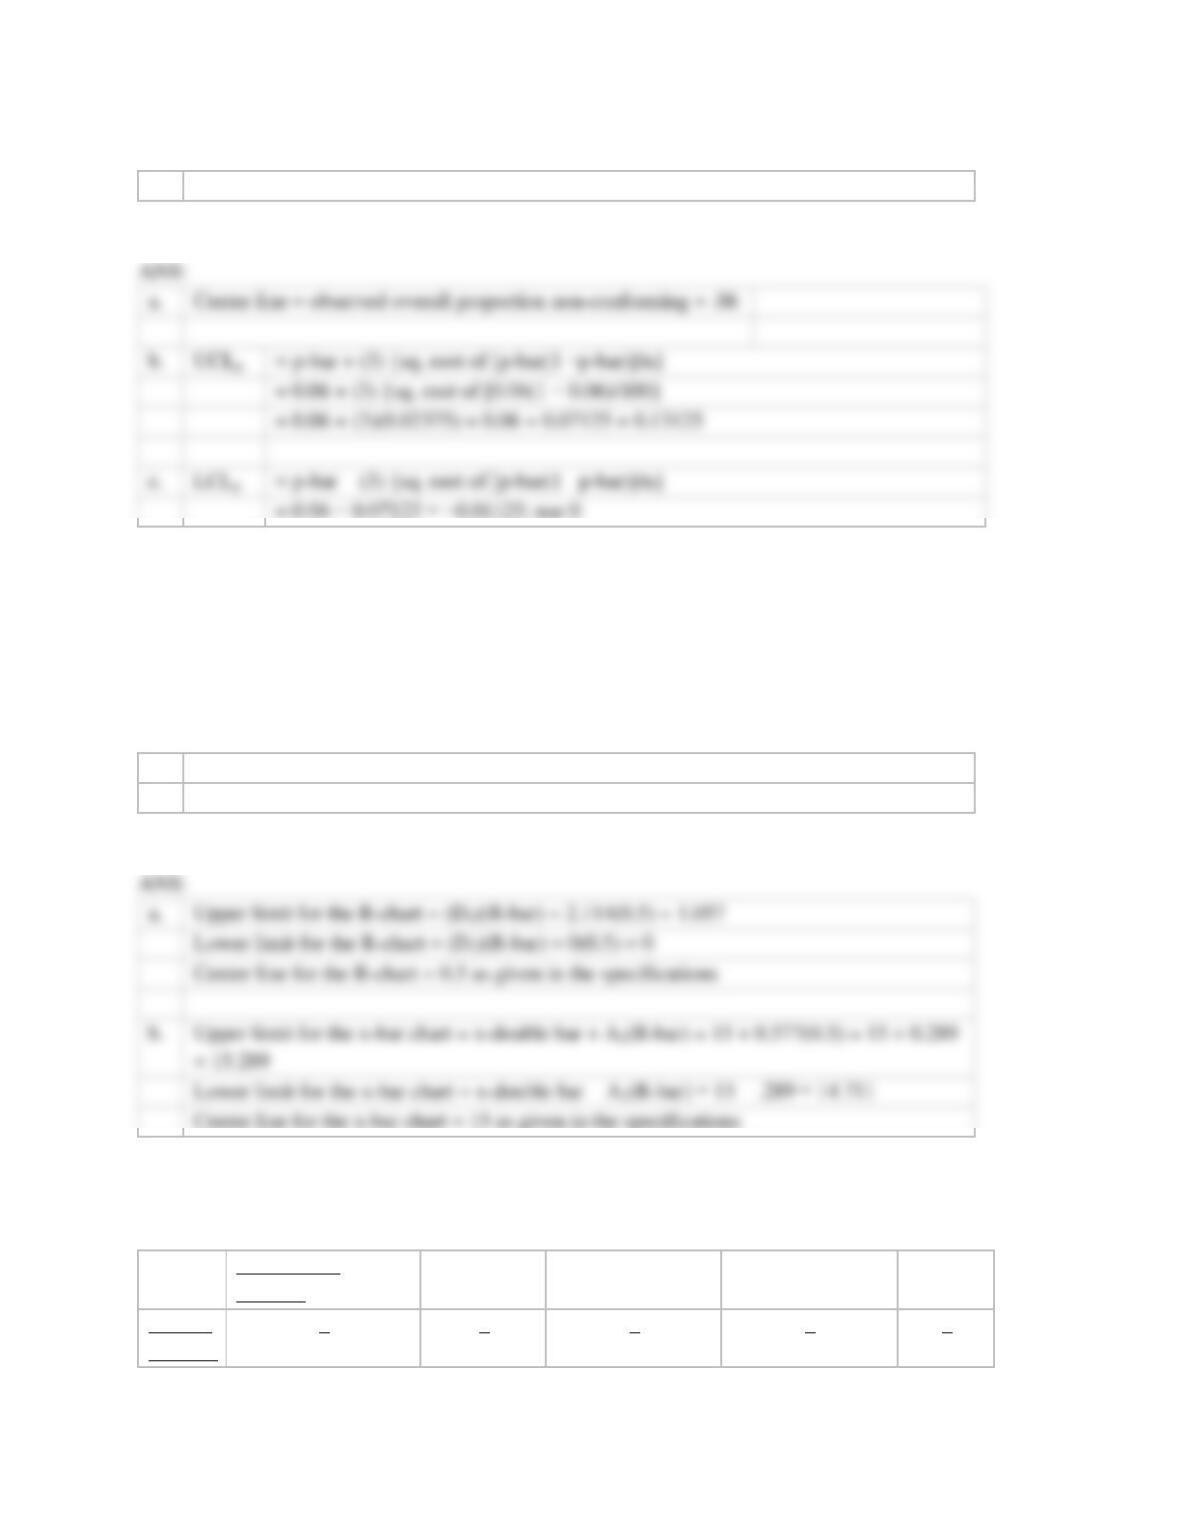
21. A high-paced discount store in Los Angeles notices that checking errors have increased
recently. They plan to use control charts with three standard deviation control limits to monitor the
process. They decide to take a sample of 100 transactions over 10 days. The number of transactions
with errors for each day was 5, 7, 6, 5, 6, 4, 6, 3, 10, and 8.
a.
What is the center line for the p-chart?
b.
What is the upper control limit for the p-chart?
OM5 C16
Test Bank
c.
What is the lower control limit for the p-chart?
22. Jim is a quality control manager at a clothing manufacturing company. He studies a quality
problem where zippers are purchased from an outside supplier. He discovers that they are poorly
constructed. When the zipper is manufactured correctly, it should have a mean length of 15 inches
and a range of 0.5 inches. Jamie proposes that 25 samples of five observations each should be
collected on a daily basis. He plans to prepare control charts to monitor the progress of the
supplier’s quality performance on the zippers.
a.
What are the upper and lower control limits and center line for an R-chart?
b.
What are the upper and lower control limits and center line for an x-bar chart?
a.
Upper limit for the R-chart = (D4)(R–bar) = 2.114(0.5) = 1.057
Lower limit for the R-chart = (D3)(R–bar) = 0(0.5) = 0
Center line for the R-chart = 0.5 as given in the specifications
Lower limit for the x-bar chart = x-double bar − A2(R–bar) = 15 − .289 = 14.711
23. Five samples are taken, with five observations each. The sample findings are listed below. The
sample values represent service times in minutes.
Observation
Number
Sample
Number
1
2
3
4
5
a.
Center line = observed overall proportion non-conforming = .06
b.
= p-bar + (3) {sq. root of [p-bar(1 −p–bar)]/n}
c.
= p-bar − (3) {sq. root of [p-bar(1 −p-bar)]/n}
OM5 C16
1
10.1
10.6
9.8
9.9
10.9
2
9.7
9.5
10.3
9.9
10.5
3
10.1
10.7
9.2
10.0
10.1
4
9.9
9.8
10.5
10.4
10.1
5
10.4
10.1
10.9
9.9
10.3
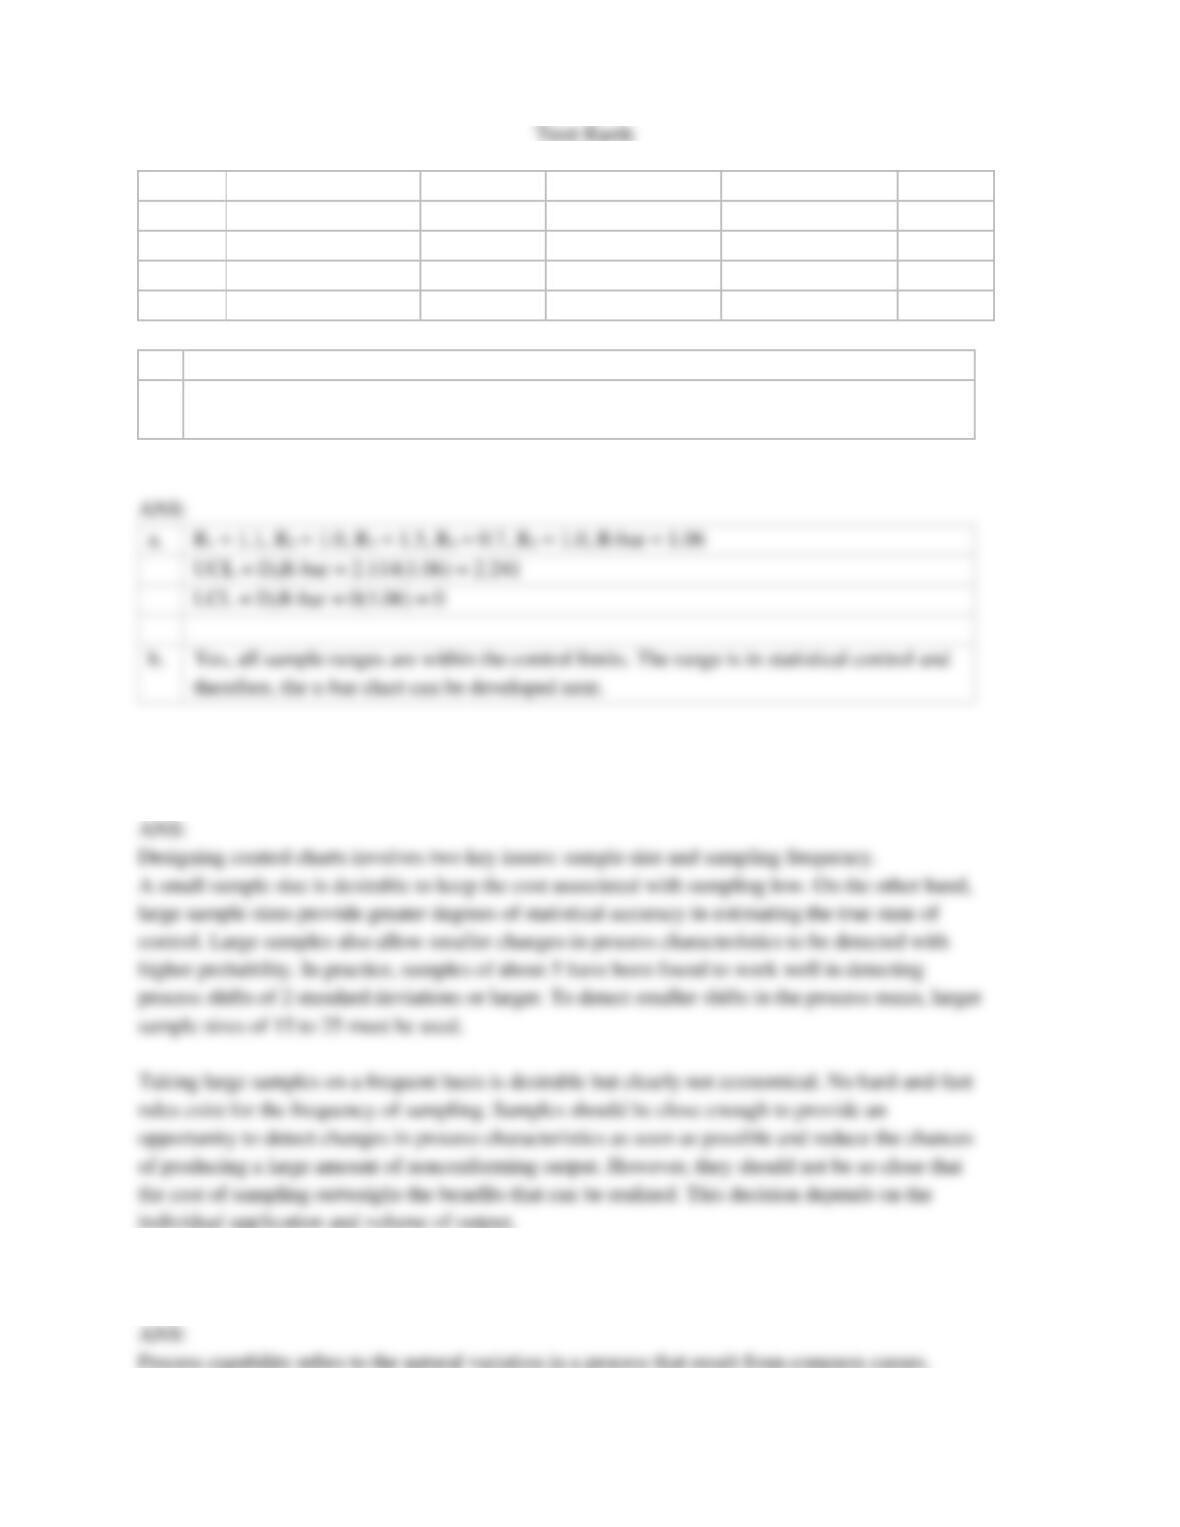
a.
Determine the control limits for the R-chart.
b.
Can it be concluded that the R-chart is in statistical control and proceed to develop the x–
bar chart?
UCL = D4R-bar = 2.114(1.06) = 2.241
24. Explain the issues associated with selecting the appropriate sample size and sampling frequency
for control charts.
25. What is the purpose of a process capability study and what is a process capability index?
OM5 C16
Test Bank
A process capability study is a carefully planned study designed to yield specific information about
the performance of a process under specified operating conditions. Typical questions asked in a
process capability study are:
1.
Where is the process centered?
2.
How much variability exists in the process?
3.
Is the performance relative to specifications acceptable?
4.
What proportion of output will be expected to meet specifications?
The process capability index Cp is defined as the ratio of the specification width to the natural
variation of the process. Cp = (USL − LSL)/6σ
where,
USL = upper specification limit
LSL = lower specification limit
σ = standard deviation of the process (or an estimate based on the sample standard deviation, s)
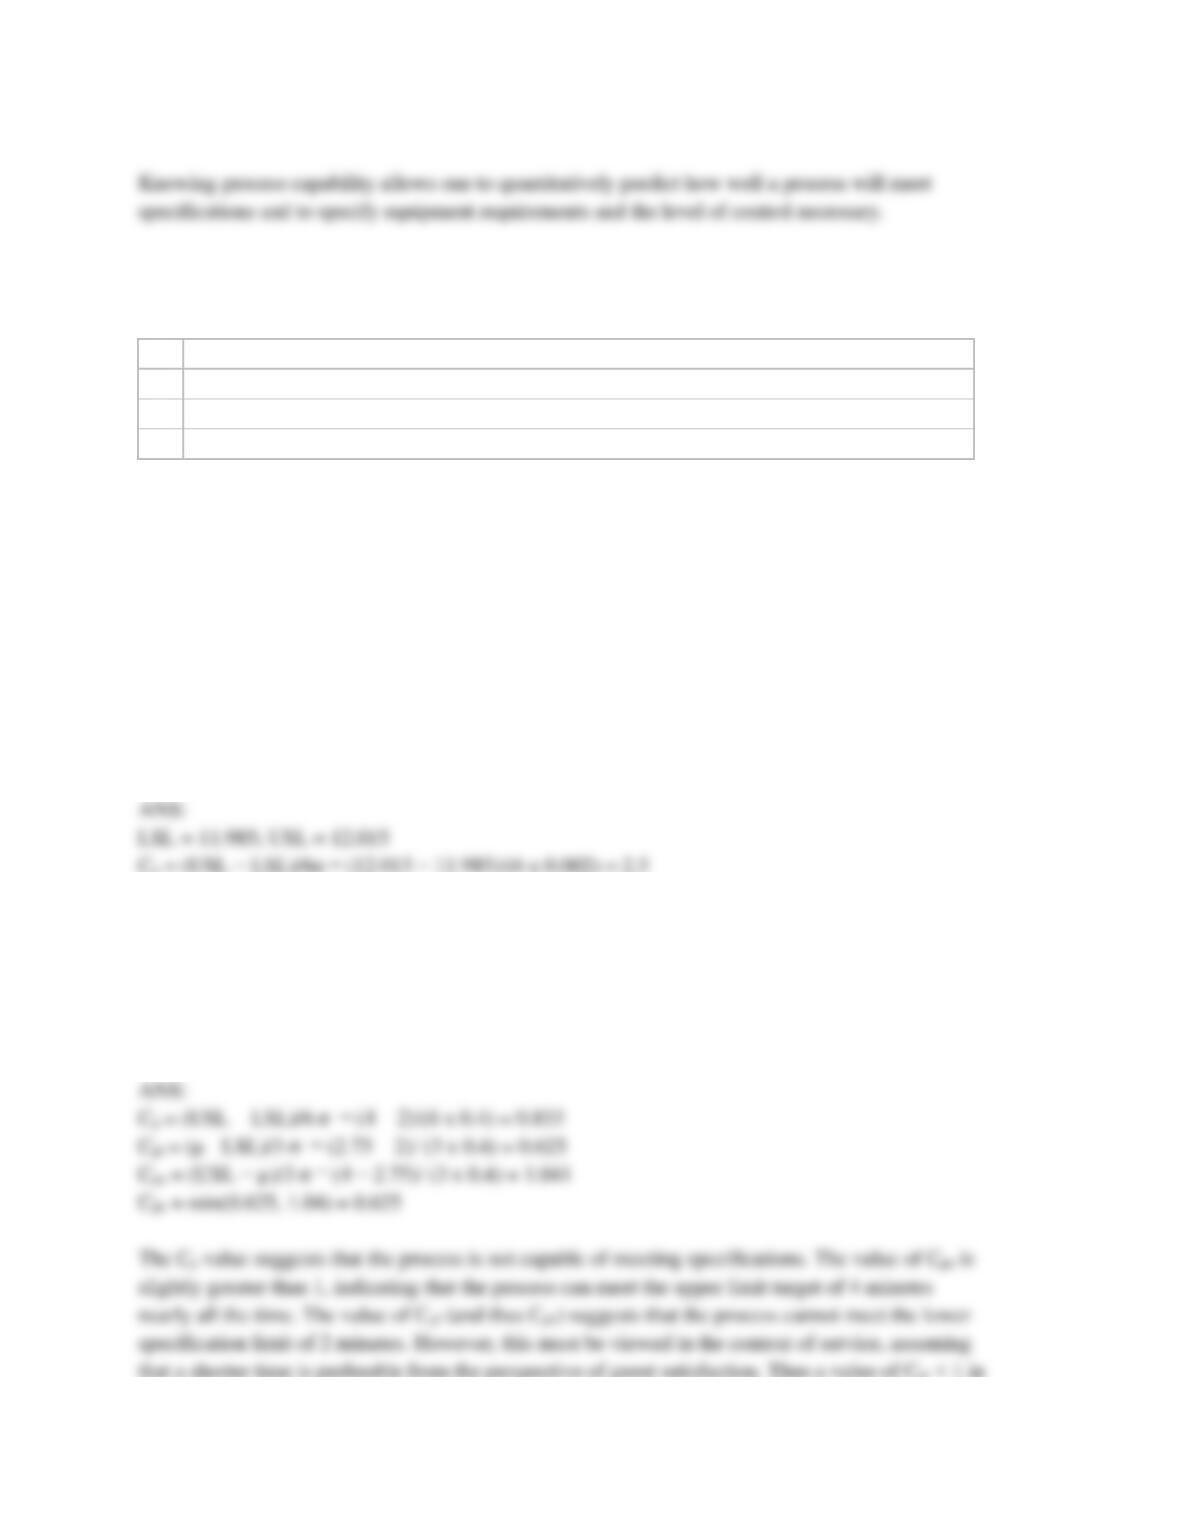
26. A bottling machine fills soft drink bottles with an average of 12.000 ounces with a standard
deviation of 0.002 ounces. Determine the process capability index, Cp, if the design specification
for the fill weight of the bottles is 12.000 ounces plus or minus 0.015 ounces.
27. The time to check out guests at a hotel was measured over the course of several weeks.
Management believes that the target time for checking out guests should be between 2 and 4
minutes with a target of 3 minutes. The data gathered had a mean time of 2.75 minutes with a
standard deviation of 0.4 minutes. Find and interpret Cp, Cpl, Cpu, and Cpk in the context of this
situation.
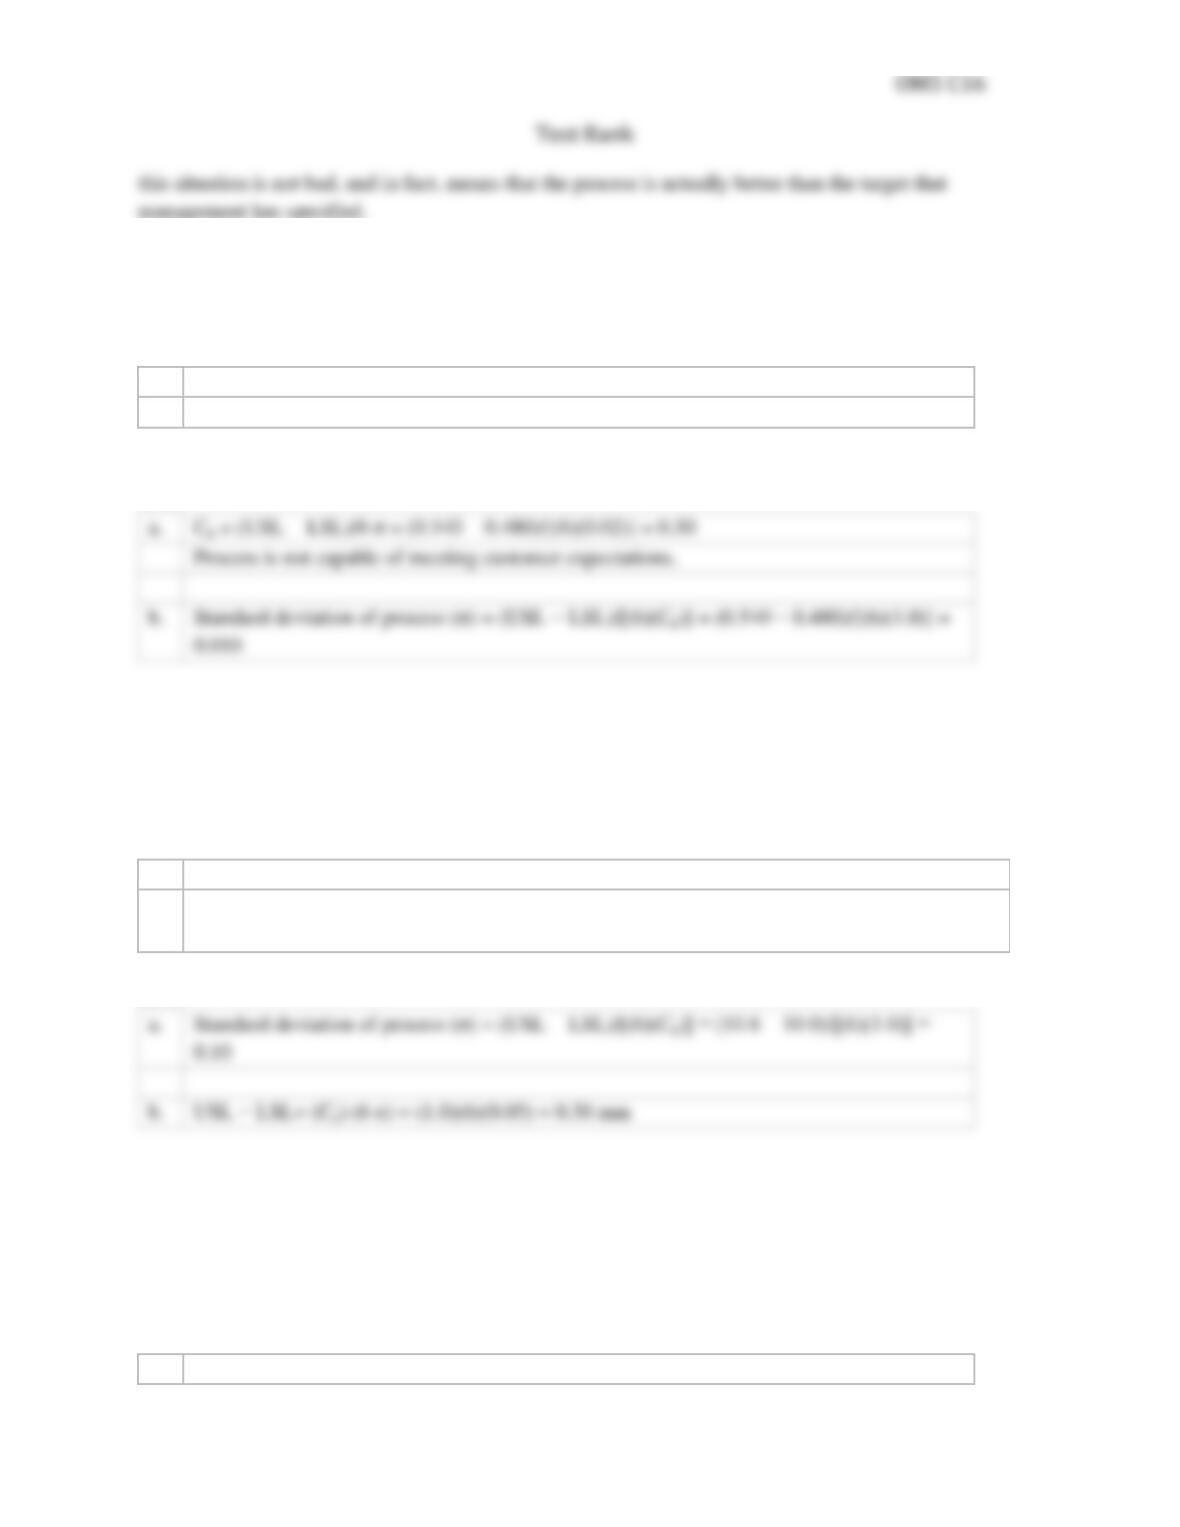
28. A steel company is interested in determining if a particular process in its mini-mill is capable of
meeting customer expectations. The thickness of steel has an upper limit of 0.540 mm and a lower
limit of 0.480 mm. The process has a standard deviation of 0.02 mm.
a.
What is the process capability index (Cp) for this process?
b.
What must the standard deviation of the process be changed to for the Cp to equal 1.00?
ANS:
Process is not capable of meeting customer expectations.
29. A company that manufactures arrows for sale in archery stores is developing a new arrow with
enhanced flight characteristics. From customer surveys, the company has determined that the
diameter of the arrow should be between 10.0 and 10.6 mm. They want to ensure the process they
develop to produce the arrows will meet customer expectations; that is, the process capability index
(Cp) will be greater than or equal to 1.00.
a.
What value of the standard deviation of the process will yield a Cp equal to 1.00?
b.
If the standard deviation of the process is actually 0.05, what would the diameter variation
(USL − LSL) of the arrow have to be to get a Cp of 1.00?
ANS:
b.
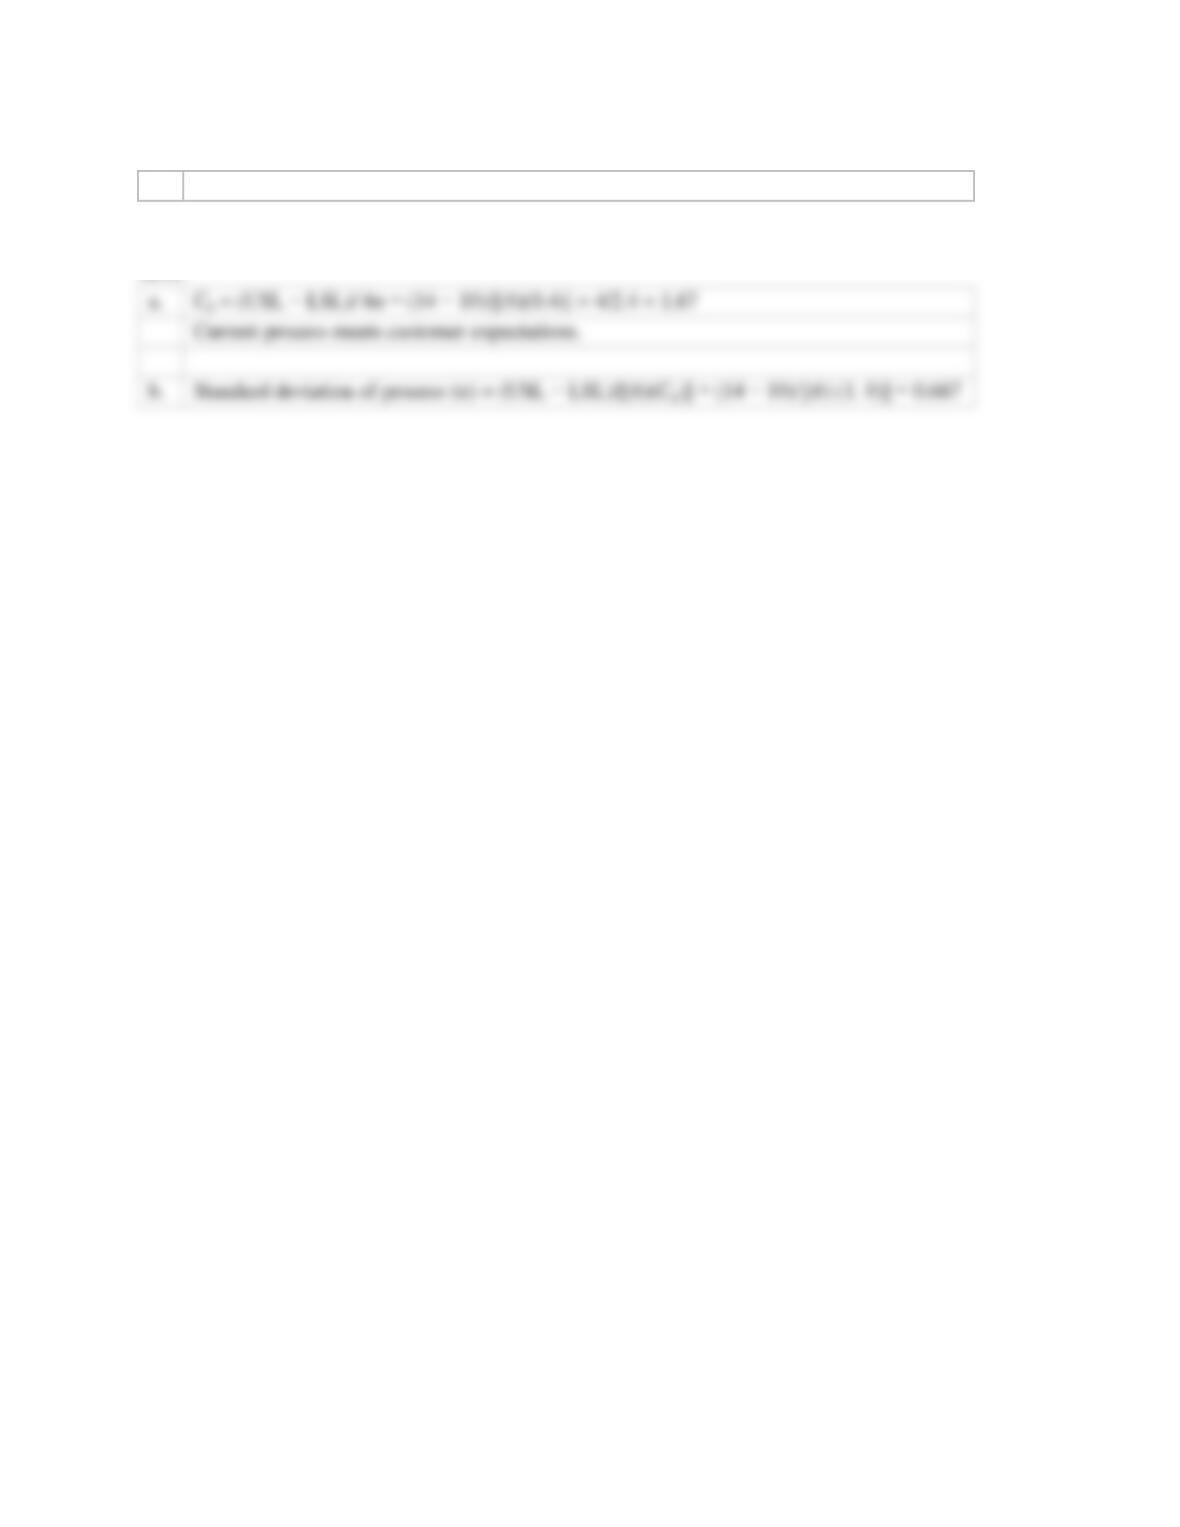
30. A company that makes handheld computers is trying to improve one of its poorer selling
products. They conducted some customer surveys and found that customers prefer the product to
weigh between 10 and 14 ounces. At present, the mean of the process is 12 ounces and the standard
deviation of the process is 0.4 ounces. They want to ensure that the production process will meet
customer expectations; that is, the process capability index (Cp) will be greater than or equal to
1.00.
a.
What is the Cp of the current production process?
OM5 C16
Test Bank
b.
What does the standard deviation of the process have to be for the Cp to equal 1.00?
ANS:
Current process meets customer expectations.
b.