Chapter 16—One-way Analysis of Variance
MULTIPLE CHOICE QUESTIONS
16.1+ The analysis of variance differs from a t test for two independent samples because
16.2 The major difference between t tests and the analysis of variance is that the latter
16.3 In the Eysenck study of recall of lists of words, a significant F in the analysis of
variance would at the least tell us that
16.4 In the analysis of variance with three groups the null hypothesis is
16.5 Which of the following is not a critical element of the analysis of variance?
16.6 If we want to have faith in the results of our particular study, we will be most
concerned with
Chapter 16
343
16.7+ If we had the following pattern of population means (1 = 2 = 3 4) we would
hope to conclude that
16.8 In the analysis of variance we will assume that
16.9 The analysis of variance assumes that
16.10 An important assumption in the one-way analysis of variance is that
16.11+ When we speak about error variance in the analysis of variance we are speaking
of
16.12+ The analysis of variance compares
16.13 If the null hypothesis is true, we would expect the F in the analysis of variance to
be
Test Bank
344
16.14+ In the analysis of variance, the more the null hypothesis is false,
16.15+ In evaluating the F in the analysis of variance, we need to know
16.16 In the analysis of variance, MSerror is
16.17 When we use the phrase “within group” we mean
16.18 We use the symbol
2
X
s
to represent
16.19 If the null hypothesis in the analysis of variance were true,
16.20+ When we reject the null hypothesis in the analysis of variance we can conclude
that
Chapter 16
345
16.21 The notation (X –
X
..)2 produces the term we call the
16.22 The notation
( )
2
..XXn j−
is used to calculate
16.23 In an analysis of variance summary table, the df for groups always equals
16.24 The column of mean squares in the analysis of variance is obtained by
16.25 Mean squares are closest to
16.26 For an F value to be significant it must
16.27 In a one-way analysis of variance we deal with unequal sample sizes by
16.28+ Unequal sample sizes in a one-way analysis of variance are generally
Test Bank
346
The following analysis of variance summary table applies to the next several questions.
Source
df
SS
MS
F
p
Group
2
226.932
113.466
5.53
.031
Error
9
1845.993
20.511
Total
92
2072.925
16.29+ How many subjects were there in this experiment?
16.30+ How many groups were there in this experiment?
16.31+ What would you conclude from the summary table above?
16.32+ In the experiment whose summary table is given above, the average standard
deviation in each of the groups was approximately
16.33 Which of the following is a possible null hypothesis in an analysis of variance
with 5 groups?
(H1: µ1 µ2 µ3 µ4 µ5; H2: µ1 µ2 = µ3 = µ4 = µ5)
16.34+ If we run six independent comparisons among means, each at the five percent
level, the overall familywise error rate will be approximately
Chapter 16
347
16.35+ Fisher’s LSD test is most useful when
16.36 The familywise error rate is
16.37 The Bonferroni procedure controls error rates by
16.38 We can probably get away with violating assumptions if
16.39 The major difference between 2 (eta-squared) and 2 (omega-squared) is that
16.40 The magnitude of effect in a study was calculated to yield values for both 2 and
2. Which of the following relationships between 2 and 2 is likely?
16.41+ A researcher found significant differences in the mean running speeds of sprinters
wearing shoes made by Nike, Reebok, and Adidas using an analysis of variance.
The 2 calculated on the basis of group membership (based on which shoes were
worn) equaled .16. The value of 2 shows that
Test Bank
16.42 The null hypothesis behind a simple multiple-group analysis of variance is of the
form:
16.43 Which of the following is not a multiple comparison procedure we have discussed
in class or seen in the texts.
16.44 Eysenck’s study on recall as a function of level of processing showed
16.45 We want to compare the scores of different groups on a measure of reaction time.
Three different groups were studied: patients with recent head injuries, patients
with old head injuries, and a control group of non-injured people. We want to
know which group of people has the fastest reaction time. What is the best
statistical test to use to find this out?
16.46 In the analysis of variance, MSGroups measures how different group means are, and
MSerror measures variability within each group. If the null hypothesis were false,
what would we expect to find?
16.47 When looking at multiple comparisons, the more tests that you run, the more
likely that you will have a _______.
Chapter 16
16.48 The familywise error rate is
16.49 We want to compare the scores of different groups on a measure of reaction time.
Three different groups were studied: patients with recent head injuries, patients
with head injuries that occurred a year ago, and a control group of non-injured
people. We want to know which group of people has the fastest reaction time.
What is the best statistical test to use to find this out?
16.50 The mean square error (MSerror) is a measure of
16.51 What type of multiple comparison procedure should be used if we want to divide
the familywise error rate among the number of comparisons that we are
performing?
16.52 When analyzing results of an ANOVA we are most interested in the _______.
16.53 You want to control the _______ when multiple comparisons are being made?
Test Bank
16.54 A student wanted to determine if the mean number of times a student missed class
was different for sophomores, juniors, and seniors. After collecting attendance
data, the student ran an ANOVA and found that MSgroups was much larger than
MSerror. This student can conclude that
16.55 The book discusses an experiment by Merrell that examined the effects of
Anthrax, Mozart, and no music on the amount of time it took a mouse to run a
maze. To determine if there is an overall difference between the three groups,
Merrell ran an ANOVA. To determine which means differed for each other, he
ran a
16.56 In multiple comparison procedures, post-hoc tests are completed after the
ANOVA. Why are post-hoc tests preferred over running several t-tests?
16.57 The post-hoc test which holds the familywise error rate at .05 by running each
individual test at the c/alpha level (# comparisons/alpha) is the
16.58 A common criticism of Fisher’s LSD test is that
16.59 What are our choices for effect size measures for a one-way ANOVA?
Chapter 16
16.60 When we run a one-way ANOVA with four groups and obtain a significant F, the
best effect-size measure to convey what that result tells us is
ˆ
d
16.61 We have run a one-way ANOVA comparing three treatments for anorexia and
found a significant difference. We now want to convey the most useful
information to our reader about how effect one treatment is relative to one or
more other treatments. The best statistic to use here to convey that information
would most likely be
16.62 Cohen’s
ˆ
d
is generally a better measure than 2 or 2 because
16.63 When we use the phrase “omnibus null hypothesis” we are referring to
16.64 We generally don’t compute a confidence interval on the omnibus null hypothesis
because
16.65 The analysis of variance differs from a t test for two independent samples because
Test Bank
352
16.66 Which of the following represents a measure of the magnitude of effect?
TRUE/FALSE QUESTIONS
differ significantly one another significantly.
to group membership.
OPEN-ENDED QUESTIONS
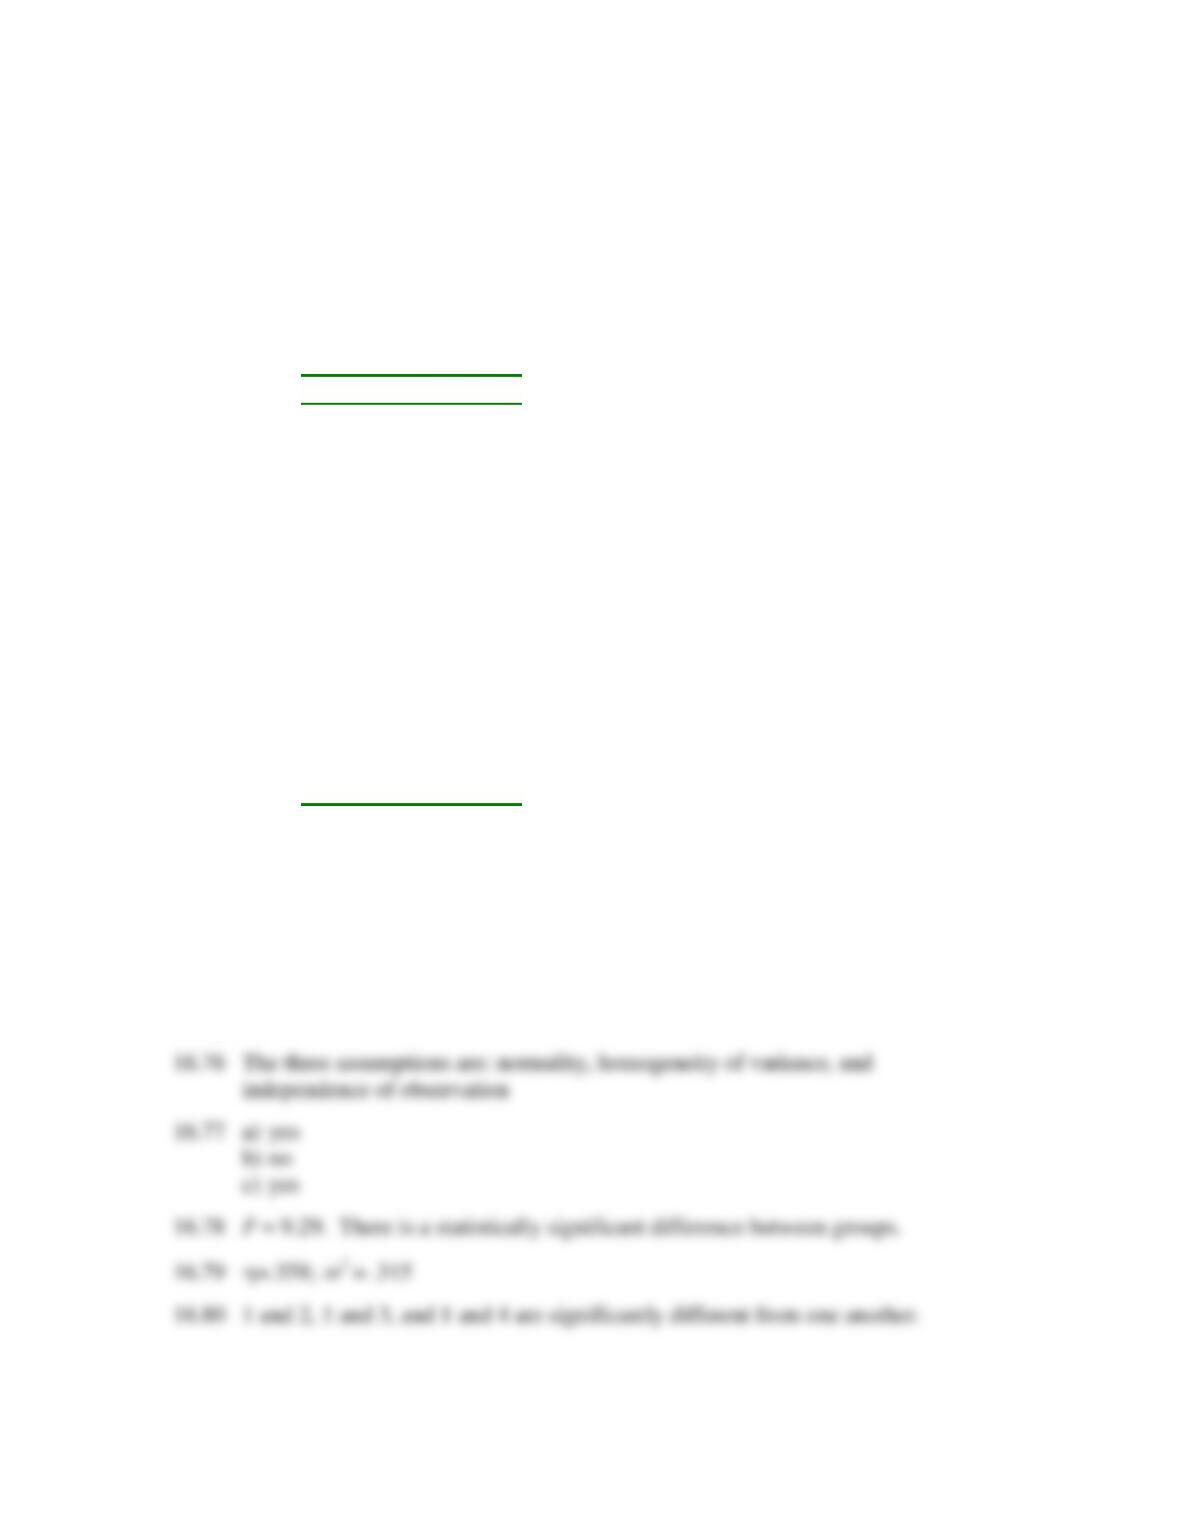
16.76 Name 3 assumptions underlying a one-way ANOVA.
16.77 Indicate whether or not each of the following F statistics are significant based on
the following information, assuming = .05.
a) F (4, 120) = 3.26
b) F (2, 60) = 3.10
c) F (6, 500) = 2.14
16.78 Given the following information, calculate and interpret F.
Source
df
SS
Group
3
312.63
Error
50
560.76
Total
53
873.39
16.79 Calculate 2 and
2
for the previous problem.
Chapter 16
353
16.80 An overall ANOVA was significant. A student calculated t-tests between each of
the groups. Each group consisted of 15 people. Which groups are significantly
different from one another using a Bonferroni correction?
Groups being compared
1 & 2
1 & 3
1 & 4
2 & 3
2 & 4
3 & 4
t value
5.63
3.56
4.29
2.60
1.79
2.76
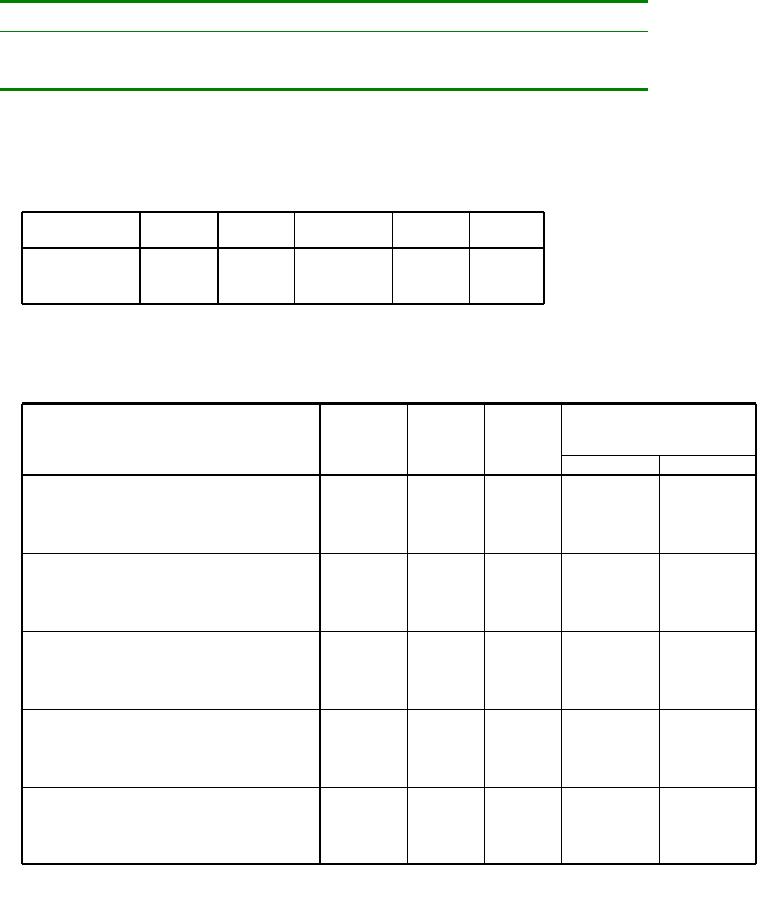
16.81 Answer the following questions based on this SPSS output.
ANOVA
Traditional Sex Roles Score
15279.466
4
3819.866
170.897
.000
8761.906
392
22.352
24041.372
396
Between Groups
Within Groups
Total
Sum of
Squares
df
Mean Square
F
Sig.
Multiple Comparisons
Dependent Variable: Traditional Sex Roles Score
LSD
-4.96
*
.70
.000
-6.33
-3.59
-5.53
*
2.41
.022
-10.27
-.79
-12.35
*
2.77
.000
-17.79
-6.90
-14.27
*
.57
.000
-15.39
-13.14
4.96
*
.70
.000
3.59
6.33
-.56
2.42
.816
-5.32
4.19
-7.38
*
2.78
.008
-12.84
-1.92
-9.30
*
.61
.000
-10.51
-8.10
5.53
*
2.41
.022
.79
10.27
.56
2.42
.816
-4.19
5.32
-6.82
3.61
.060
-13.92
.28
-8.74
*
2.39
.000
-13.43
-4.04
12.35
*
2.77
.000
6.90
17.79
7.38
*
2.78
.008
1.92
12.84
6.82
3.61
.060
-.28
13.92
-1.92
2.75
.485
-7.33
3.49
14.27
*
.57
.000
13.14
15.39
9.30
*
.61
.000
8.10
10.51
8.74
*
2.39
.000
4.04
13.43
1.92
2.75
.485
-3.49
7.33
(J) Number of children
1.00
2.00
3.00
4.00
.00
2.00
3.00
4.00
.00
1.00
3.00
4.00
.00
1.00
2.00
4.00
.00
1.00
2.00
3.00
(I) Number of children
.00
1.00
2.00
3.00
4.00
Mean
Dif ference
(I-J)
Std. Error
Sig.
Lower Bound
Upper Bound
95% Conf idence Interv al
The mean dif ference is signif icant at the .05 lev el.
*.
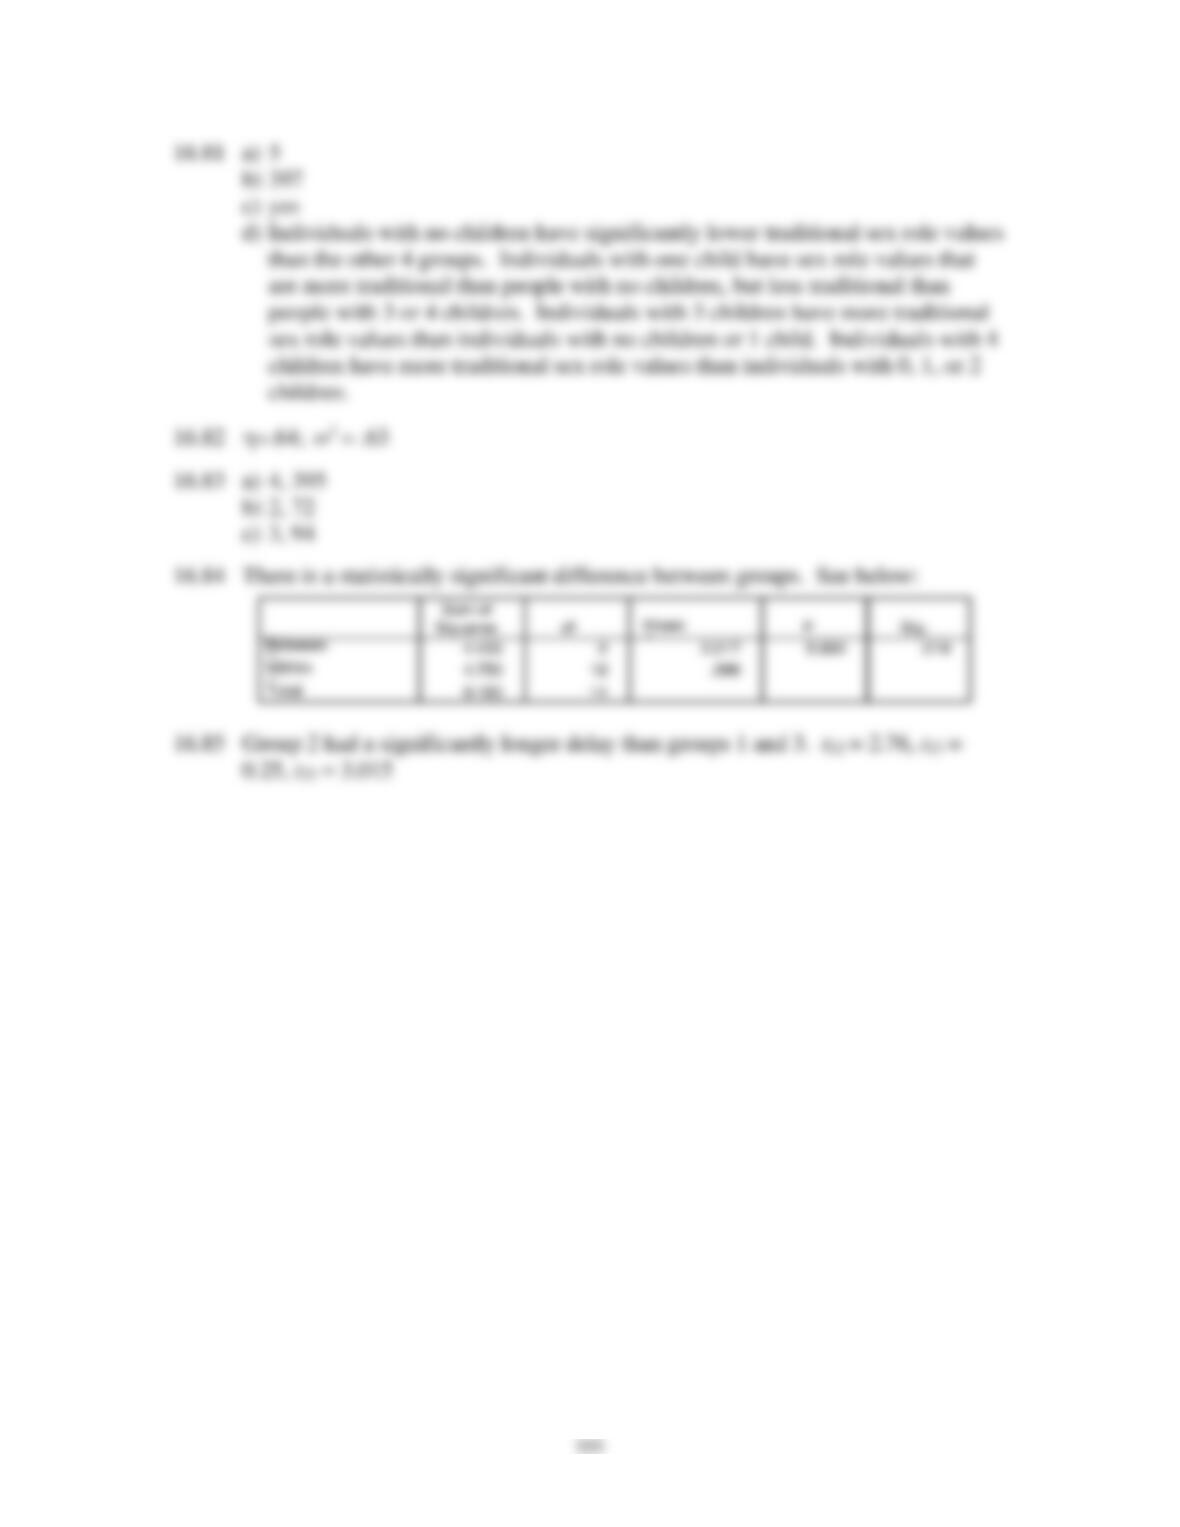
a) How many groups were compared?
b) What was the total sample size?
c) Was the ANOVA significant?
d) Which groups are significantly different from one another? Explain the nature
of the differences.
16.82 Calculate 2 and
2
for the previous problem.
Test Bank
354
16.83 Given the following information, what are the degrees of freedom for the
numerator and the denominator.
a) k = 5, N = 400
b) k = 3, N = 75
c) k = 4, N = 98
16.84 Based on the following data, create an ANOVA summary table and calculate and
interpret F.
GROUP
DELAY
1
.50
1
.75
1
1.00
1
1.25
1
1.00
2
1.00
2
2.00
2
3.00
2
1.00
2
3.00
3
1.00
3
.75
3
.50
3
.50
3
1.25
16.85 Calculate t using Fisher’s Least Significance Difference test to determine which
groups are significantly different from one another in the previous example.
Answers to Open-ended Questions
Chapter 16.
Chapter 16