Chapter 16 – Financial Statement Analysis
1. In horizontal analysis, the base year can be the immediately preceding period, or it can be a period further in the past.
a.
True
b.
False
True
2. A primary purpose of vertical analysis is to observe trends over a three-year period.
a.
True
b.
False
False
3. Common-size analysis expresses each item in a financial statement as a percent of a base amount.
a.
True
b.
False
True
4. In vertical analysis of the income statement, cost of goods sold is represented by 100%.
a.
True
b.
False
False
5. In vertical analysis of the balance sheet, total liabilities are represented by 100%.
a.
True
b.
False
False
6. In the vertical analysis of a balance sheet, the base for current liabilities is total liabilities.
a.
True
b.
False
False
7. The use of common-size analysis makes comparisons more meaningful because percentages eliminate the effects of
size.
a.
True
b.
False
True
8. Two major forms of common-size analysis are horizontal analysis and vertical analysis.
a.
True
b.
False
True
Chapter 16 – Financial Statement Analysis
9. Horizontal analysis involves comparing two or more years’ financial data for a single company.
a.
True
b.
False
True
10. Common-size statements are statements of companies of similar size and operations.
a.
True
b.
False
False
11. An example of horizontal analysis is the increase in cost of goods sold by 25% from 20X0 to 20X1.
a.
True
b.
False
True
12. For meaningful analysis, ratios should be compared with a standard.
a.
True
b.
False
True
13. Companies in the same industry may use different accounting methods, diminishing the usefulness of some industrial
averages.
a.
True
b.
False
True
14. Small sample sizes for an industrial report rarely cause a comparability problem in using standards.
a.
True
b.
False
False
15. Labor markets can impact industrial statistics and standards.
a.
True
b.
False
True
16. Industrial statistics should be taken as absolute norms as far as standards for comparability.
a.
True
b.
False
False
17. Terms of sale can produce statistical variations among companies within the same industry.
a.
True
b.
False
True
Chapter 16 – Financial Statement Analysis
18. A number of online sources contain competitive information on individual company’s ratios.
a.
True
b.
False
True
19. Industrial figures, standards and statistics should be used with so much care that they are not a very good reference
point to compare companies.
a.
True
b.
False
False
20. Liquidity ratios measure the ability of a company to meet its current obligations.
a.
True
b.
False
True
21. The current ratio is a measure of the ability of a company to pay its short-term liabilities out of short-term assets.
a.
True
b.
False
True
22. The inventory turnover ratio measures the number of days the average balance of accounts receivable is outstanding
before being converted into cash.
a.
True
b.
False
False
23. Inventory turnover is a measure of liquidity that focuses on efficient use of inventory.
a.
True
b.
False
True
24. The quick ratio should be larger than the current ratio.
a.
True
b.
False
False
The quick ratio should be smaller than the current ratio.
25. All debt is considered in the computation of the quick ratio.
a.
True
b.
False
26. When computing the quick ratio, a short-term note receivable would be included.
Chapter 16 – Financial Statement Analysis
a.
True
b.
False
True
27. Jill’s Market has an inventory turnover of 120 times. Scott’s Market has a turnover of 128 times. Scott’s is more
effective in managing inventory.
a.
True
b.
False
True
28. Profitability ratios assess the ability of a company to meets its long– and short-term obligations.
a.
True
b.
False
False
Leverage ratios assess the ability of a company to meets its long- and short-term obligations.
29. The dividend payout ratio is equal to common dividends divided by (Net Income − Preferred Dividends).
a.
True
b.
False
True
30. Dividing the market price of a share of stock by the earnings per share gives the price-earnings ratio.
a.
True
b.
False
True
31. _________________ expresses a line item as a percentage of some prior-period amount.
32. _____________________ expresses a line item as a percentage of some other line item for the same period.
33. ____________ are fractions or percentages computed by dividing one account or line-item amount by another.
Ratios
34. _________________ measure the ability of a company to meet its current obligations.
35. The measures of the ability of a company to meets its long- and short-term obligations are known as
_______________.
36. For meaningful analysis, ratios should be compared with a ____________.
standard
37. The ________________ is a measure of the ability of a company to pay its short-term liabilities out of short-term
assets.
Chapter 16 – Financial Statement Analysis
current ratio
38. The _________________ is a measure of liquidity that compares only the most liquid assets with current liabilities.
39. How long it takes a company to turn its receivables into cash is known as the ________________.
accounts receivable turnover in days
40. The _____________________ gives the number of days inventory is held before being sold.
inventory turnover ratio in days
41. The _________________ uses the income statement to assess a company’s ability to service its debt.
times-interest-earned ratio
42. The ________________ is computed by dividing a company’s total liabilities by its total assets.
debt ratio
43. ______________ and ____________ are the two major sources of capital.
44. The ________________ is calculated by dividing total liabilities by total stockholders’ equity.
45. Creditors would like the debt-to-equity ratio to be _______, indicating that stockholders have financed most of the
assets of the firm.
46. ____________________ represents the percentage of each sales dollar that remains after all expenses have been
subtracted.
Return on sales
47. The ratios that allow investors, creditors, and managers to evaluate the extent to which invested funds are being used
efficiently are called ____________.
profitability ratios
48. A company measures how efficiently it is using its assets by calculating the _______________.
return on assets
49. The ___________________ is calculated by dividing the market price per share by earnings per share.
price-earnings ratio
50. Investors who prefer gains through appreciation will generally prefer a ___________ dividend payout ratio.
51. The two major techniques for financial analysis are
a.
horizontal analysis and circular analysis.
b.
receivable analysis and profitability analysis.

Chapter 16 – Financial Statement Analysis
c.
vertical analysis and budget analysis.
d.
common-size analysis and ratio analysis.
52. Horizontal analysis is also known as
a.
linear analysis.
b.
vertical analysis.
c.
trend analysis.
d.
budget analysis.
53. Horizontal analysis is a technique for evaluating a series of financial statement data over a period of time
a.
that has been arranged from the highest amount to the lowest amount.
b.
that has been arranged from lowest amount to the highest amount.
c.
to determine which items are in error.
d.
to determine the amount and/or percentage increase or decrease that has taken place.
54. In horizontal analysis, each item is expressed as a percentage of the
a.
retained earnings figure.
b.
total assets figure.
c.
net income figure.
d.
base year figure.
55. In vertical analysis, line items on the balance sheet are generally expressed as a percentage of
a.
total liabilities.
b.
net income.
c.
total assets.
d.
cost of goods sold.
56. In vertical analysis, line items on the income statement are generally expressed as a percentage of
a.
net income.
b.
net sales.
c.
cost of goods sold.
d.
total assets.
57. Vertical analysis is a technique that expresses each item in a financial statement
a.
in dollars and cents.
b.
as a percent of the item in the previous year.
c.
as a percent of a base amount.
d.
starting with the highest value down to the lowest value.

Chapter 16 – Financial Statement Analysis
58. In vertical analysis
a.
a base amount is required.
b.
a base amount is optional.
c.
the same base is used across all financial statements analyzed.
d.
the results of the horizontal analysis are necessary inputs for performing the analysis.
a
59. The type of analysis that is concerned with the relationships among the components of the financial statements is a
a.
vertical analysis.
b.
trend analysis.
c.
profitability analysis.
d.
ratio analysis.
a
60. Horizontal analysis is analysis
a.
of percentage changes over two or more years.
b.
in which all items are presented as a percentage of one selected item on a financial statement.
c.
in which a statistic is calculated for the relationship between two items on a single financial statement or for
two items on different financial statements.
d.
of all ratios that increased or decreased over past accounting periods.
a
61. Trend analysis is analysis
a.
of percentage changes over several years.
b.
in which all items are presented as a percentage of one selected item on a financial statement.
c.
in which a statistic is calculated for the relationship between tow items on a single financial statement or for
two items on different financial statements.
d.
of all ratios that increased or decreased over past accounting periods.
a
62. If year one equals $800,000, year two equals $840,000, and year three equals $896,000, the percentage to be assigned
for year three in a trend analysis, assuming that year 1 is the base year, is
a.
100%.
b.
89%.
c.
105%.
d.
112%.
63. Assume the following sales data for a company:
20X6
$1,000,000
20X5
900,000
20X4
750,000
20X0
500,000
If 2008 is the base year, what is the percentage increase in sales from 20X0 to 20X4?
a.
100%
Chapter 16 – Financial Statement Analysis
b.
180%
c.
50%
d.
55.5%
c
64. Which one of the following is not a characteristic generally evaluated in ratio analysis?
a.
liquidity
b.
profitability
c.
leverage
d.
marketability
65. Many industrial averages and figures are published in the each of the following except?
a.
Key Business Ratios, Dun and Bradstreet
b.
The Almanac of Business and Industrial Financial Ratios, Prentice-Hall
c.
Annual Random Studies, Robert Morris Associates
d.
Standard and Poor’s Industry Survey, Standard & Poor’s
e.
Dow Jones-Irwin Business and Investment Almanac, Dow Jones-Irwin
Industrial Averages and/or figures are found in Annual Statement Studies by Robert Morris Associates.
66. For meaningful analysis, ratios are best compared with
a.
historical company averages.
b.
industrial averages.
c.
historical company averages and industrial averages.
d.
no standard.
c
67. Short-term creditors are usually most interested in assessing
a.
leverage.
b.
liquidity.
c.
marketability.
d.
profitability.
68. A common measure of liquidity is
a.
return on total assets.
b.
accounts receivable turnover.
c.
return on sales.
d.
debt to equity ratio.
69. The current ratio is a
a.
liquidity ratio.
b.
profitability ratio.

Chapter 16 – Financial Statement Analysis
c.
leverage ratio.
d.
cash flow ratio.
a
70. The quick ratio
a.
is used to quickly determine a company’s leverage and long-term debt-paying ability.
b.
relates cash, marketable securities, and net receivables to current liabilities.
c.
is calculated by taking one item from the income statement and one item from the balance sheet.
d.
is the same as the current ratio except it is rounded to the nearest whole percent.
71. The accounts receivable turnover and inventory turnover ratios are used to analyze
a.
long-term debt-paying ability.
b.
profitability.
c.
leverage.
d.
liquidity.
72. A high accounts receivable turnover ratio indicates
a.
customers are making payments quickly.
b.
a large portion of the company’s sales are on credit.
c.
many customers are not paying their receivables.
d.
the company’s sales have increased.
a
73. Which one of the following would not be considered a liquidity ratio?
a.
current ratio
b.
inventory turnover ratio
c.
quick ratio
d.
return on total assets ratio
74. The ratios that are used to determine a company’s short-term debt paying ability are
a.
asset turnover, times interest earned, current ratio, and account receivable turnover.
b.
times interest earned, inventory turnover, current ratio, and accounts receivable turnover.
c.
times interest earned, quick ratio, current ratio, and inventory turnover.
d.
current ratio, quick ratio, accounts receivable turnover, and inventory turnover.
75. Swanson Company had $250,000 of current assets and $90,000 of current liabilities before borrowing $60,000 from
the bank with a 3-month note payable. What effect did the borrowing transaction have on Swanson Company’s current
ratio?
a.
The ratio remained unchanged.
b.
The change in the current ratio cannot be determined.
c.
The ratio decreased.
Chapter 16 – Financial Statement Analysis
d.
The ratio increased.
c
76. If equal amounts are added to the numerator and the denominator of a current ratio equal to one, the ratio will
a.
increase.
b.
decrease.
c.
remain the same.
d.
equal zero.
c
77. The quick ratio
a.
does not include inventory as part of the numerator.
b.
does not include all current liabilities in the calculation.
c.
is a quick calculation of an approximation of the current ratio.
d.
includes prepaid expenses as part of the numerator.
a
78. The inventory turnover is calculated by dividing
a.
cost of goods sold by the ending inventory.
b.
cost of goods sold by the beginning inventory.
c.
cost of goods sold by the average inventory.
d.
average inventory by cost of goods sold.
c
79. A successful grocery store would probably have
a.
a low inventory turnover.
b.
a high inventory turnover.
c.
zero profit margin.
d.
low volume.
80. An aircraft company would most likely have
a.
a high inventory turnover.
b.
a low profit margin.
c.
high volume.
d.
a low inventory turnover.
81. Which of the following is an example of liquidity analysis?
a.
Bonds payable are divided by total liabilities and stockholders’ equity.
b.
Current assets are divided by current liabilities.
c.
Net income is divided by the number of shares of stock outstanding.
d.
Net income is divided by total assets.

Chapter 16 – Financial Statement Analysis
82. Which of the following is considered a liquidity analysis ratio?
a.
return on total assets ratio
b.
quick ratio
c.
dividend yield ratio
d.
return on sales ratio
83. The Gift Shoppe’s inventory turned over five times during the year. Similar gift shops have an inventory turnover
equal to ten times per year. What explains the Gift Shoppe’s inventory management?
a.
The Gift Shoppe sold too much inventory during the year.
b.
The Gift Shoppe needs to increase sales and decrease the amount of goods on hand.
c.
The Gift Shoppe is performing twice as well as it competitors.
d.
The Gift Shoppe should increase the amount of goods on hand to accommodate the additional inventory
demand.
84. The quick ratio differs from the current ratio in that it
a.
represents the amount of cash on hand instead of the amount of working capital.
b.
is a stricter test of a company’s ability to pay its current debts as they are due.
c.
excludes inventories and accounts receivable from the numerator of the fraction because of obsolescence and
possible default on payment.
d.
is more difficult to calculate.
85. Which of the following formulas would be used to determine the inventory turnover ratio?
a.
Net credit sales/Average inventory
b.
Average inventory/Net credit sales
c.
Cost of goods sold/Average inventory
d.
Average inventory/Cost of goods sold
86. Toller Drug Store had net credit sales of $6,000,000 and cost of goods sold of $2,000,000 for the year. The Accounts
Receivable balances at the beginning and end of the year were $350,000 and $250,000, respectively. The accounts
receivable turnover ratio was
a.
17.1 times.
b.
10.0 times.
c.
13.3 times.
d.
20.0 times.
87. The Grand Department Store had net credit sales of $12,000,000 and cost of goods sold of $8,000,000 for the year.
The average inventory for the year amounted to $1,600,000.
The inventory turnover ratio for the year is
a.
4.0 times.
b.
7.2 times.
Chapter 16 – Financial Statement Analysis
c.
5.0 times.
d.
2.5 times.
c
88. A company has an account receivable turnover ratio of 6. The average accounts receivable during the period are
$350,000. What is the amount of net sales for the period?
a.
$350,000
b.
$2,100,000
c.
$58,333
d.
Cannot be determined from the information given.
89. If the accounts receivable turnover is 42 days, what is the account receivable turnover ratio (assuming a 365 day
year)?
a.
7.14 times
b.
8.69 times
c.
4.52 times
d.
None of these
90. Dartmouth Company has a quick ratio of 2.5 to 1. It has current liabilities of $40,000 and noncurrent assets of
$70,000. If Dartmouth’s current ratio is 3.1 to 1, its inventory and prepaid expenses must be
a.
$12,400.
b.
$24,000.
c.
$30,000.
d.
$40,000.
2.5 × $40,000 = $100,000
3.1 × $40,000 = $124,000
91. Eagle Company has $9,000 in cash, $11,000 in marketable securities, $26,000 in current receivables, $34,000 in
inventories, and $40,000 in current liabilities. The company’s quick ratio is closest to
a.
1.35.
b.
1.15.
c.
2.00.
d.
1.73.
92. Siri Company has $20,000 in cash, $8,000 in marketable securities, $36,000 in current receivables, $18,000 in
inventories, and $68,000 in current liabilities. The company’s quick ratio is closest to
a.
.94.
b.
.41.
c.
1.88.
d.
1.21.

Chapter 16 – Financial Statement Analysis
a
93. Phillips Company had $300,000 in sales on account last year. The beginning accounts receivable balance was $25,000
and the ending accounts receivable balance was $18,000. The company’s accounts receivable turnover ratio was closest to
a.
16.67.
b.
12.00.
c.
3.85.
d.
13.95.
94. Miller Company had $120,000 in sales on account last year. The beginning accounts receivable balance was $8,000
and the ending accounts receivable balance was $14,000. The company’s accounts receivable turnover ratio was closest to
a.
5.45.
b.
8.57.
c.
10.91.
d.
15.00.
c
95. Arnold Company had $650,000 in sales on account last year. The beginning accounts receivable balance was $24,000
and the ending accounts receivable balance was $36,000. The company’s accounts receivable turnover ratio was closest to
a.
21.67.
b.
10.83.
c.
27.08.
d.
18.06.
a
96. Kringle Company, a retailer, had cost of goods sold of $1,400,000 last year. The beginning inventory balance was
$125,000 and the ending inventory balance was $142,000. The company’s inventory turnover ratio was closest to
a.
10.49.
b.
5.24.
c.
11.20.
d.
9.86.
a
97. Lost Shoe Company, a retailer, had cost of goods sold of $220,000 last year. The beginning inventory balance was
$30,000 and the ending inventory balance was $21,000. The company’s inventory turnover ratio was closest to
a.
10.48.
b.
7.33.
c.
4.31.
d.
8.63.
98. Jackson Company, a retailer, had cost of goods sold of $140,000 last year. The beginning inventory balance was
$8,000 and the ending inventory balance was $11,000. The company’s inventory turnover ratio was closest to
a.
12.73.
b.
14.74.
Chapter 16 – Financial Statement Analysis
c.
7.37.
d.
17.50.
99. Lisa’s Dress Company, a retailer, had cost of goods sold of $180,000 last year. The beginning inventory balance was
$13,000 and the ending inventory balance was $18,000. The company’s average inventory turnover in days was closest to
a.
36.50 days.
b.
26.36 days.
c.
31.44 days.
d.
62.86 days.
c
100. Mike’s Sportswear Company, a retailer, had cost of goods sold of $420,000 last year. The beginning inventory
balance was $31,000 and the ending inventory balance was $28,000. The company’s average inventory turnover in days
was closest to
a.
25.63 days.
b.
51.27 days.
c.
26.94 days.
d.
24.33 days.
a
101. The following information pertains to Barkley Company.:
Merchandise purchased
$1,800,000
Cost of goods sold
$2,000,000
Inventory at the end of the year
$ 400,000
The inventory turnover ratio for the year was
a.
10.
b.
5.
c.
4.
d.
3.6.
Average Inventory ($600,000 + $400,000) / 2 = $500,000
102. A liquidity ratio measures the
a.
income or operating success of an enterprise over a period of time.
b.
ability of the enterprise to survive over a long period of time.
c.
short-term ability of the enterprise to pay its obligations and to meet unexpected needs for cash.
d.
number of times interest is earned.
c
103. Parr Hardware Store had net credit sales of $5,200,000 and cost of goods sold of $4,000,000 for the year. The
Accounts Receivable balances at the beginning and end of the year were $600,000 and $700,000, respectively. The
accounts receivables turnover was
Chapter 16 – Financial Statement Analysis
a.
7.4 times.
b.
8.7 times.
c.
6.2 times.
d.
8 times.
104. The current assets of Caitlin Company are $360,000. The current liabilities are $240,000. The current ratio is
a.
1.25.
b.
1.50.
c.
0.67.
d.
cannot be determined from the information provided.
105. If a company has an acid-test ratio of 1.2, what respective effects will the borrowing of cash by short-term debt and
the collection of accounts receivable have on the ratio?
Short-term Collection of
Borrowing Receivable
a.
Increase No effect
b.
Increase Increase
c.
Decrease No effect
d.
Decrease Decrease
c
106. A company has a receivables turnover of 15 times. The average net receivables during the period are $430,000. What
is the amount of net credit sales for the period?
a.
$430,000
b.
$6,450,000
c.
$6,000,000
d.
$500,000
107. A company has an average inventory on hand of $100,000 and the days in inventory are 73 days. What is the cost of
goods sold?
a.
$500,000
b.
$7,300,000
c.
$1,000,000
d.
$3,650,000
108. Which one of the following would be considered a leverage ratio?
a.
accounts receivable turnover
b.
return on total assets
Chapter 16 – Financial Statement Analysis
c.
quick ratio
d.
debt ratio
109. Grant Company reported the following on its income statement:
Income before income taxes
$420,000
Income tax expense
120,000
Net income
$300,000
An analysis of the income statement revealed that interest expense was $60,000. Grant Company’s times-interest-earned
ratio was
a.
8.
b.
7.
c.
6.
d.
5.
a
110. Last year Neil Company had a net income of $170,000, income tax expense of $37,000, and interest expense of
$24,000. The company’s times-interest-earned ratio was closest to
a.
8.63.
b.
7.08.
c.
9.63.
d.
6.24.
c
111. Last year Fuller Company had a net income of $410,000, income tax expense of $50,000, and interest expense of
$34,000. The company’s times-interest-earned ratio was closest to
a.
12.06.
b.
9.88.
c.
14.53.
d.
13.53.
c
112. Cottle Company has total assets of $180,000 and total liabilities of $54,000. The company’s debt-to-equity ratio is
closest to
a.
0.32.
b.
2.3.
c.
0.30.
d.
0.43.
$180,000 − $54,000 = $126,000
113. Opis Company has total assets of $475,000 and total liabilities of $130,000. The company’s debt-to-equity ratio is
closest to
a.
0.32.
Chapter 16 – Financial Statement Analysis
b.
0.21.
c.
0.38.
d.
0.27.
114. Holt Company reported the following on its income statement:
Income before income taxes
$420,000
Income tax expense
120,000
Net income
$300,000
An analysis of the income statement revealed that interest expense was $52,500. Holt Company’s times-interest-earned
ratio was
a.
9.
b.
8.
c.
7.
d.
6.
a
115. Presented below are selected data from the financial statements of Russell Corp. for 20X1 and 20X0.
20X1
20X0
Net income
$100,000
$123,000
Cash dividends paid on preferred stock
$12,000
$15,000
Cash dividends paid on common stock
$42,000
$38,000
Weighted average number of common shares outstanding
$105,000
$95,000
Earnings per share is reported on the 20X1 income statement as
a.
$ 0.44.
b.
$ 0.55.
c.
$ 0.84.
d.
$ 0.95.
116. Presented below are selected data from the financial statements of Korn Corp. for 20X1 and 20X0.
20X1
20X0
Net income
$100,000
$123,000
Weighted average number of common shares outstanding
105,000
95,000
Market price per share of common stock at the end of the year
$12.00
$10.00
Earnings per share
$ 2.00
$ 1.83
The price-earnings ratio for 20X1 is
a.
1.09.
b.
5.46.
c.
6.0.

Chapter 16 – Financial Statement Analysis
d.
11.0.
c
117. Presented below are selected data from the financial statements of DeBruce Corp. for 20X1 and 20X0.
20X1
20X0
Net income
$110,000
$123,000
Cash dividends paid on common stock
$ 42,000
$ 38,000
Market price per share of common stock at the end of the year
$16.00
$13.00
Earnings per share
$ 0.84
$ 0.74
Shares of common stock outstanding
140,000
100,000
The dividend payout ratio for 20X1 is
a.
0.382.
b.
0.05.
c.
0.28.
d.
0.50.
a
Figure 16–1.
Starbuck Corporation had net income of $250,000 and paid dividends to common stockholders of $50,000 in 20X0. The
weighted average number of shares outstanding in 20X0 was 50,000 shares. Starbuck Corporation’s common stock is
selling for $40 per share on the New York Stock Exchange.
118. Refer to Figure 16–1. Starbuck’s price-earnings ratio is
a.
2.
b.
5.
c.
10.
d.
8.
119. Refer to Figure 16–1. Starbuck’s dividend payout ratio for 20X0 is
a.
$5 per share.
b.
0.25.
c.
0.20.
d.
0.125.
c
120. Goslier Company’s net income last year was $130,000. The company paid preferred dividends of $42,000 and its
average common stockholders’ equity was $610,000. The company’s return on common stockholders’ equity for the year
was closest to
a.
15.8%.
b.
28.1%.
c.
21.3%.
d.
14.4%.
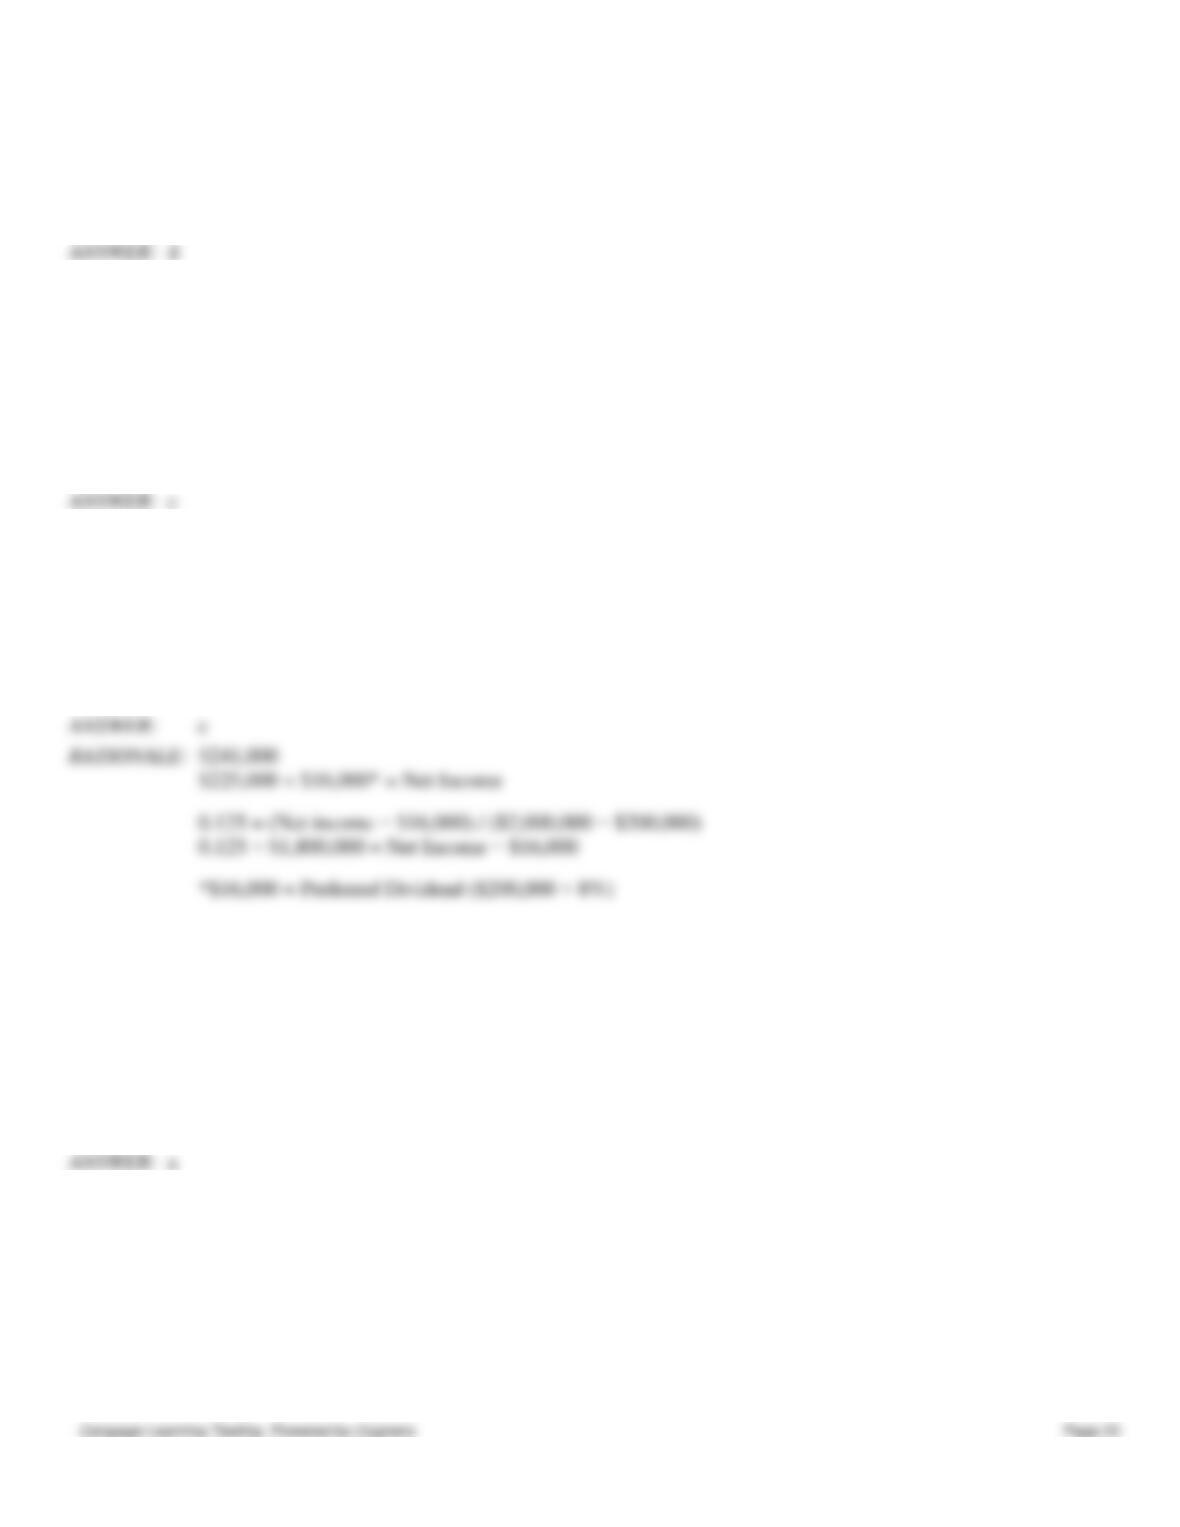
121. Fastlane Company has 50,000 shares of common stock and 20,000 shares of preferred stock outstanding. There was
no change in the number of common or preferred shares outstanding during the year. Preferred stockholders received

Chapter 16 – Financial Statement Analysis
dividends this year totaling $120,000. Common stockholders received dividends totaling $200,000. If the dividend payout
ratio for the year was 80%, then the net income was
a.
$400,000.
b.
$370,000.
c.
$160,000.
d.
$250,000.
122. The following data have been taken from your company’s financial records for the current year:
Earnings per share
$ 4.50
Market price per share
$46.00
Dividend per share
$ 3.00
Book value per share
$31.00
The price-earnings ratio is
a.
10.2.
b.
6.9.
c.
1.5.
d.
15.3.
a
123. Last year the return on total assets in Justin Company was 8.5%. The total assets were $2,900,000 at the beginning of
the year and $3,100,000 at the end of the year. The tax rate was 30%, interest expense totaled $110,000, and sales were
$5,200,000. Net income for the year was
a.
$145,000.
b.
$222,000.
c.
$332,000.
d.
$178,000.
124. Dowling Company’s net income last year was $40,000 and its interest expense was $8,000. Total assets at the
beginning of the year were $260,000 and total assets at the end of the year were $315,000. The company’s income tax rate
was 35%. The company’s return on total assets for the year was closest to
a.
14.5%.
b.
15.7%.
c.
16.7%.
d.
7.9%.
125. Selected financial data from Harlow Company for the most recent year appear below:
Sales
$100,000
Cost of goods sold
$60,000
Dividends declared and paid
$5,000
Interest expense
$8,000
Operating expenses
$18,000
The income tax rate is 30%.
The return on sales ratio was closest to
Chapter 16 – Financial Statement Analysis
a.
14%.
b.
40%.
c.
22%.
d.
10%.
126. Clover Company’s net income last year was $80,000. The company paid preferred dividends of $12,000 and its
average common stockholders’ equity was $340,000. The company’s return on common stockholders’ equity for the year
was closest to
a.
27.1%.
b.
3.5%.
c.
20.0%.
d.
23.5%.
c
127. The average stockholders’ equity for Holloway Co. last year was $2,000,000. Included in this figure was $200,000
par value of 8% preferred stock. If the return on common stockholders’ equity was 12.5% for the year, net income was
a.
$225,000.
b.
$250,000.
c.
$241,000.
d.
$234,000.
128. Wellston Company’s net income last year was $300,000. The company has 100,000 shares of common stock and
30,000 shares of preferred stock outstanding. There was no change in the number of common or preferred shares
outstanding during the year. The company declared and paid dividends last year of $1.90 per share on the common stock
and $1.70 per share on the preferred stock. The earnings per share of common stock is closest to
a.
$2.49.
b.
$1.10.
c.
$3.51.
d.
$3.00.
a
129. Lew Company’s net income was $80,000 last year. The company has 20,000 shares of common stock and 5,000
shares of $100 par value, 7% preferred stock outstanding. There was no change in the number of common or preferred
shares outstanding during the year. The earnings per share of common stock was
a.
$4.00.
b.
$3.20.
c.
$2.25.
d.
$3.72.