Chapter 16 – Financial Statement Analysis
c
130. Data concerning Bouerneuf Company’s common stock follow:
Book value per share
$24.00
Market value per share
$18.00
Earnings per share
$6.00
Par value per share
$4.00
Dividend per share
$1.00
The price-earnings ratio would be
a.
2.0.
b.
2.7.
c.
3.0.
d.
4.0.
c
131. Bogart Company has 40,000 shares of common stock outstanding. The book value per share of this stock was $60
and the market value per share was $75 at the end of the year. Net income for the year was $400,000. Interest on long–
term debt was $40,000. Dividends paid to common stockholders were $3 per share. The tax rate was 30%. The company’s
price-earnings ratio at the end of the year was
a.
7.5.
b.
20.
c.
25.
d.
6.
Earnings Per Share = $10 = ($400,000 − $0) / 40,000
132. A common measure of profitability is
a.
the quick ratio.
b.
times-interest-earned ratio.
c.
return on common stockholders’ equity ratio.
d.
debt ratio.
c
133. Return on sales is calculated by dividing
a.
sales by cost of goods sold.
b.
gross profit by net sales.
c.
net income by stockholders’ equity.
d.
net income by sales.
134. Which of the following is considered a profitability ratio?
a.
earnings per share
b.
debt ratio
c.
quick ratio
Chapter 16 – Financial Statement Analysis
d.
inventory turnover ratio
135. Which profitability ratio requires the use of earnings per share in its calculation?
a.
price-earnings ratio
b.
return on common stockholders’ equity
c.
dividend yield
d.
return on sales
136. Which profitability ratio requires the use of earnings per share and the current market price?
a.
return on common stockholders’ equity
b.
dividend payout ratio
c.
dividend yield
d.
price-earnings ratio
137. Earnings per share is an indication of how much
a.
the company paid as dividends for each share of stock.
b.
the company earned for each share of outstanding common and preferred stock.
c.
the company earned for each share of outstanding common stock
d.
cash the company has for each share of all outstanding stock.
138. Chaney Inc. wants to measure the relationship between profitability and the investment made by stockholders.
Chaney should use
a.
return on common stockholders’ equity.
b.
earnings per share.
c.
return on sales.
d.
the statement of retained earnings.
139. ABC Company issued additional shares of stock for cash. The effect of the transaction is
a.
the earnings per share increased.
b.
the current ratio was increased.
c.
the debt-to-equity ratio increased.
d.
the return on total assets increased.
140. Eaton Corporation had net income of $6,000,000 in 20X0. Using 20X0 as the base year, net income decreased by
70% in 20X3 and increased by 140% in 20X4.
Required: Compute the net income reported by Eaton Corporation for 20X3 and 20X4.
X ÷ $6,000,000 = 70%
Chapter 16 – Financial Statement Analysis
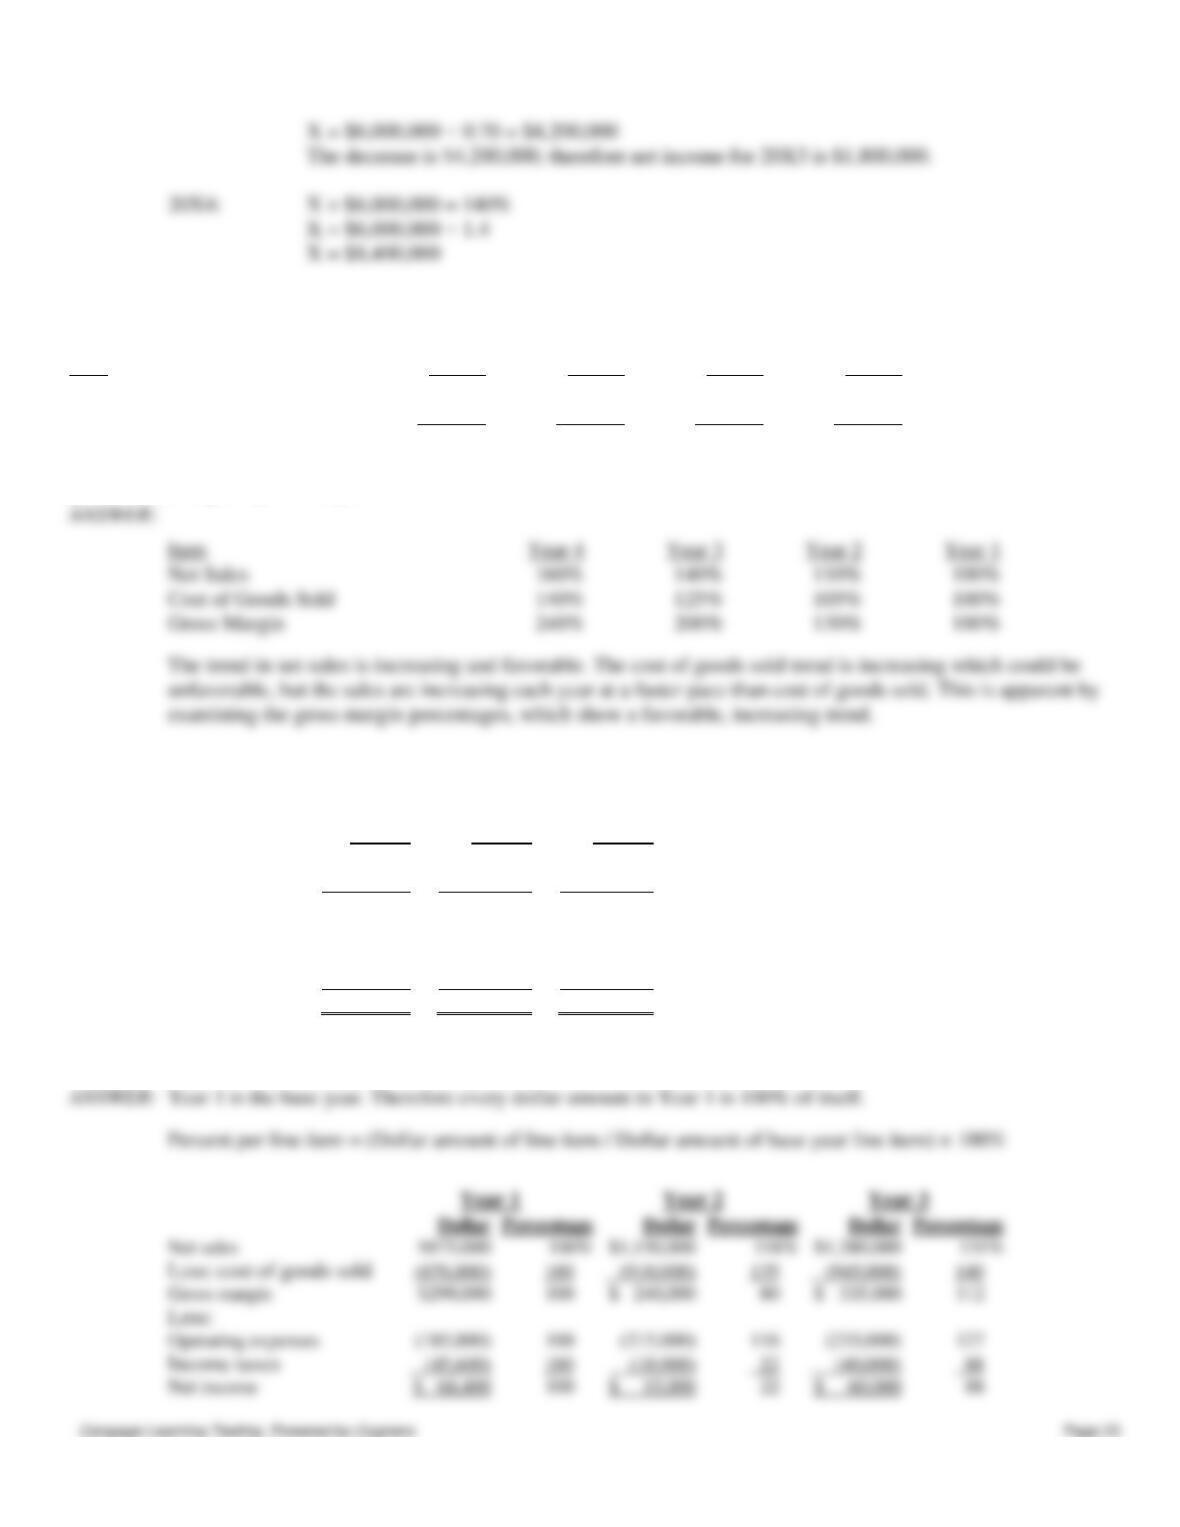
141. The following items were taken from the financial statements of Ritz Inc., over a 4-year period:
Item
Year 4
Year 3
Year 2
Year 1
Net Sales
$800,000
$700,000
$550,000
$500,000
Cost of Goods Sold
560,000
500,000
420,000
400,000
Gross Margin
$240,000
$200,000
$130,000
$100,000
Required: Using horizontal analysis and Year 1 as the base year, compute the trend percentages for net sales, cost of
goods sold, and gross profit. Explain whether the trends are favorable or unfavorable for each item.
Item
Year 4
Year 3
Year 2
Year 1
Net Sales
Cost of Goods Sold
Gross Margin
Figure 16-6
London Company provided the following income statements for its first 3 years of operation:
Year 1
Year 2
Year 3
Net sales
$ 975,000
$1,150,000
$1,280,000
Less: cost of goods sold
(676,000)
(910,000)
(945,000)
Gross margin
$ 299,000
$ 240,000
$ 335,000
Less:
Operating expenses
(185,000)
(215,000)
(235,000)
Income taxes
(45,600)
(10,000)
(40,000)
Net income
$ 68,400
$ 15,000
$ 60,000
142. Refer to Figure 16–6. Prepare a horizontal analysis using Year 1 as the base year. Explain if the results are favorable
or unfavorable.
Less: cost of goods sold
Less:
Income taxes
X = $6,000,000 × 0.70 = $4,200,000
The decrease is $4,200,000; therefore net income for 20X3 is $1,800,000.
20X4:
X ÷ $6,000,000 = 140%
X = $6,000,000 × 1.4
X = $8,400,000
Chapter 16 – Financial Statement Analysis
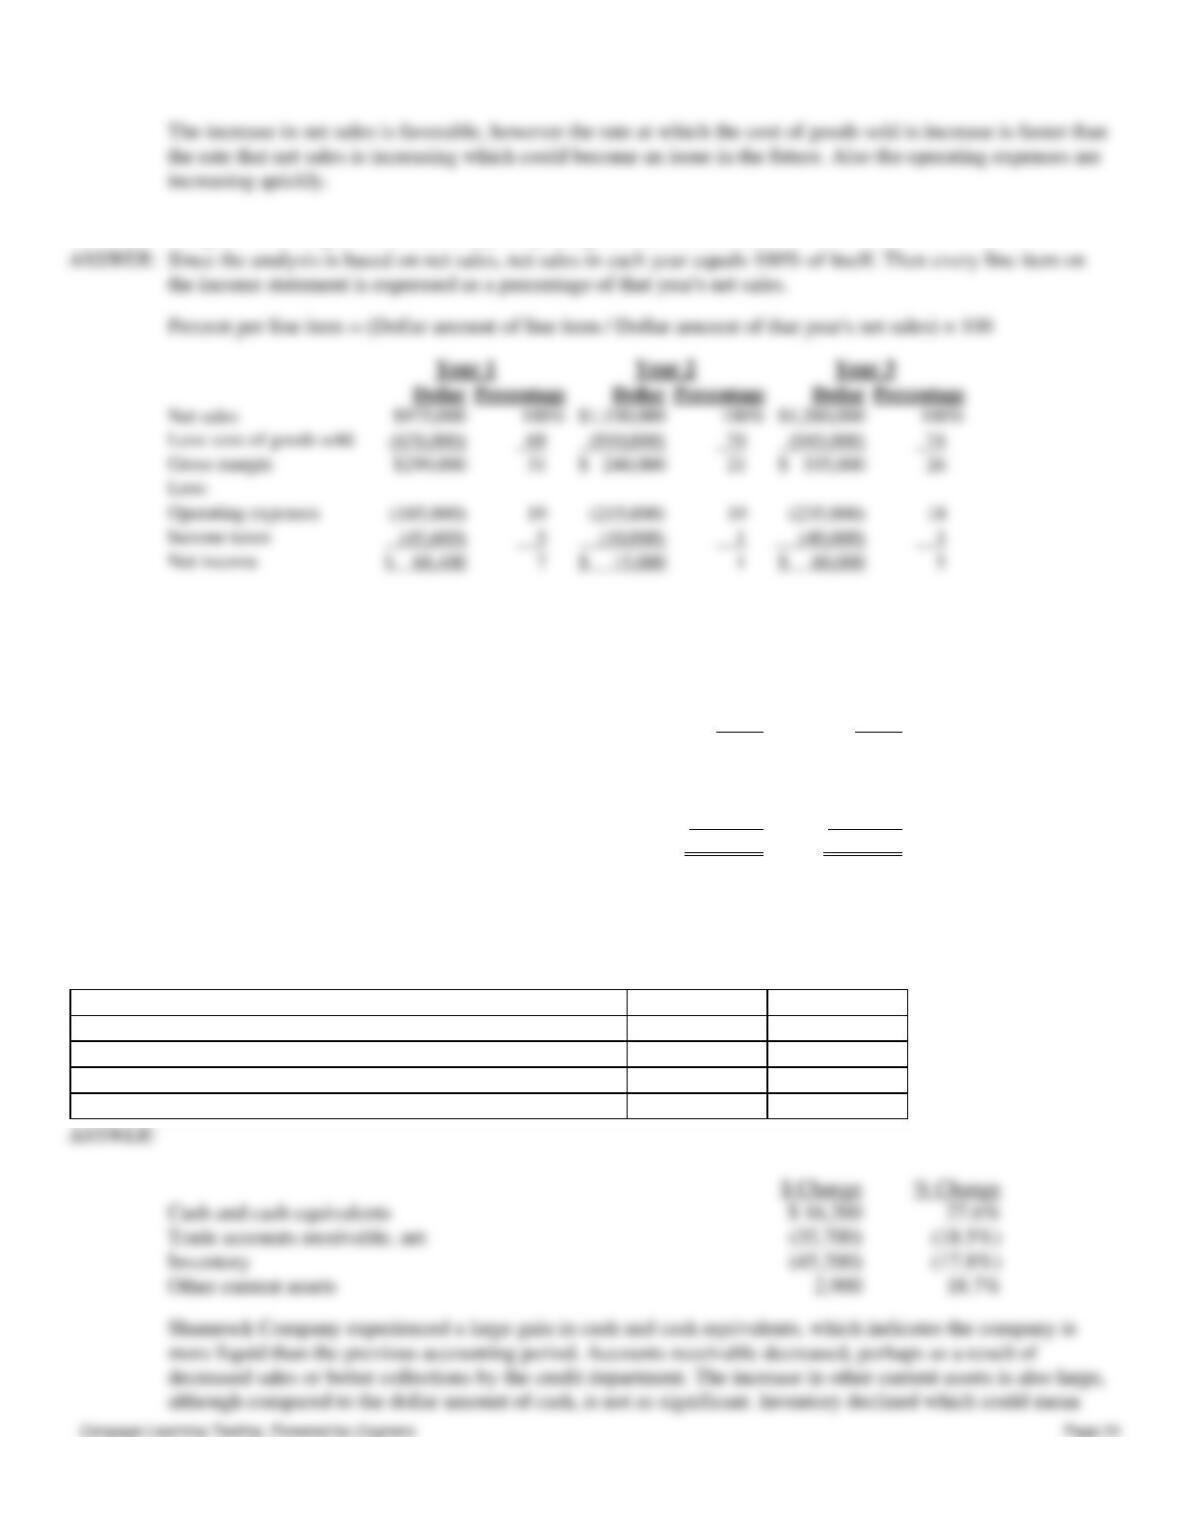
143. Refer to Figure 16–6. Prepare a vertical analysis by using net sales as the base.
Figure 16–3.
The current asset section of the balance sheets of the Shamrock Company as of June 30, 20X1 and 20X0 is presented
below.
20X1
20X0
Cash and cash equivalents
$ 75,000
$ 58,800
Trade accounts receivable, net
157,500
193,200
Inventory
208,200
253,400
Other current assets
18,400
15,500
Total current assets
$459,100
$520,900
Total assets
$2,650,000
$3,430,000
144. Refer to Figure 16–3. In the spaces provided below, complete a horizontal analysis of the current asset section of
Shamrock Company’s balance sheet for 20X1. Your answers for “% Change” should be rounded to one decimal place,
e.g., 10.3%. Provide a short evaluation of this analysis.
$ Change
% Change
Cash and cash equivalents
$ 16,200
Trade accounts receivable, net
(18.5%)
(17.8%)
Other current assets
2,900
increasing quickly.
Chapter 16 – Financial Statement Analysis
145. Boyle Corporation had the following comparative current assets and current liabilities:
Dec. 31, Year 2
Dec. 31, Year 1
Current assets
Cash
$ 20,000
$ 30,000
Short-term investments
40,000
10,000
Accounts receivable
55,000
95,000
Inventory
110,000
90,000
Prepaid expenses
35,000
20,000
Total current assets
$260,000
$245,000
Current liabilities
Accounts payable
$140,000
$110,000
Salaries payable
40,000
30,000
Income tax payable
20,000
15,000
Total current liabilities
$200,000
$155,000
During Year 2, credit sales and cost of goods sold were $600,000 and $350,000, respectively.
Required: Compute the following liquidity measures for Year 2:
A.
Current ratio.
B.
Acid-test ratio.
C.
Receivables turnover.
D.
Inventory turnover.
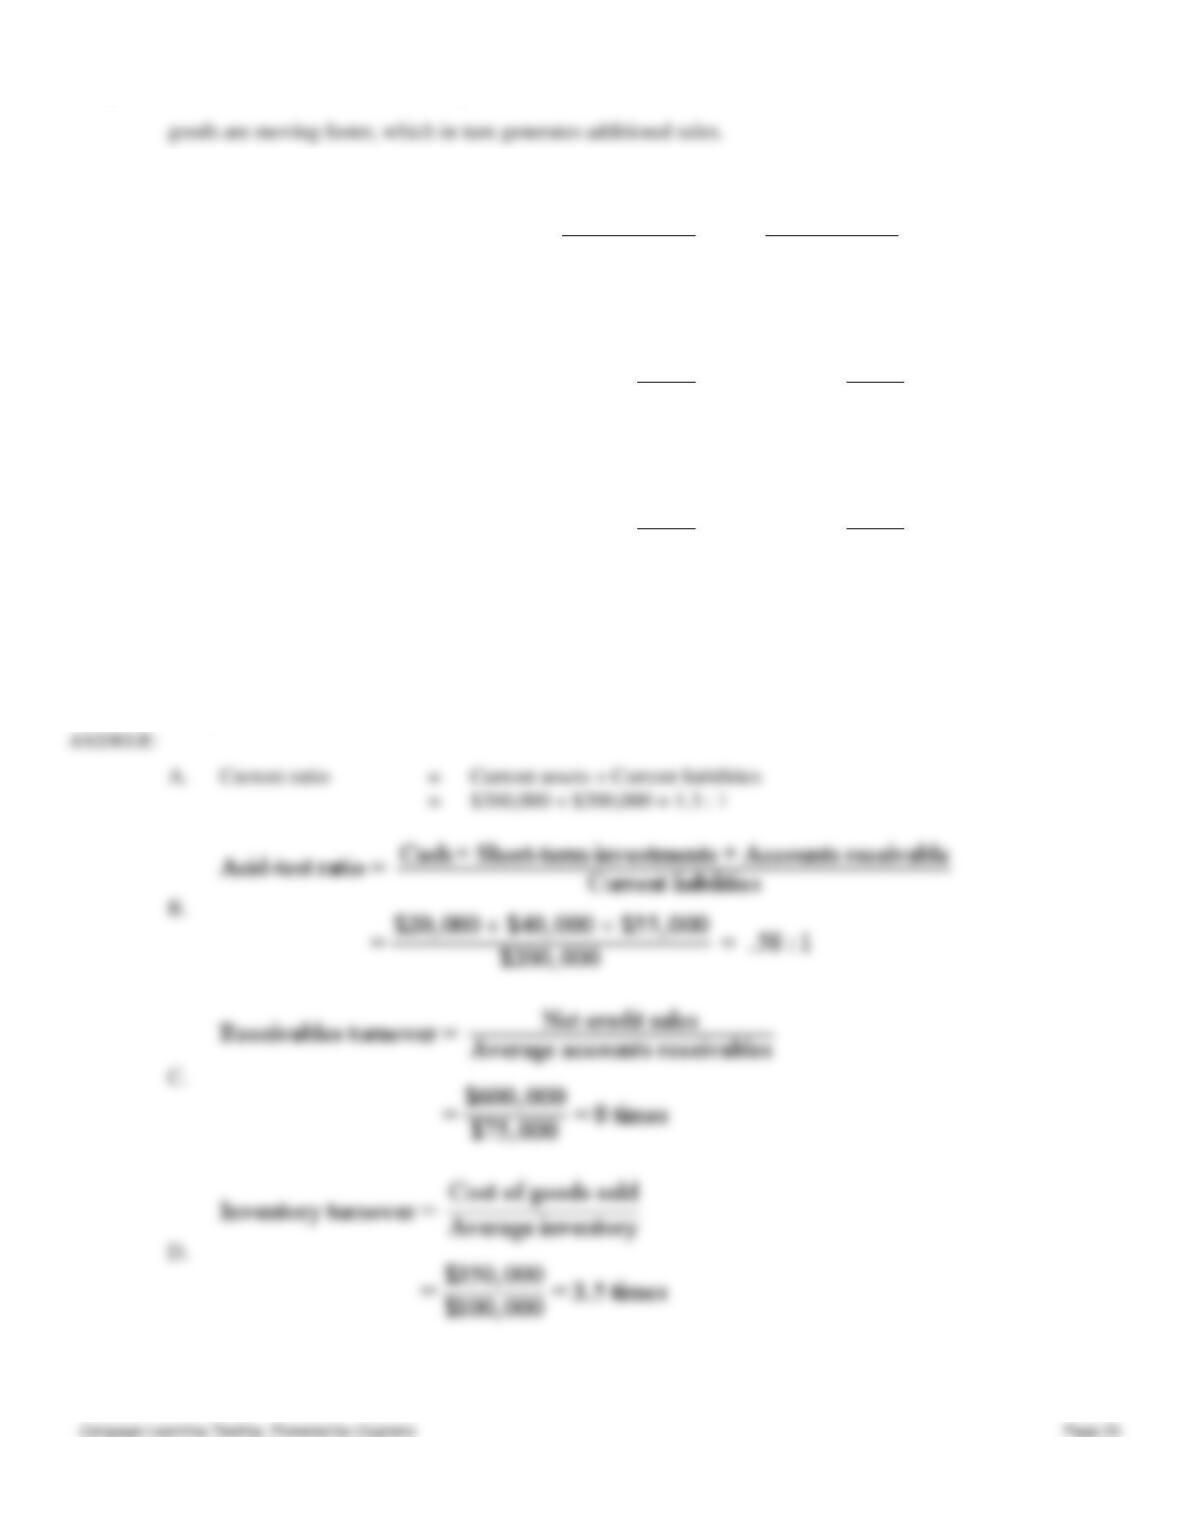
A.
Current ratio
=
Current assets ÷ Current liabilities
=
$260,000 ÷ $200,000 = 1.3 : 1
146. Assuming a starting point of a 1:1 relationship, state the effect of the following transactions on the current ratio. Use
goods are moving faster, which in turn generates additional sales.
Chapter 16 – Financial Statement Analysis
increase, decrease, or no effect for your answer.
A.
Collection of an accounts receivable.
B.
Declaration of cash dividends.
C.
Additional stock is sold for cash.
D.
Short-term investments are purchased for cash.
E.
Equipment is purchased for cash.
F.
Inventory purchases are paid for cash.
147. Presented below are selected data from the financial statements of Harper Company for the last three years.
Year 3
Year 2
Year 1
Total assets
$1,205,000
$952,000
$945,000
Cost of goods sold
360,000
420,000
440,000
Inventory
56,000
64,000
53,000
Net income
65,000
25,000
16,000
A.
Calculate Harper’s inventory turnover ratio for years 2 and 3.
B.
Calculate the number of days in inventory at December 31, year 3 and year 2. Assume
365 days in a year.
C.
Explain the implications of your calculations with respect to inventory management.
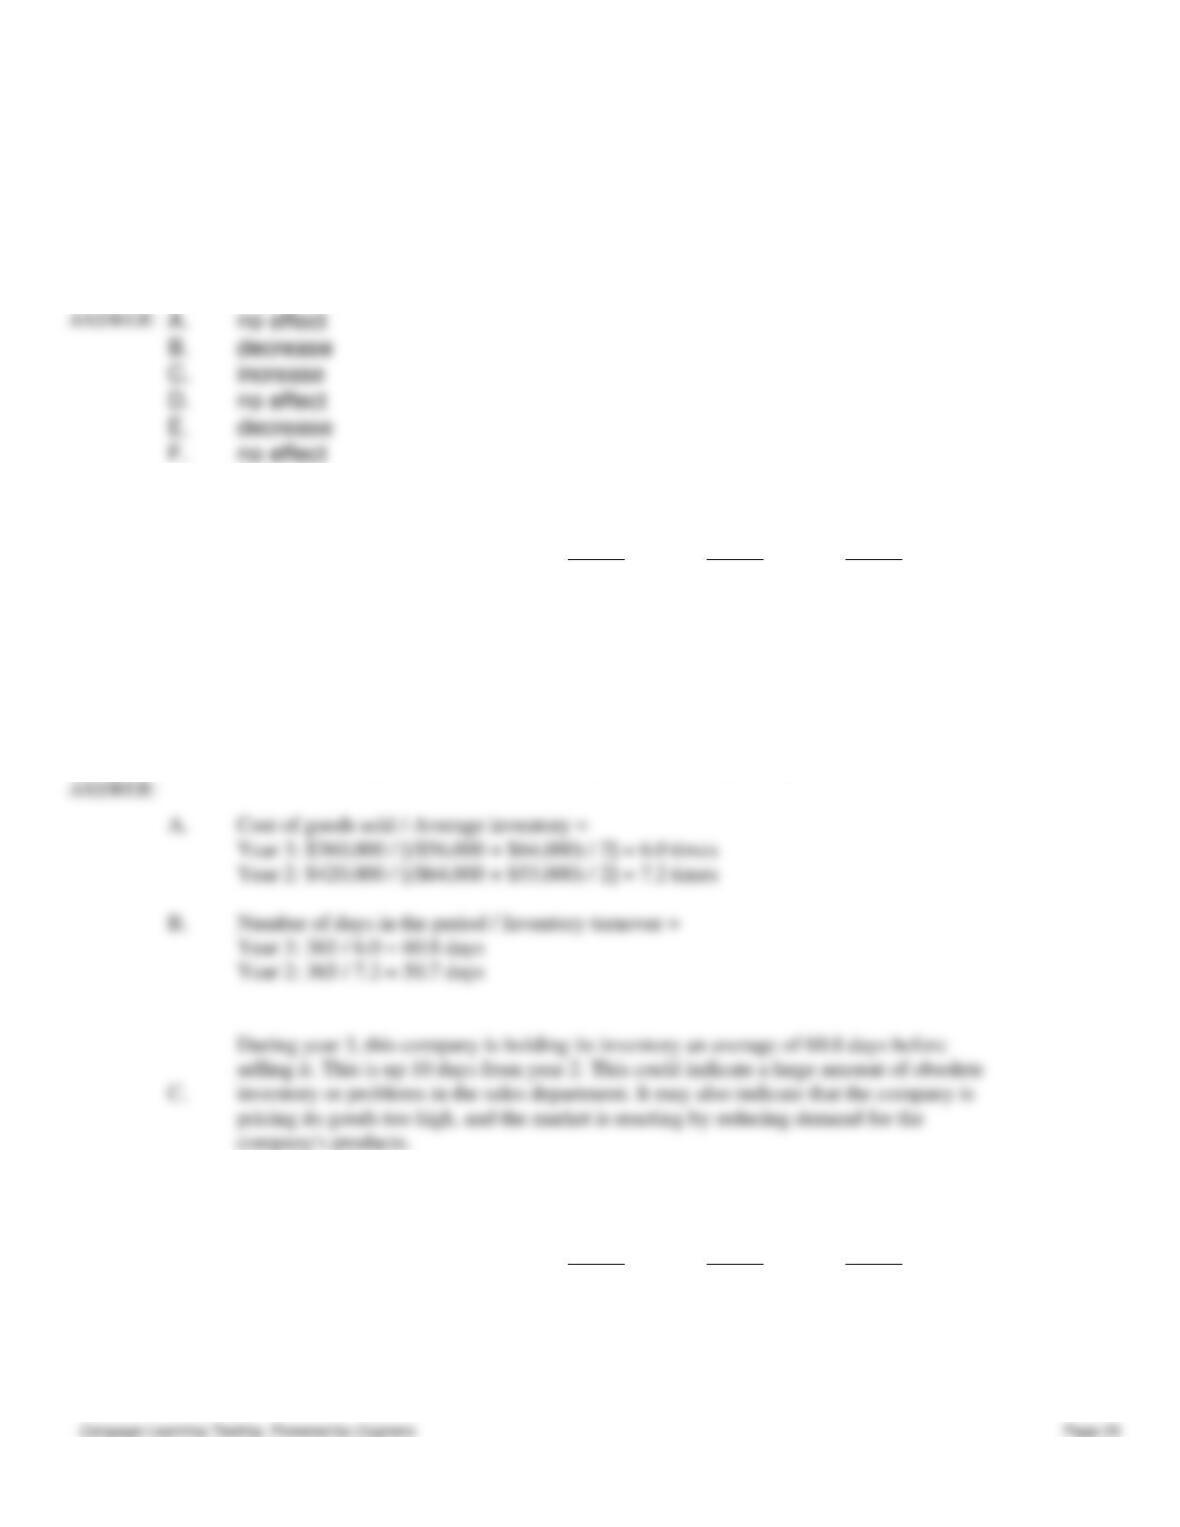
A.
Cost of goods sold / Average inventory =
Year 3: $360,000 / [($56,000 + $64,000) / 2] = 6.0 times
Year 2: $420,000 / [($64,000 + $53,000) / 2] = 7.2 times
B.
Number of days in the period / Inventory turnover =
Year 3: 365 / 6.0 = 60.8 days
pricing its goods too high, and the market is reacting by reducing demand for the
148. Presented below are selected data from the financial statements of eMonstore.com for the last three years.
Year 3
Year 2
Year 1
Total assets
$650,000
$821,000
$800,000
Net credit sales
800,000
650,000
720,000
Accounts receivable
85,000
79,000
74,000
A.
Calculate eMonstore.com’s accounts receivable turnover ratio for years 2 and 3.
B.
Calculate the number of days the average balance of receivables is outstanding before
Chapter 16 – Financial Statement Analysis
being converted into cash (turnover in days) for years 2 and 3.
C.
What problems do you see with the company’s credit policy if the terms are net 30 days?
Explain.
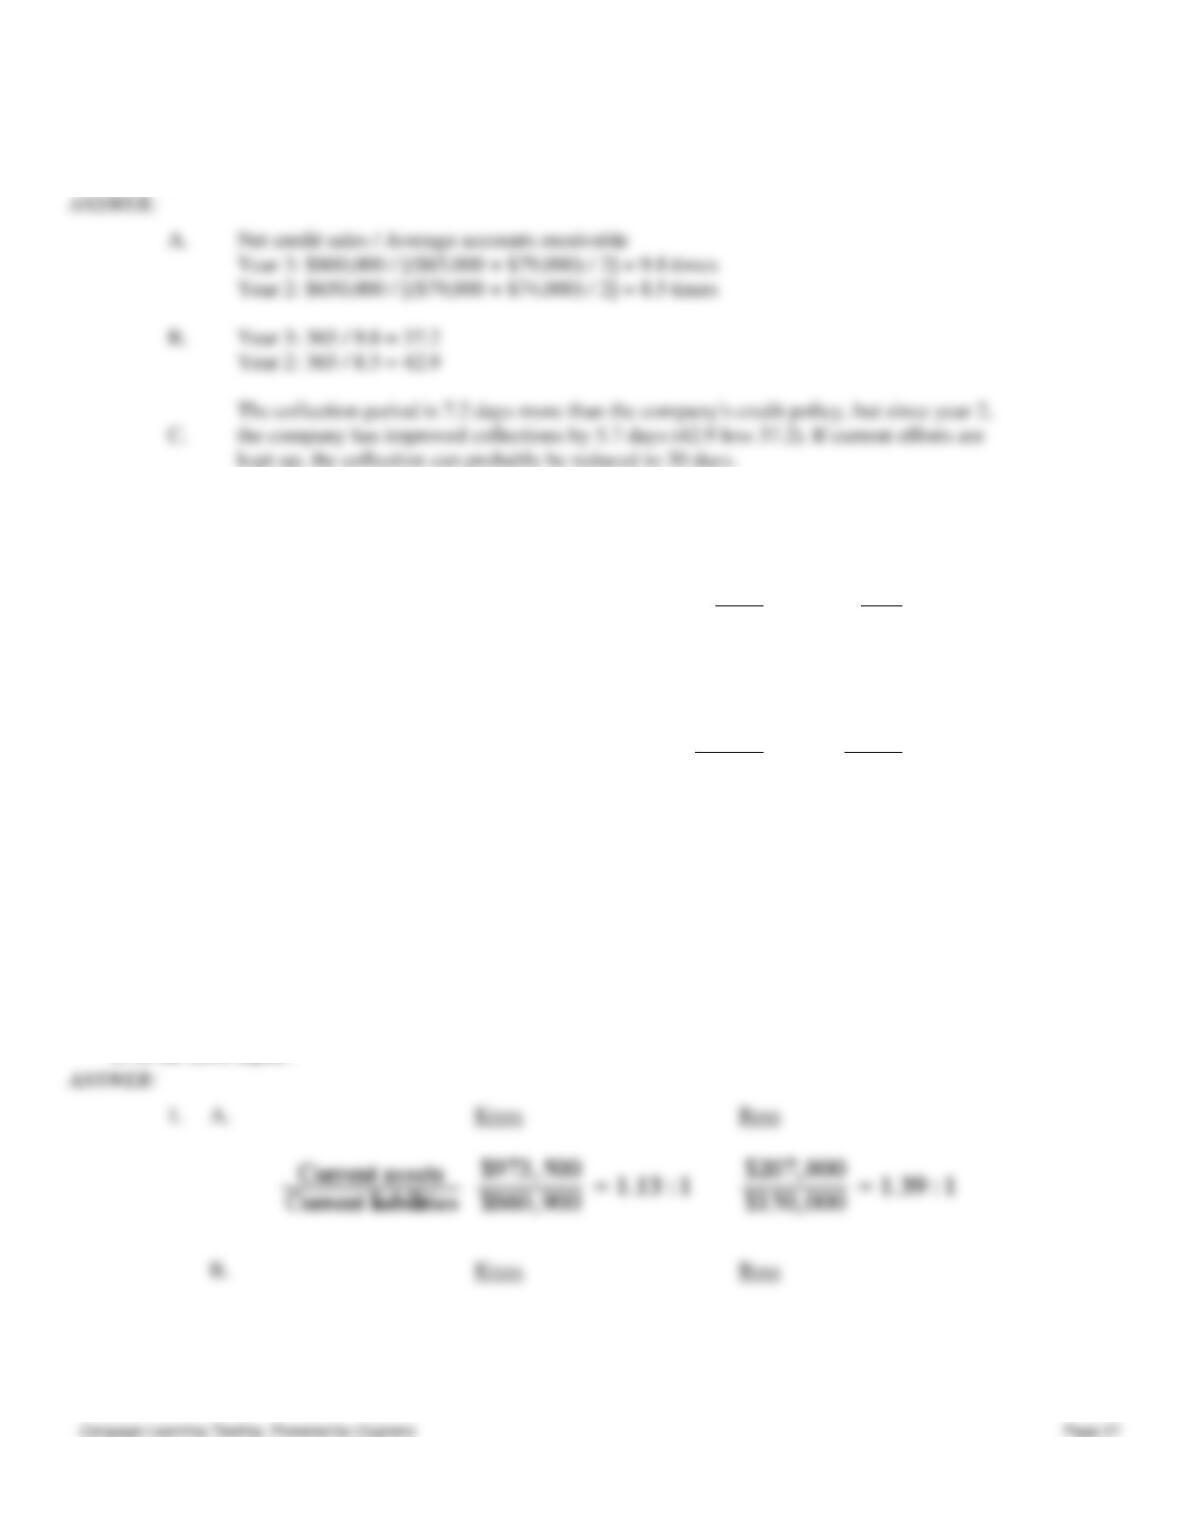
A.
Net credit sales / Average accounts receivable
Year 3: $800,000 / [($85,000 + $79,000) / 2] = 9.8 times
Year 2: $650,000 / [($79,000 + $74,000) / 2] = 8.5 times
B.
Year 3: 365 / 9.8 = 37.2
Year 2: 365 / 8.5 = 42.9
kept up, the collection can probably be reduced to 30 days.
149. The following information is summarized from the balance sheets of Kress Inc. and Ross Corp. at December 31,
20XX. Neither company has inventory.
Kress
Ross
Current Assets:
Cash and cash equivalents
$ 340,800
$100,200
Short-term investments
12,000
7,600
Accounts receivable, net
377,000
42,000
Notes receivable, net
36,300
18,000
Prepaid assets
207,400
40,000
Total current assets
$ 973,500
$207,800
Current liabilities
$ 860,900
$150,000
Other liabilities
5,000,400
300,500
Stockholders’ equity
2,400,300
800,700
1.
Using the information provided above, compute the following for each company at
December 31, 20XX:
A.
Current Ratio
B.
Quick Ratio
2.
Comment briefly on the liquidity of each of these two companies. Which company appears
to be the most liquid?
A.
Kress
Ross
B.
Kress
Ross
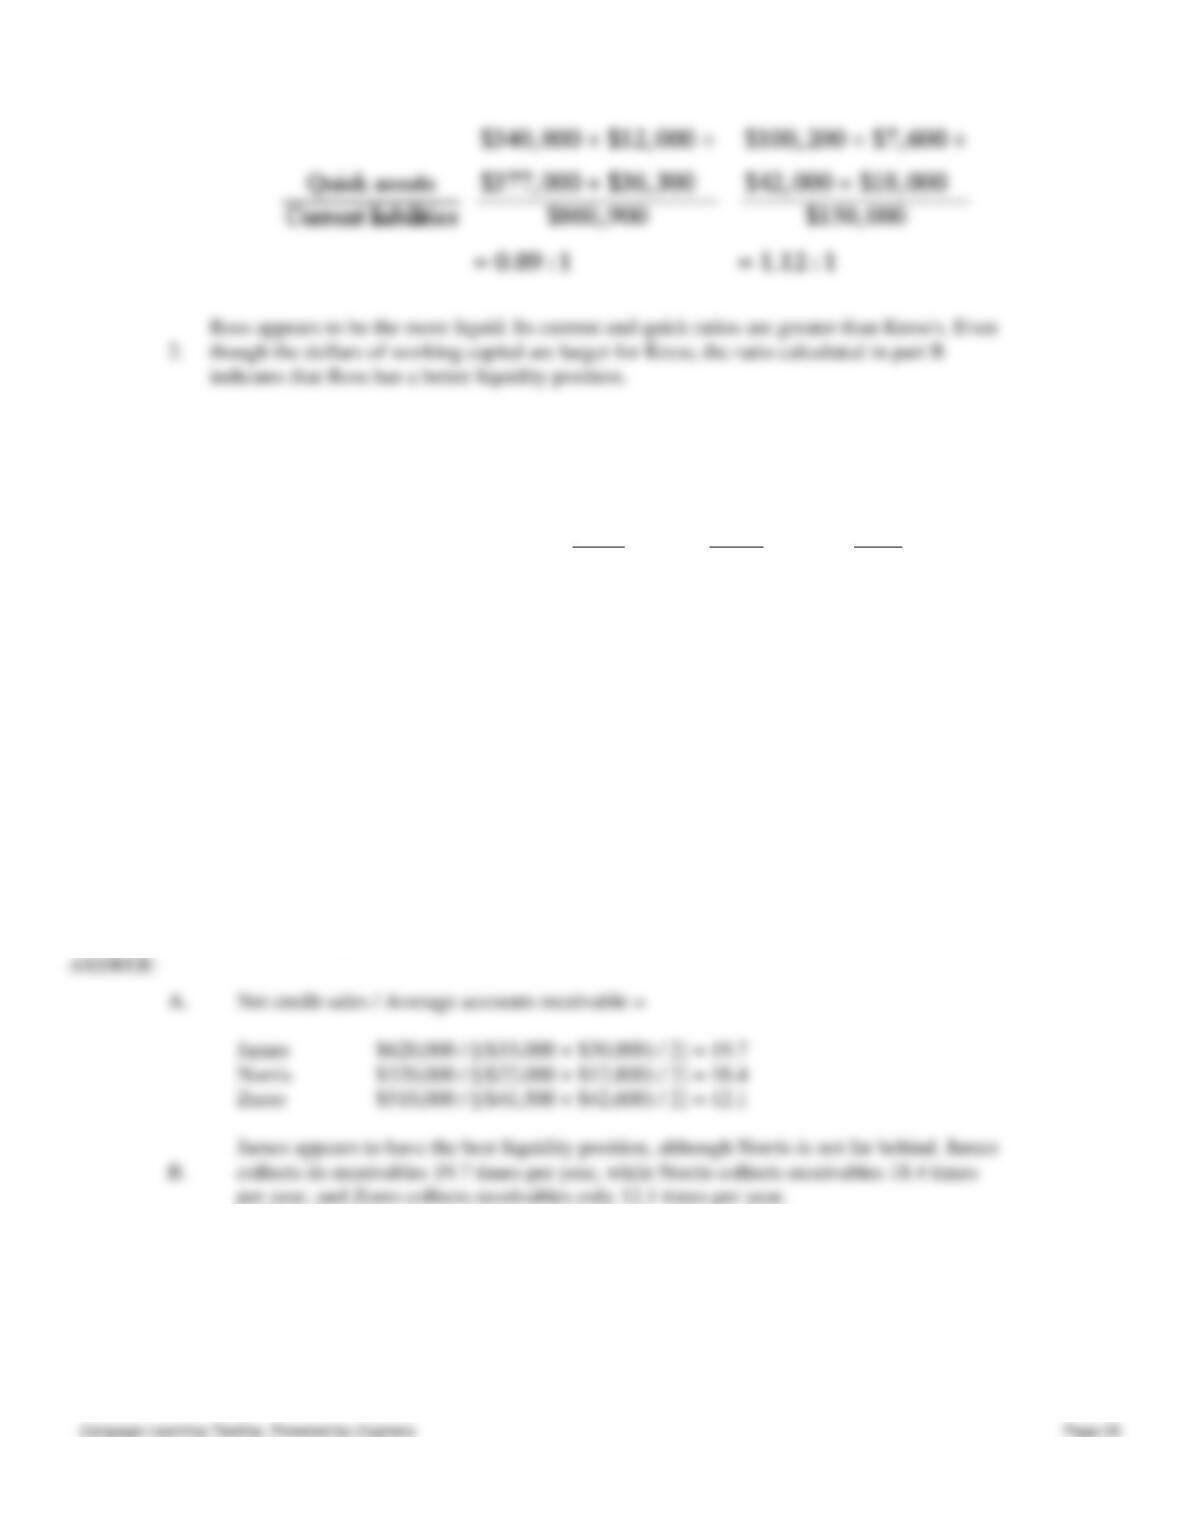
Chapter 16 – Financial Statement Analysis
indicates that Ross has a better liquidity position.
Figure 16–5.
The following information was obtained from the 20X1 and 20X0 financial statements of James Company, Norris
Corporation, and Zorro Company:
(In millions)
James
Norris
Zorro
Accounts receivable
12/31/X1
$ 33,000
$ 22,000
$ 41,500
12/31/X0
30,000
12,800
42,600
Inventory
12/31/X1
$ 2,600
$ 12,600
$ 54,200
12/31/X0
23,900
32,800
44,000
Net sales (Credit)
20X1
$620,000
$320,000
$510,000
20X0
610,000
310,000
760,000
Cost of goods sold
20X1
$211,000
$406,000
$311,000
20X0
156,000
200,000
310,000
150. Refer to Figure 16–5. Compare the three companies and answer the following:
A.
Compute the accounts receivable turnover ratio for each company for 20X1.
B.
Which company appears to have the best liquidity position based solely on the accounts
receivable turnover? Explain.
A.
Net credit sales / Average accounts receivable =
James
$620,000 / [($33,000 + $30,000) / 2] = 19.7
Norris
$320,000 / [($22,000 + $12,800) / 2] = 18.4
Zorro
$510,000 / [($41,500 + $42,600) / 2] = 12.1
per year, and Zorro collects receivables only 12.1 times per year.
151. Refer to Figure 16–5. Compare the three companies and answer the following:
A.
Compute the number of days inventory is held before being sold for each company for
20X1.
B.
Which company appears to have the best liquidity position based solely on the inventory
analysis? Explain.
Chapter 16 – Financial Statement Analysis
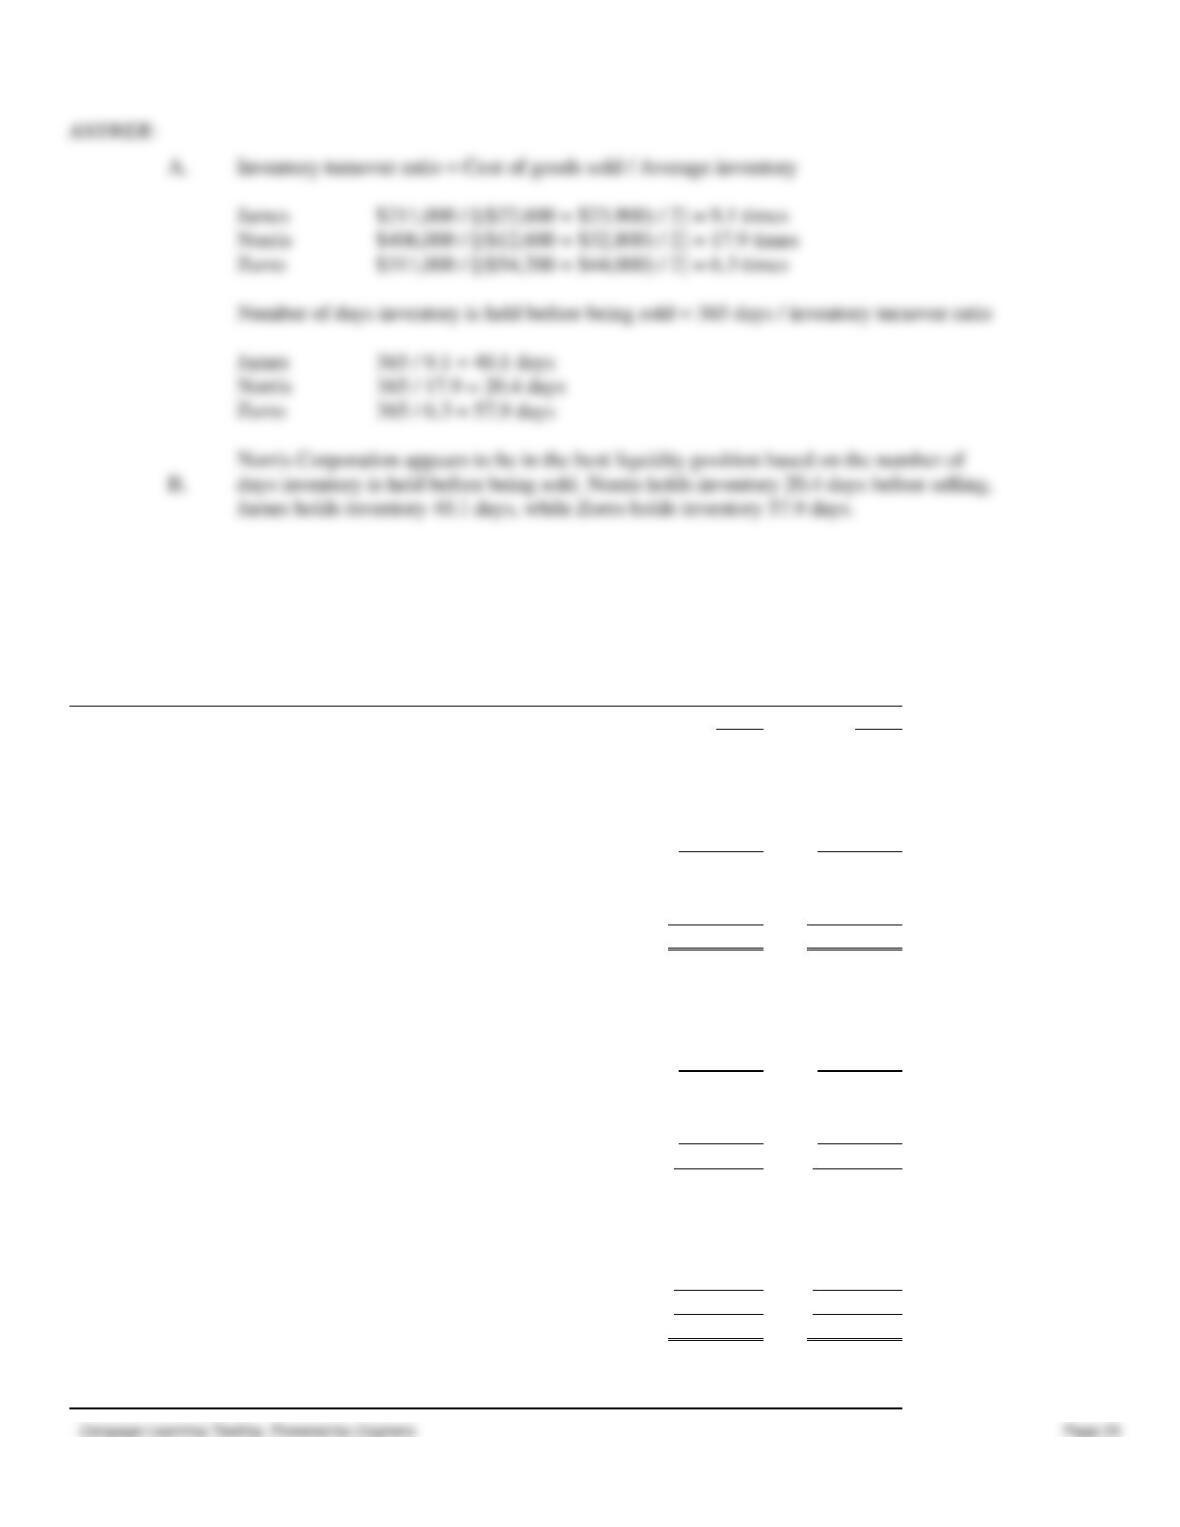
Inventory turnover ratio = Cost of goods sold / Average inventory
$211,000 / [($22,600 + $23,900) / 2] = 9.1 times
$406,000 / [($12,600 + $32,800) / 2] = 17.9 times
$311,000 / [($54,200 + $44,000) / 2] = 6.3 times
Number of days inventory is held before being sold = 365 days / inventory turnover ratio
Figure 16–2.
Financial statements for Grange Company appear below:
Grange Company
Comparative Balance Sheet
December 31, 20X1 and 20X0
20X1
20X0
Current assets:
Cash and marketable securities
$ 180,000
$ 160,000
Accounts receivable, net
150,000
120,000
Inventory
100,000
100,000
Prepaid expenses
40,000
50,000
Total current assets
$ 470,000
$ 430,000
Noncurrent assets:
Plant & equipment, net
1,390,000
1,320,000
Total assets
$1,860,000
$1,750,000
Current liabilities:
Accounts payable
$ 130,000
$ 130,000
Accrued liabilities
60,000
80,000
Notes payable, short term
100,000
100,000
Total current liabilities
$ 290,000
$ 310,000
Noncurrent liabilities:
Bonds payable
270,000
300,000
Total liabilities
$ 560,000
$ 610,000
Stockholders’ equity:
Preferred stock, $5 par, 5%
$ 100,000
$ 100,000
Common stock, $5 par
220,000
220,000
Additional paid-in capital—common stock
190,000
190,000
Retained earnings
790,000
630,000
Total stockholders’ equity
1,300,000
1,140,000
Total liabilities & stockholders’ equity
$1,860,000
$1,750,000
Grange Company
Income Statement
Chapter 16 – Financial Statement Analysis
For the Year Ended December 31, 20X1
Sales (all on account)
$2,400,000
Cost of goods sold
1,680,000
Gross margin
$ 720,000
Operating expenses
280,000
Net operating income
$ 440,000
Interest expense
30,000
Net income before taxes
$ 410,000
Income taxes (30%)
123,000
Net income
$ 287,000
Dividends during 20X1 totaled $127,000, of which $5,000 were preferred dividends.
The market price of a share of common stock on December 31, 20X1, was $100.
152. Refer to Figure 16–2.
Required: Compute the following liquidity ratios for 20X1:
A.
current ratio
B.
quick ratio
C.
accounts receivable turnover ratio
D.
inventory turnover ratio
E.
inventory turnover in days
A.
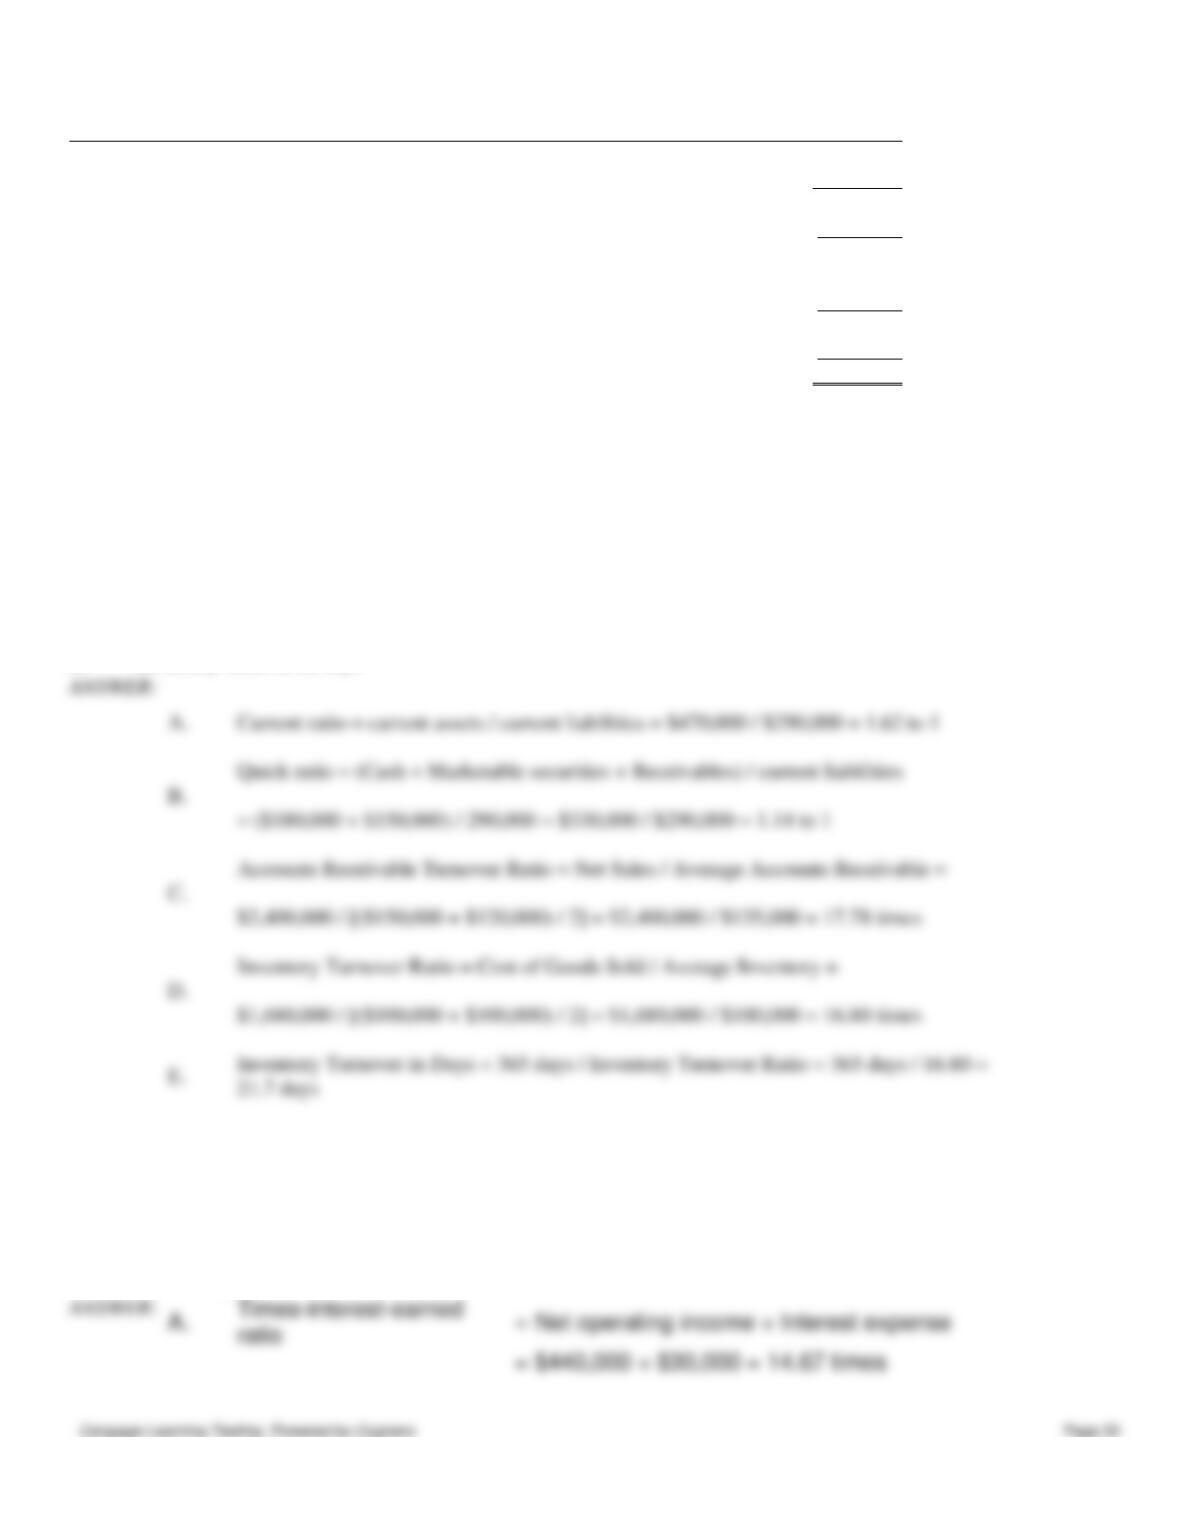
Current ratio = current assets / current liabilities = $470,000 / $290,000 = 1.62 to 1
Accounts Receivable Turnover Ratio = Net Sales / Average Accounts Receivable =
Inventory Turnover Ratio = Cost of Goods Sold / Average Inventory =
153. Refer to Figure 16–2.
Required: Compute the following leverage ratios for 20X1:
A.
times-interest-earned ratio
B.
debt ratio
C.
debt-to-equity ratio
Chapter 16 – Financial Statement Analysis
154. Refer to Figure 16–2.
Required: Compute the following profitability ratios for 20X1:
A.
Return on Sales
B.
Return on Total Assets
C.
Return on Common Stockholders’ Equity
D.
Earnings per share
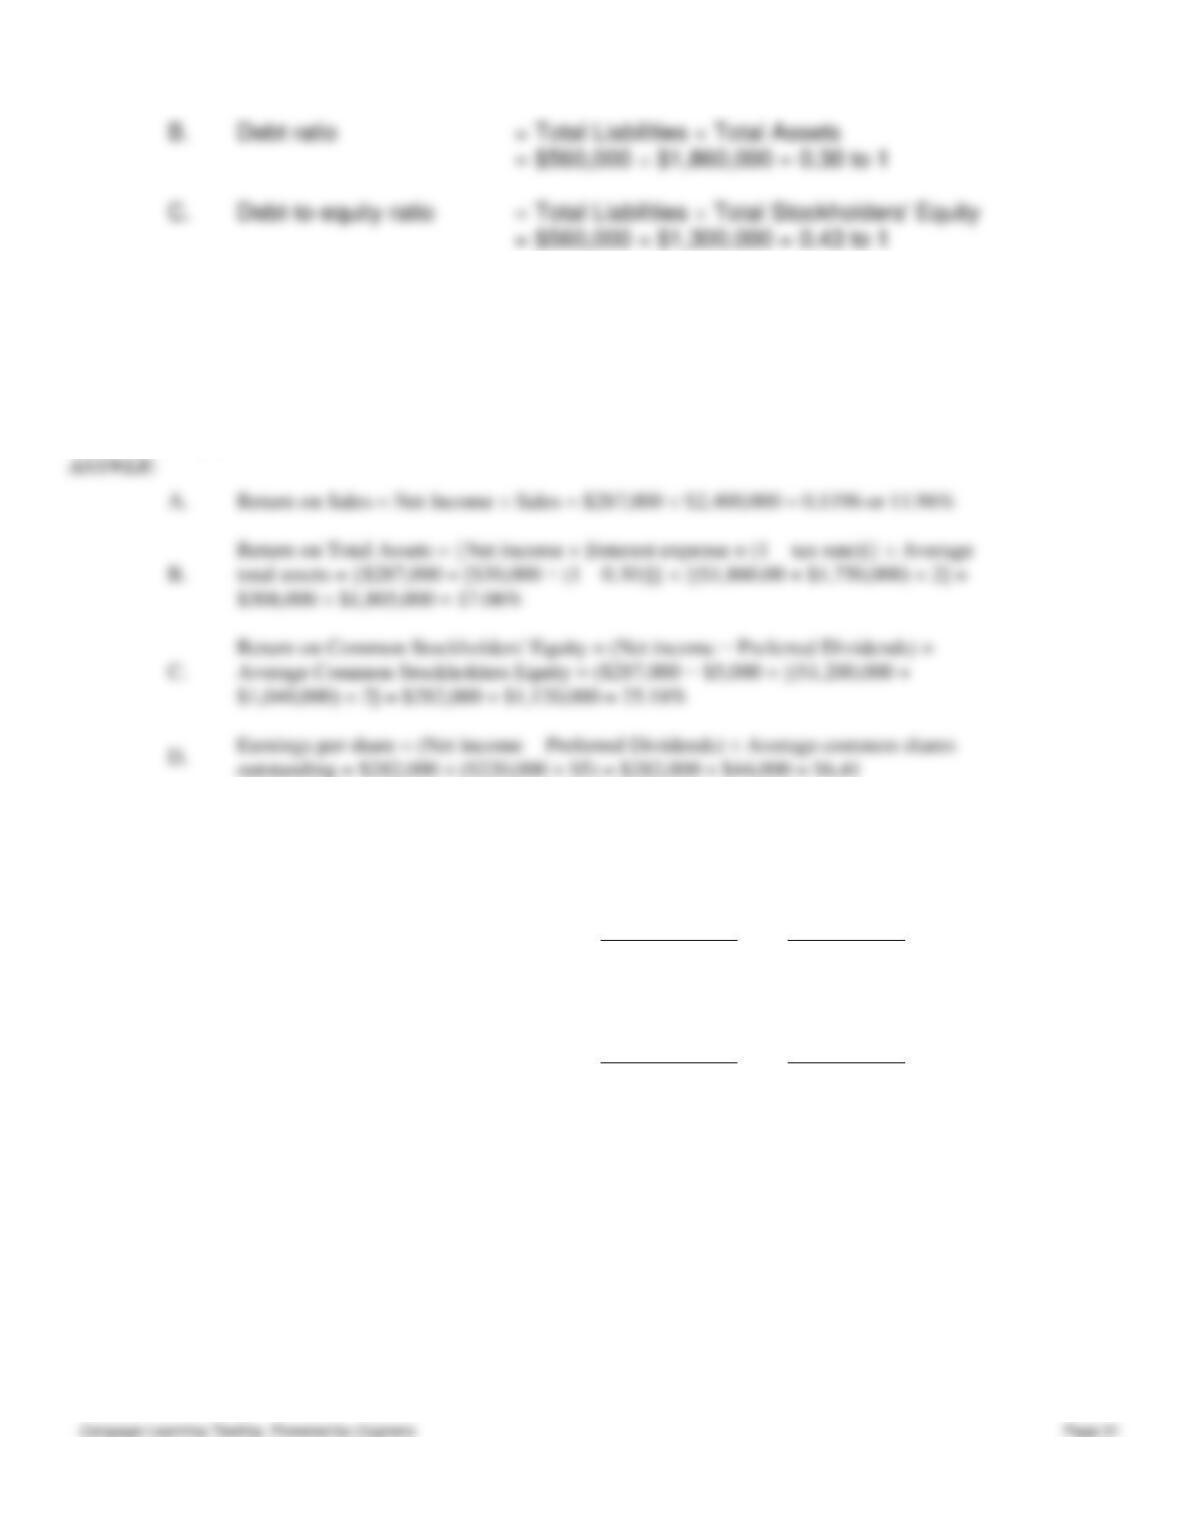
A.
Return on Sales = Net Income ÷ Sales = $287,000 ÷ $2,400,000 = 0.1196 or 11.96%
$308,000 ÷ $1,805,000 = 17.06%
$1,040,000) ÷ 2] = $282,000 ÷ $1,120,000 = 25.18%
outstanding = $282,000 ÷ ($220,000 ÷ $5) = $282,000 ÷ $44,000 = $6.41
155. Smith Inc. is a wholesaler of snow skiing gear. During the current year, Smith expanded its retail business by adding
over 50 shops. The following information is obtained from the comparative financial statements included in the company’s
current annual report.
Dec. 31, current
Dec. 31, prior
Total liabilities
$26,000,000
$18,000,000
Total stockholders’ equity
34,000,000
38,000,000
FOR THE FISCAL YEARS ENDED
Dec. 31, current
Dec. 31, prior
Depreciation expense
$ 2,000,000
$ 6,000,000
Interest expense
3,400,000
3,200,000
Income tax expense
12,600,000
18,100,000
Net income
6,000,000
15,000,000
Net cash provided by operations
41,000,000
(400,000)
Total dividends paid
2,000,000
12,000,000
Cash used to purchase plant assets
32,000,000
18,000,000
Payments on long-term debt
1,600,000
1,800,000
1.
Using the information provided above, compute the following for both years:
A.
Debt-to-equity ratio (at each year-end)
B.
Times-interest-earned ratio
2.
Briefly explain the implications of your findings with respect to these two leverage ratios.
Chapter 16 – Financial Statement Analysis
156. The income statement for Ray Company for last year ended December 31 appears below.
Sales
$610,000
Cost of goods sold
380,000
Gross margin
$230,000
Expenses
170,000*
Net income
$ 60,000
*Includes $30,000 of interest expense and $18,000 of income tax expense.
Additional information:
1.
Common stock outstanding during the yeartotaled 45,000 shares.
2.
The market price of Ray’s stock was $15 at the end of the year.
3.
Cash dividends of $30,000 were paid, $6,000 of which were paid to preferred stockholders.
Required: Compute the following ratios for the year:
A.
earnings per share.
B.
price-earnings.
C.
times-interest-earned ratio.
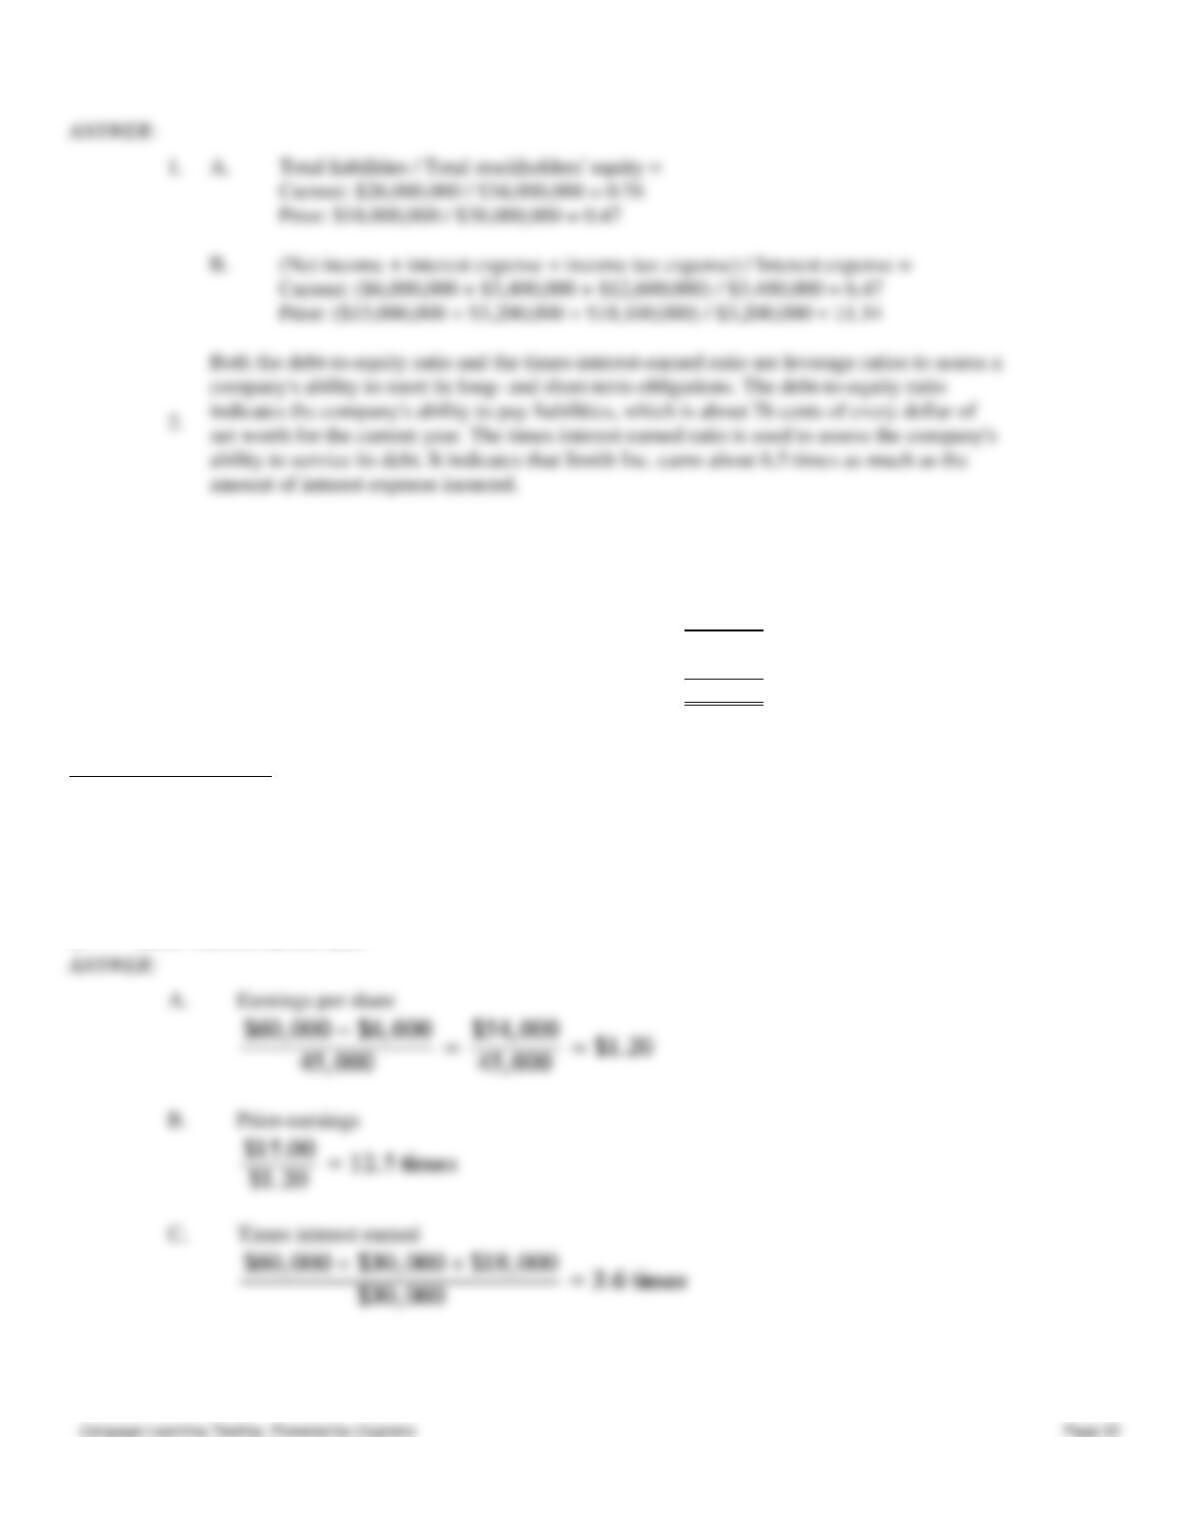
A.
Earnings per share
B.
Price-earnings
C.
Times interest earned
157. The following information is available from the balance sheets at the end of 20X1 and 20X0 for Shelley Company:
1.
A.
Total liabilities / Total stockholders’ equity =
Current: $26,000,000 / $34,000,000 = 0.76
Prior: $18,000,000 / $38,000,000 = 0.47
B.
(Net income + interest expense + income tax expense) / Interest expense =
Current: ($6,000,000 + $3,400,000 + $12,600,000) / $3,400,000 = 6.47
Prior: ($15,000,000 + $3,200,000 + $18,100,000) / $3,200,000 = 11.34