
Test B IVB-1
Business Statistics: Part IV Name_______________
Models for Decision Making – Test B
Chapter 14: Interpret regression output.
1. Data were collected for a sample of 12 pharmacists to determine if years of
experience and salary are related. Based on the results below, the standard error of
the slope for this estimated regression equation is
Regression Analysis: Salary versus Years Experience
The regression equation is: Salary = 37.2 + 1.49 Years Experience
Predictor Coef SE Coef T P
Constant 37.164 3.381
Years Experience 1.4882 0.2149
S = 5.58485 R-Sq = 82.8%
A. 3.381
B. 0.2149
C. 5.58485
D. 82.8
E. 1.4882
Chapter 14: Interpret regression output.
2. Data were collected for a sample of 12 pharmacists to determine if years of
experience and salary are related. Based on the results below, the calculated t-
statistic to test whether the regression slope is significant is
Regression Analysis: Salary versus Years Experience
The regression equation is: Salary = 37.2 + 1.49 Years Experience
Predictor Coef SE Coef T P
Constant 37.164 3.381
Years Experience 1.4882 0.2149
S = 5.58485 R-Sq = 82.8%
A. 10.99
B. 47.97
C. 31.2
D. 6.93
E. 5.58485

IVB-2 Part IV: Models for Decision Making
Chapter 14: Interpret regression results.
3. Data were collected for a sample of 12 pharmacists to determine if years of
experience and salary are related. A regression was run with the dependent variable
Salary (thousands of dollars) and independent variable Experience (years). Suppose
the P-value associated with the calculated t-statistic is < .001. At the .05 level of
significance we
A. reject the null hypothesis.
B. do not reject the null hypothesis.
C. conclude that years of experience is significant in explaining pharmacists’ salary.
D. Both A and C.
E. Both B and C.
Chapter 14: Interpret regression output.
4. Data were collected for a sample of 12 pharmacists to determine if years of
experience and salary are related. Based on the output below, how much of the
variability in pharmacists’ salary is accounted for by years of experience?
Regression Analysis: Salary versus Years Experience
The regression equation is: Salary = 37.2 + 1.49 Years Experience
Predictor Coef SE Coef T P
Constant 37.164 3.381
Years Experience 1.4882 0.2149
S = 5.58485 R-Sq = 82.8%
A. 82.8 %
B. 47.97 %
C. 5.58485 thousand dollars
D. 10.99 %
E. 98.9 %
Test B IVB-3
Chapter 14: Interpret confidence and prediction intervals.
5. Using this regression equation: Salary = 37.2 + 1.49 Years’ Experience to predict
salary for pharmacists with 10 years of experience gives the following results. Which
of the following is true?
Fit SE Fit 95% CI 95% PI
52.05 1.81 (48.01, 56.08) (38.96, 65.13)
A. 95% of pharmacists with 10 years of experience earn between $38,960 and
$65,130.
B. 95% of pharmacists with 10 years of experience earn between $48,010 and
$56,080.
C. We are 95% confident that a particular pharmacist who has 10 years of experience
earns between $38,960 and $65,130.
D. We are 95% confident that a particular pharmacist who has 10 years of experience
earns between $48,010 and $56,080
E. 95% of pharmacists with 10 years experience on average earn between $48,010
and $56,080.
Chapter 14: Determine when a linear model is appropriate for data.
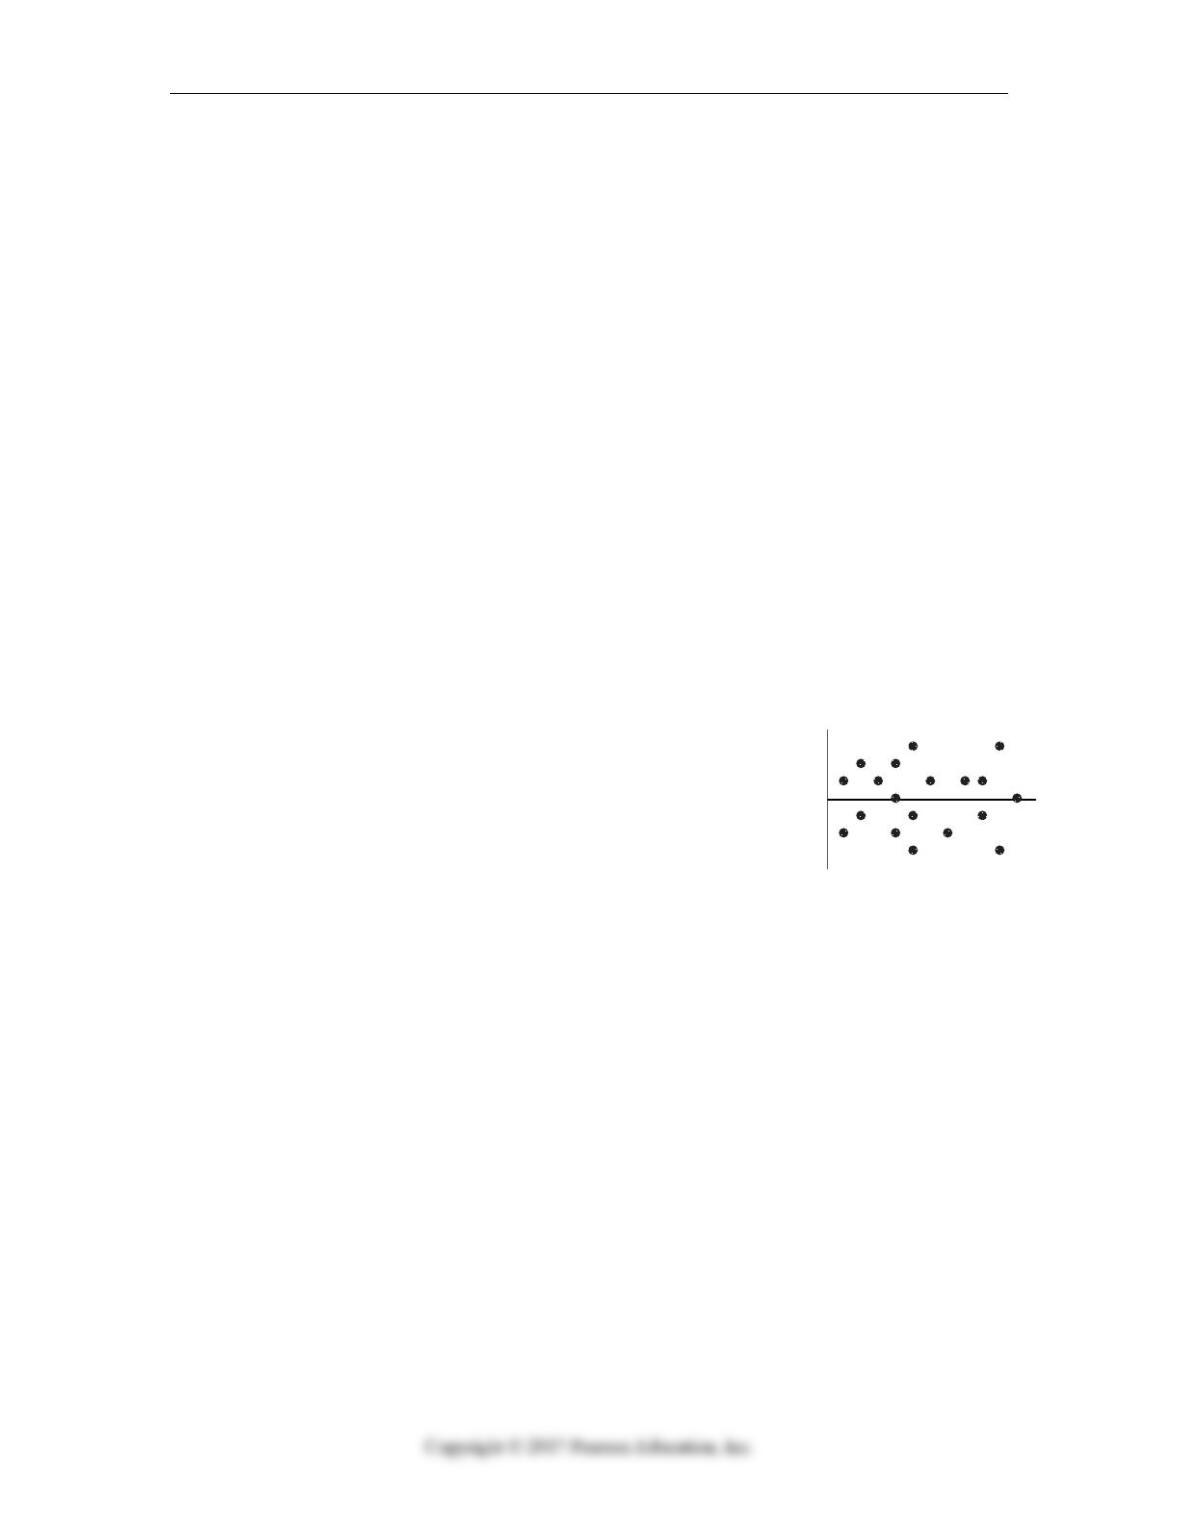
6. A least squares estimated regression line has been fitted to a set of data and the
resulting residual plot is shown. Which is true?
A. The linear model is appropriate.
B. The linear model is poor because some residuals are large.
C. The linear model is poor because the correlation is near 0.
D. A curved model would be better.
E. A transformation of the data is required.
Chapter 14: Interpret regression output.
7. According to the results below, what is the correlation between stock price and EPS?
Regression Analysis: Stock Price versus EPS
The regression equation is: Stock Price = – 0.49 + 14.8 EPS
Predictor Coef SE Coef T P
Constant -0.486 4.032 -0.12 0.906
EPS 14.8129 0.9437 15.70 0.000
S = 7.63235 R-Sq = 95.0%
A. -0.975
B. 0.906
C. 0.950
D. 0.975
E. Cannot be determined from the information given.
IVB-4 Part IV: Models for Decision Making
Chapter 14: Test for association.
8. According to the output below, which of the following statement is true about the
correlation between stock price and earnings per share (EPS)?
The regression equation is: Stock Price = – 0.49 + 14.8 EPS
Predictor Coef SE Coef T P
Constant -0.486 4.032 -0.12 0.906
EPS 14.8129 0.9437 15.70 0.000
S = 7.63235 R-Sq = 95.0%
A. The correlation is negative.
B. The correlation is not significantly different from zero.
C. The correlation is positive and significantly different from zero.
D. The correlation is positive but not significantly different from zero.
E. Cannot be determined from the information given.
Chapter 14: Examine residuals to check regression conditions/assumptions.
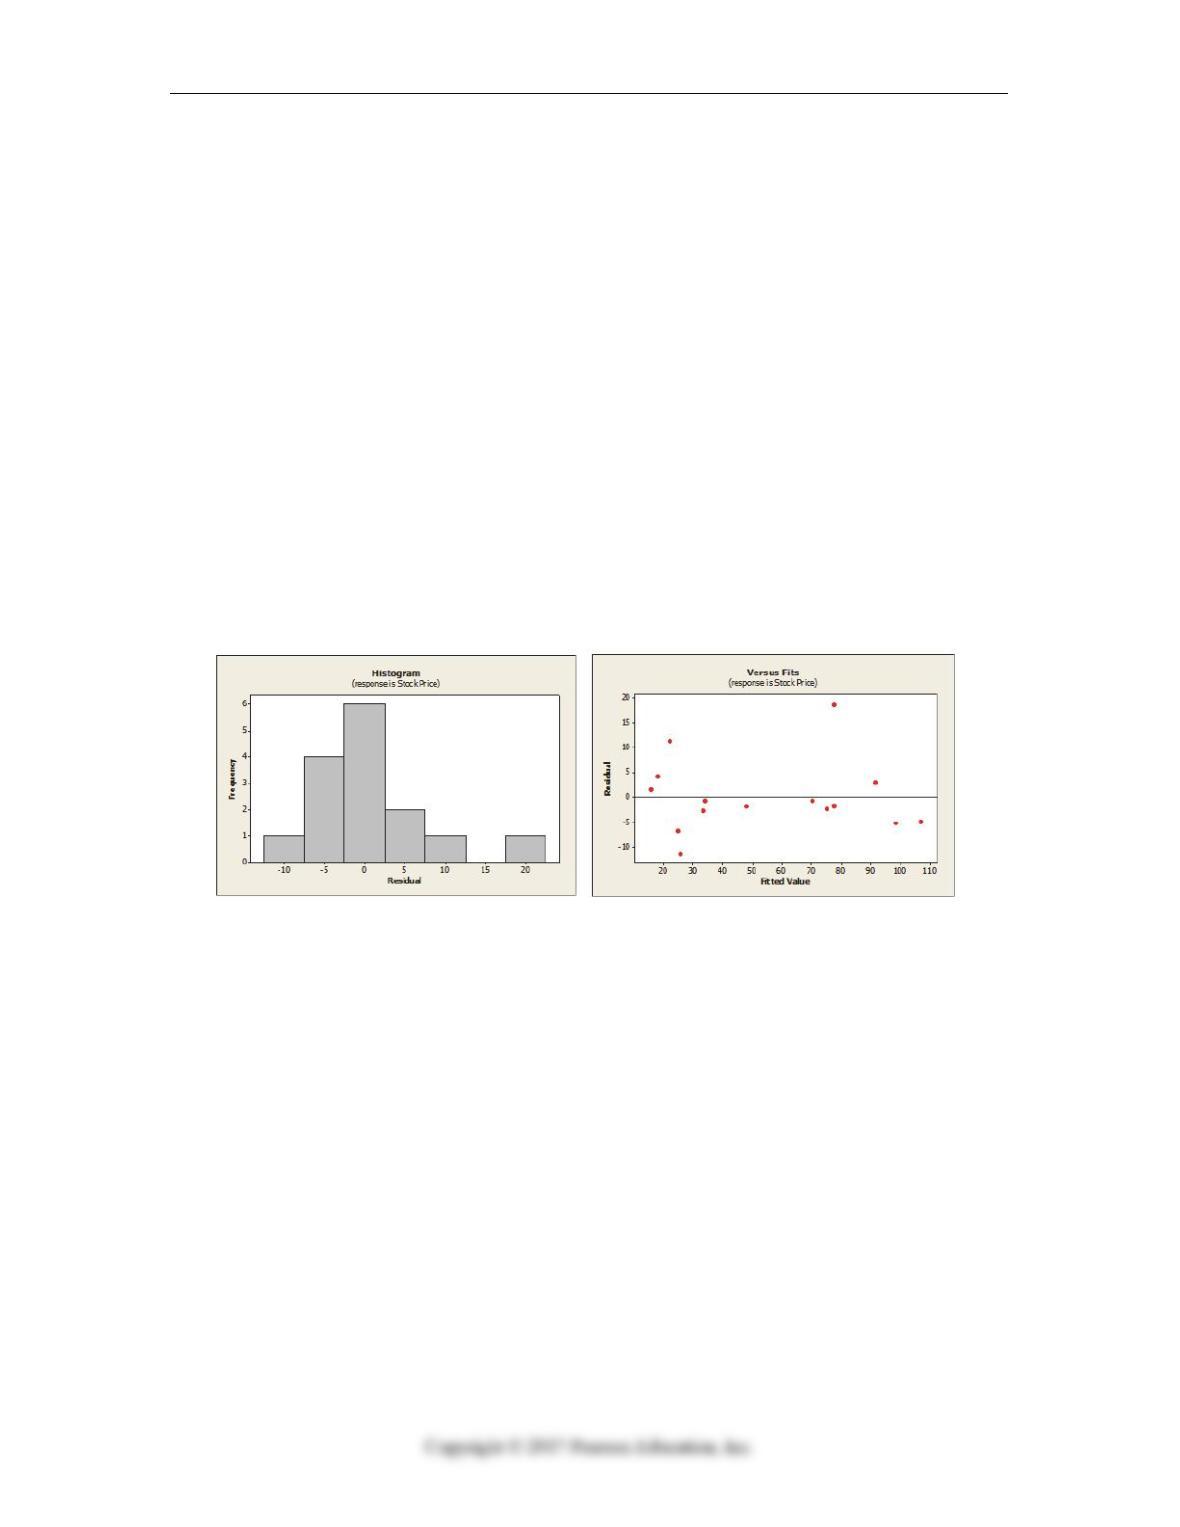
9. From the plots of residuals shown below, which assumption appears to be violated?
A. Equal Variance
B. Linearity
C. Normality
D. Independence
E. None; all appear to be satisfied.
Test B IVB-5
Chapter 14: Determine when a linear model is appropriate for data.
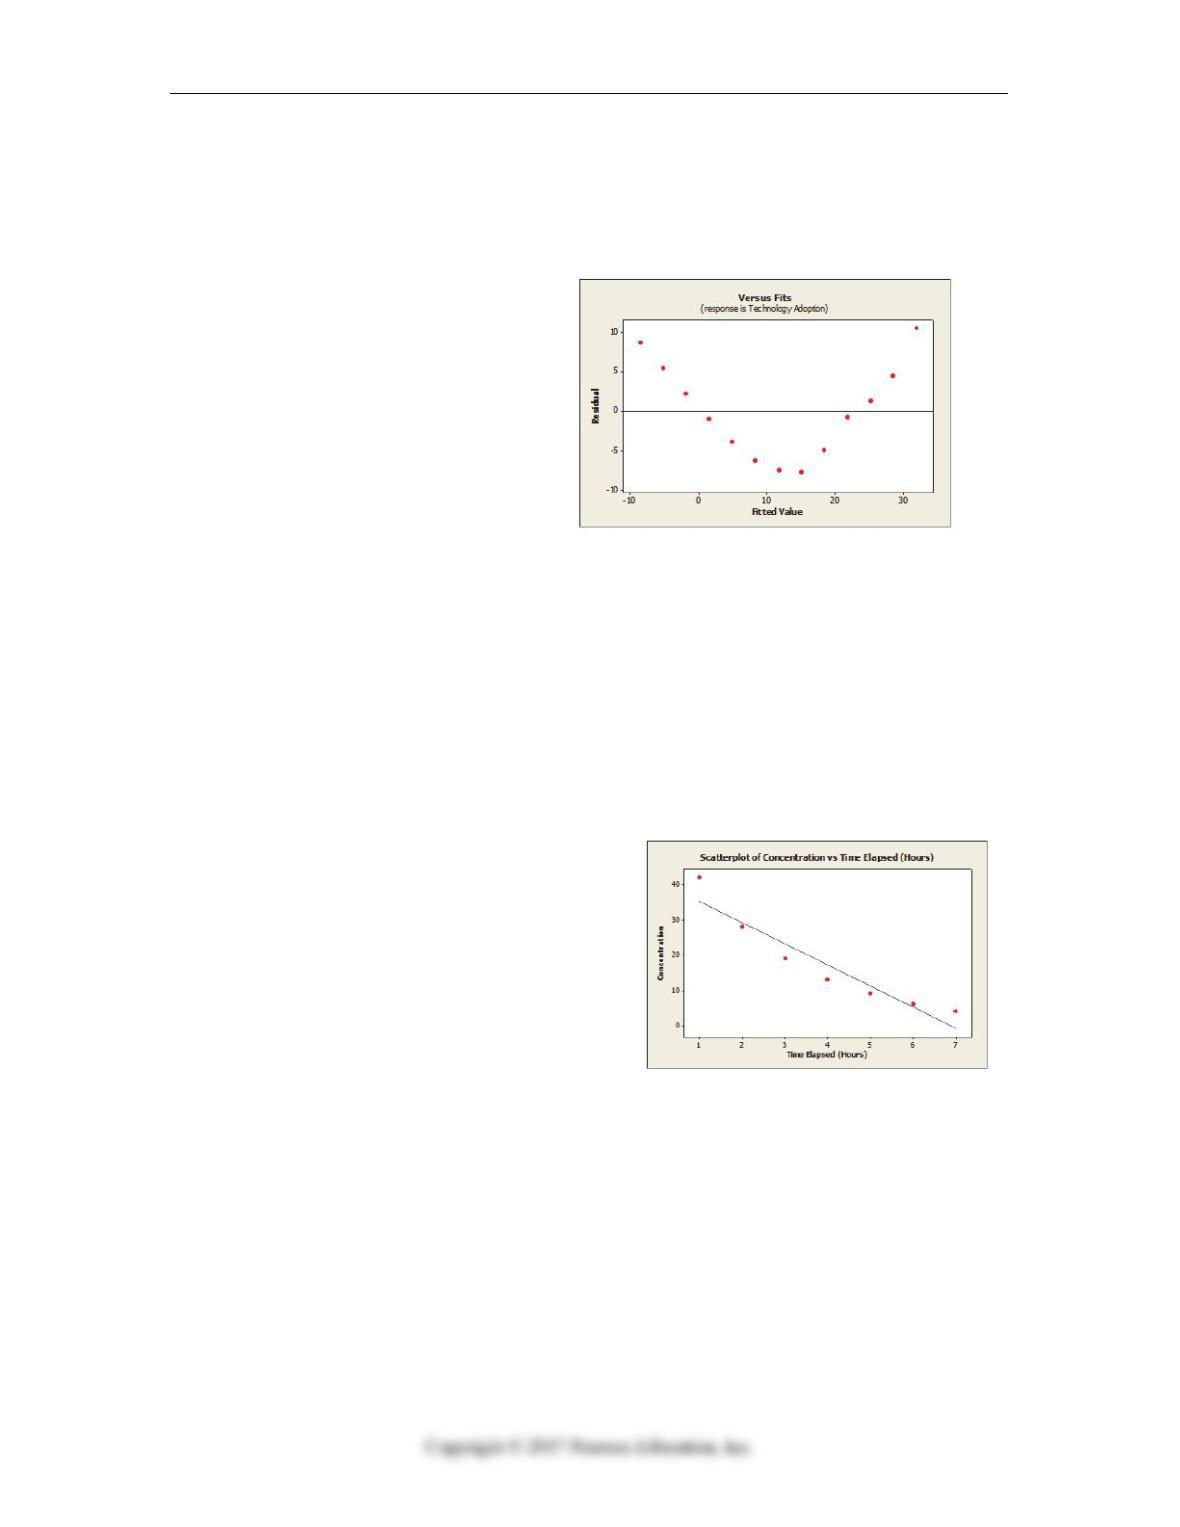
10. Based on the regression output and residual plot below, which of the following is
true?
Regression Analysis: Technology Adoption versus Time
The regression equation is:
Technology Adoption = – 11.9 +
3.37 Time
S = 6.30783 R-Sq = 82.5%
Durbin-Watson statistic = 0.278634
A. The linear model explains 82.5 % of the variability in technology adoption.
B. The linear model is appropriate.
C. The linear model is not appropriate.
D. Both A and B.
E. Both A and C.
Chapter 14: Determine when a linear model is appropriate for data.
11. A patient is injected with the drug and the concentration (units/cc) in the patient’s
blood is measured every hour for seven hours. Based on the linear regression output
below, which of the following is true?
Regression Analysis:
Concentration versus Time Elapsed
The regression equation is
Concentration = 41.3 – 6.00 Time Elapsed
S = 4.72077 R-Sq = 90.0%
A. The linear model is appropriate given that it explains 90% of the variability in
blood concentration levels of the drug.
B. If the observed pattern continues into the future, this model will underestimate the
concentration level after 10 hours has elapsed because the linear model is not
appropriate.
C. If the observed pattern continues into the future, this model will overestimate the
concentration level after 10 hours has elapsed because the linear model is not
appropriate.
D. Both A and B.
E. Both A and C.
IVB-6 Part IV: Models for Decision Making
Chapter 14: Re-express data to make them appropriate for use with a linear model.
12. A patient is injected with the drug and the concentration (units/cc) in the patient’s
blood is measured every hour for seven hours. Re-expressing these data result in the
following model and residual plot. What is true about the predicted concentration
level after 10 hours has elapsed?
Log(Concentration) = 1.79 – 0.169 Time Elapsed.
S = 0.00565191 R-Sq = 100.0%
A. The predicted value is 1.259 units/cc.
B. This value is considered an extrapolation.
C. This value is accurate because R2 = 100%.
D. Both A and B.
E. All of the above.
Chapter 14: Recognize unusual or extraordinary points.
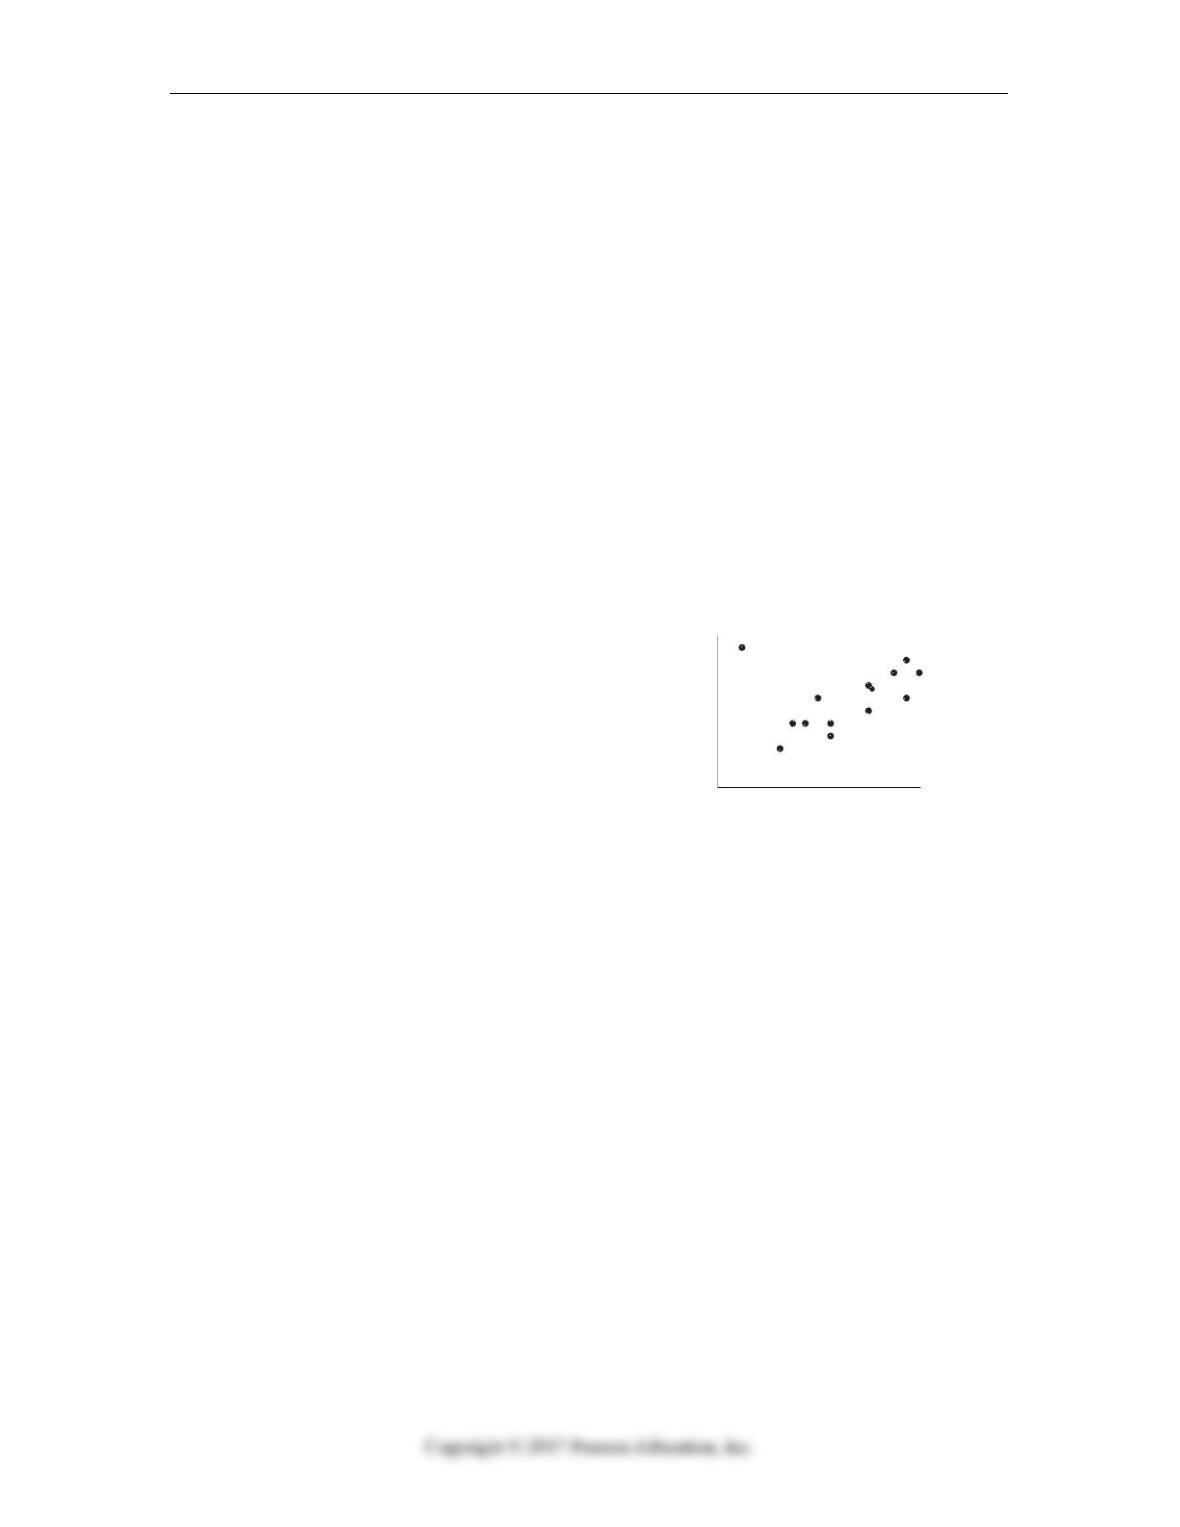
13. If the point in the upper left corner of the scatterplot shown below is removed, what
will happen to the correlation (r) and the slope of the line of best fit (b)?
A. They will not change.
B. Both will increase.
C. Both will decrease.
D. r will increase and b will decrease.
E. r will decrease and b will increase.
Chapter 15: Perform statistical inference for multiple regression.
14. Regression analysis was performed to develop a model for predicting a firm’s Price-
Earnings Ratio (PE) based on Growth Rate, Profit Margin, and whether or not the
firm is Green (1 = Yes, 0 = No). Based on the F-statistic of 26.48 which has a p-value
of 0.000, we can conclude at α = .05 that
A. the regression equation is not significant.
B. all independent variables in the model are significant.
C. the regression equation is significant.
D. none of the independent variables in the model are significant.
E. both B and C.

Test B IVB-7
Chapter 15: Perform statistical inference for multiple regression.
15. Based on the output below from regression analysis performed to develop a model for
predicting a firm’s Price-Earnings Ratio (PE) based on Growth Rate, Profit Margin,
and whether or not the firm is Green (1 = Yes, 0 = No), we can conclude (α = .05)
that
The regression equation is
PE = 8.04 + 0.757 Growth Rate + 0.0516 Profit Margin + 2.09 Green?
Predictor Coef SE Coef T P
Constant 8.043 1.570 5.12 0.000
Growth Rate 0.7569 0.1355 5.59 0.000
Profit Margin 0.05162 0.03239 1.59 0.139
Green? 2.0900 0.7945 2.63 0.023
S = 1.12583 R-Sq = 87.8%
A. Growth Rate is not a significant variable in predicting a firm’s PE ratio.
B. Profit Margin is a significant variable in predicting a firm’s PE ratio.
C. The regression coefficient associated with Growth Rate is not significantly
different from zero.
D. Whether or not a firm is Green is significant in predicting its PE ratio.
E. The regression coefficient associated with Profit Margin is significantly different
from zero.
Chapter 18: Use indicator (dummy) variables in multiple regression.
16. A regression model: PE = 8.04 + 0.747 Growth Rate + 0.0516 Profit Margin
+ 2.09 Green was developed to predict a firm’s Price-Earnings Ratio (PE) using
Growth Rate, Profit Margin, and whether the firm is Green (1 = Yes, 0 = No). Which
of the following is the correct interpretation for the regression coefficient of Green?
A. The regression coefficient indicates that the PE ratio of a firm that is green will,
on average, be 2.09 higher than a firm that is not green with the same growth rate
and profit margin.
B. The regression coefficient indicates that the PE ratio of a firm that is green will,
on average, be 2.09 lower than a firm that is not green with the same growth rate
and profit margin.
C. The regression coefficient indicates that the PE ratio of a firm that is green will,
on average, be 2.09 times higher than a firm that is not green with the same
growth rate and profit margin.
D. The regression coefficient indicates that the PE ratio of a firm that is green will,
on average, be 2.09 times lower than a firm that is not green with the same growth
rate and profit margin.
E. The regression coefficient is not significantly different from zero.
IVB-8 Part IV: Models for Decision Making
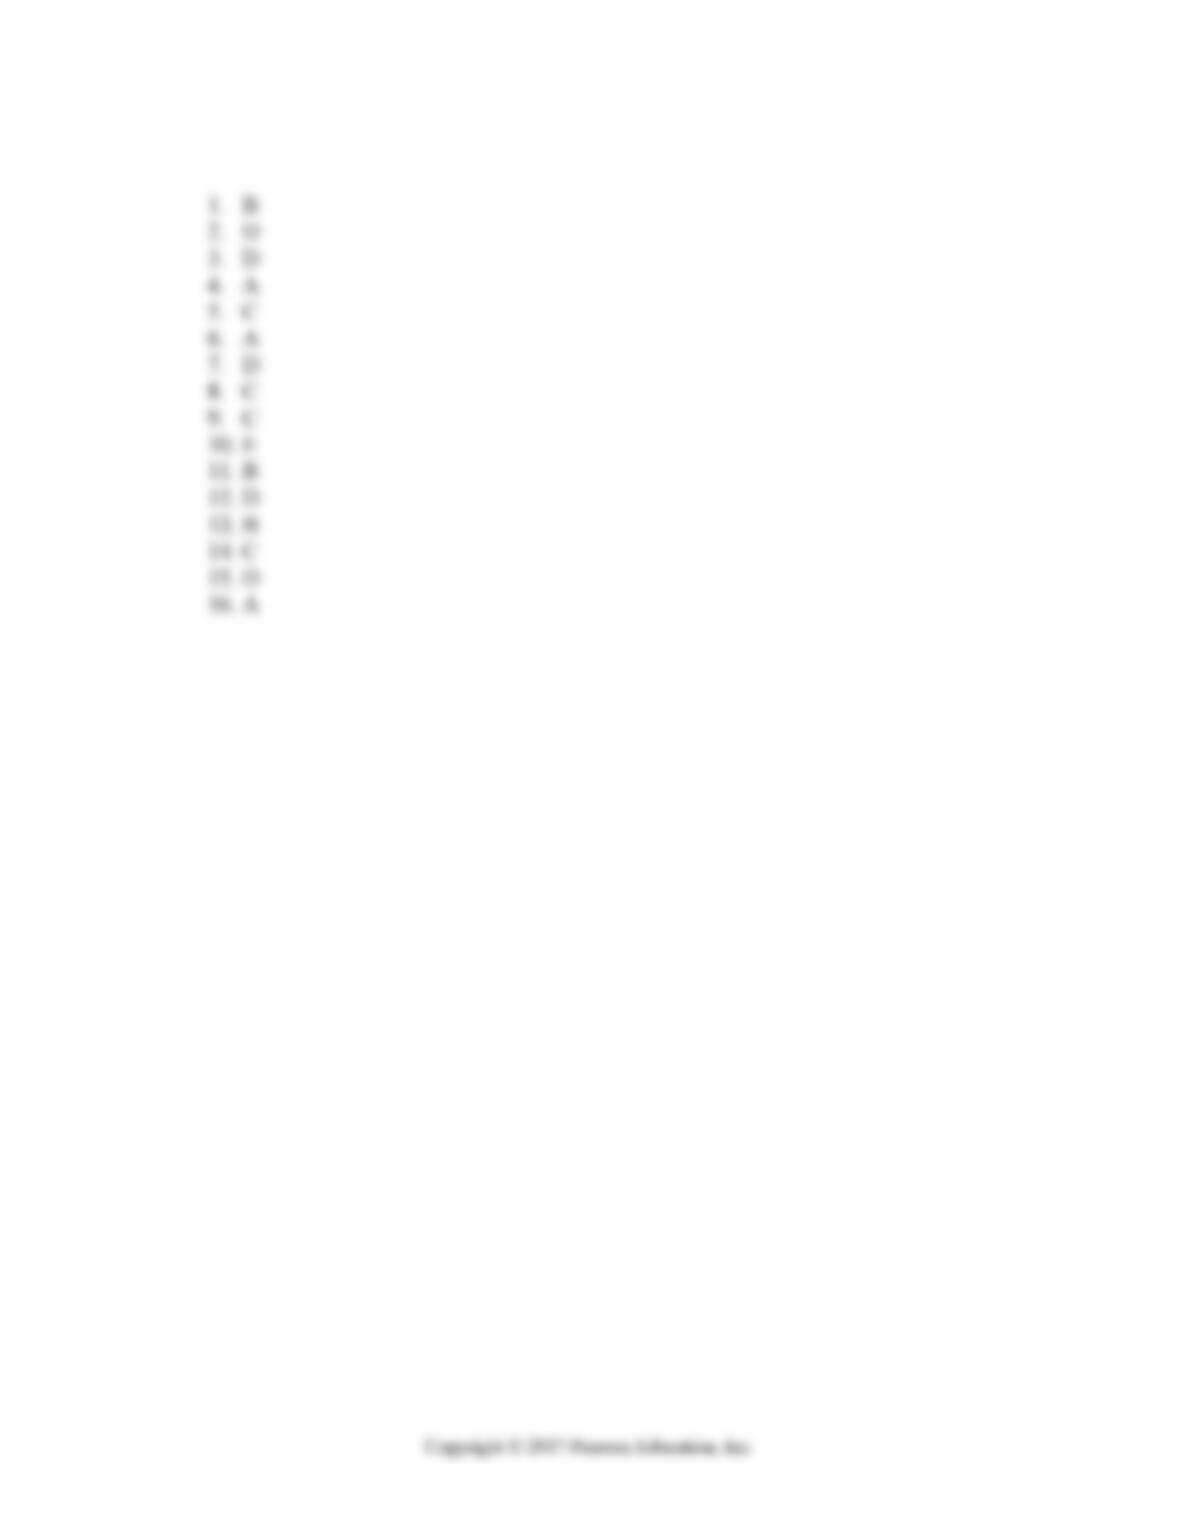
Business Statistics: Part IV: Models for Decision Making – Test B – Key