Chapter 16—Cost-Volume-Profit Analysis Key
1. Cost-volume-profit analysis focuses on the break-even point and the impact of changes in fixed costs and
price.
2. The break-even point is the point where total costs equal sales revenues.
3. The term net income is used to mean operating income before income taxes.
4. To earn a target profit, total costs plus the amount of target profit must equal total sales revenue.
5. Units to earn target profit equal total fixed costs plus target profit divided by the contribution margin ratio.
6. Sales revenue to earn target profits equals total fixed costs plus target profit divided by the contribution
margin.
7. Income taxes are generally calculated as a percentage of income.
8. When using either the equation or the contribution margin approach, the after-tax profit must be converted to
a before-tax profit target.
9. In multiple-product analysis, the break-even units for each product will change as the sales mix changes.
10. Increased sales of high contribution margin products increase the break-even point.
11. Increases in sales of low contribution margin products decrease the break-even point.
12. In a CVP graph, the intersection of the total costs line and the total sales revenue line is the break-even point
in units.
13. The profit-volume graph depicts the relationship among cost, volume, and profit.
14. The cost-volume-profit graph portrays the relationship between profits and sales volume.
15. CVP analysis is a short-run decision-making tool since some costs are fixed.
16. Multiple-product break-even analysis requires a constant sales mix, which is difficult to predict with
certainty.
17. Uncertainty regarding costs, prices, and sales mix affect the break-even point.
18. The operating leverage shows how far the company’s actual sales or units are from the break-even point.
19. Sensitivity analysis is a what-if technique that examines the impact of changes in assumptions.
20. Under ABC, cost drivers are separated into unit-based and non-unit-based drivers.
21. The __________ is where total revenues equal total costs.
22. The __________ ratio expresses variable costs in terms of sales dollars.
23. In cost-volume-profit analysis income taxes __________ the break even point.
24. Target after-tax profit must be converted into __________ profit to calculate units or revenue needed.
before-tax or
25. In multiple-product analysis, direct fixed costs can be __________ to each segment.
26. Increased sales of high contribution margin items __________ the break-even point.
27. On a profit-volume graph, the __________ line intersects the horizontal axis at the break-even point.
28. When a company sells more units than the break-even point, the __________ are positive.
29. If all else is the same, if the break-even point increases, then the variable cost per unit must
have __________ .
30. The use of fixed costs to increase the percentage changes in profits as sales activities change is called the
__________ leverage.
31. The break-even point is
32. The break-even point in units can be calculated using the contribution margin approach in the formula
33. Which of the following equations is CORRECT?
34. The variable cost ratio
35. Sales ´ Contribution Margin is a short-cut of what formula?
36. Which of the following is NOT a use of CVP (Cost-Volume-Profit) analysis?
37. Biscuit Company sells its product for $50. In addition, it has a variable cost ratio of 45 percent and total
fixed costs of $6,875. What is the break-even point in units for Biscuit Company?
38. Biscuit Company sells its product for $50. In addition, it has a variable cost ratio of 55 percent and total
fixed costs of $6,875. How many units must be sold in order to obtain a before-tax profit of $12,000?
39. Biscuit Company sells its product for $50. In addition, it has a variable cost ratio of 45 percent and total
fixed costs of $6,875. What is the break-even point in sales dollars for Biscuit Company?
40. Total contribution margin is calculated by subtracting
41. Which of the following items would NOT be considered in cost-volume-profit analysis?
42. The contribution margin at the break-even point
43. Figure 16 – 1
The Cumberland Company provides the following information:
Sales (250,000 units)
$625,000
Manufacturing costs:
Variable
212,500
Fixed
37,500
Selling and administrative costs:
Variable
100,000
Fixed
25,000
Refer to Figure 16-1. What is the break-even point in units for Cumberland?
44. Figure 16 – 1
The Cumberland Company provides the following information:
Sales (250,000 units)
$625,000
Manufacturing costs:
Variable
212,500
Fixed
37,500
Selling and administrative costs:
Variable
100,000
Fixed
25,000
Refer to Figure 16-1. What is the variable cost per unit for Cumberland?

45. Figure 16 – 1
The Cumberland Company provides the following information:
Sales (250,000 units)
$625,000
Manufacturing costs:
Variable
212,500
Fixed
37,500
Selling and administrative costs:
Variable
100,000
Fixed
25,000
Refer to Figure 16-1. What is the variable product cost per unit for Cumberland?
46. Figure 16 – 1
The Cumberland Company provides the following information:
Sales (250,000 units)
$625,000
Manufacturing costs:
Variable
212,500
Fixed
37,500
Selling and administrative costs:
Variable
100,000
Fixed
25,000
Refer to Figure 16-1. What is the contribution margin per unit for Cumberland?
47. Figure 16 – 1
The Cumberland Company provides the following information:
Sales (250,000 units)
$625,000
Manufacturing costs:
Variable
212,500
Fixed
37,500
Selling and administrative costs:
Variable
100,000
Fixed
25,000
Refer to Figure 16-1. What is the contribution margin ratio for Cumberland?
48. Figure 16 – 1
The Cumberland Company provides the following information:
Sales (250,000 units)
$625,000
Manufacturing costs:
Variable
212,500
Fixed
37,500
Selling and administrative costs:
Variable
100,000
Fixed
25,000
Refer to Figure 16-1. What is the total contribution margin for Cumberland?
49. Figure 16 – 1
The Cumberland Company provides the following information:
Sales (250,000 units)
$625,000
Manufacturing costs:
Variable
212,500
Fixed
37,500
Selling and administrative costs:
Variable
100,000
Fixed
25,000
Refer to Figure 16-1. What is the operating income for Cumberland?
50. Figure 16 – 1
The Cumberland Company provides the following information:
Sales (250,000 units)
$625,000
Manufacturing costs:
Variable
212,500
Fixed
37,500
Selling and administrative costs:
Variable
100,000
Fixed
25,000
Refer to Figure 16-1. What is the break-even point in sales dollars for Cumberland?
51. The income statement for Symbiosis Manufacturing Company for 2014 is as follows:
Sales (10,000 units)
$120,000
Variable expenses
72,000
Contribution margin
$ 48,000
Fixed expenses
36,000
Operating income
$ 12,000
What is the contribution margin per unit?
52. Summersville Production Company had the following projected information for 2014:
Selling price per unit
$150
Variable cost per unit
$90
Total fixed costs
$300,000
What is the break-even point in units?
53. Summersville Production Company had the following projected information for 2014:
Selling price per unit
$150
Variable cost per unit
$90
Total fixed costs
$300,000
What is the profit when one unit more than the break-even point is sold?
54. Summersville Production Company had the following projected information for 2014:
Selling price per unit
$150
Variable cost per unit
$90
Total fixed costs
$300,000
What is the contribution margin ratio?
55. Summersville Production Company had the following projected information for 2014:
Selling price per unit
$150
Variable cost per unit
$90
Total fixed costs
$300,000
What level of sales dollars is needed to obtain a target before-tax profit of $75,000?
56. The DesMaris Company had the following income statement for the month of November 2014:
DesMaris Company
Income Statement
For the Month of November 2014
Sales ($60 ´ 10,000)
$600,000
Cost of goods sold:
Direct materials ($12 ´ 10,000)
$120,000
Direct labor ($9 ´ 10,000)
90,000
Variable factory overhead ($7.50 ´ 10,000)
75,000
Fixed factory overhead
120,000
405,000
Gross profit
$195,000
Selling and administrative expenses:
Variable ($1.50 ´ 10,000)
$ 15,000
Fixed
90,000
105,000
Operating income
$ 90,000
DesMaris Company’s break-even sales volume is
57. The DesMaris Company had the following income statement for the month of November 2014:
DesMaris Company
Income Statement
For the Month of November 2014
Sales ($60 ´ 10,000)
$600,000
Cost of goods sold:
Direct materials ($12 ´ 10,000)
$120,000
Direct labor ($9 ´ 10,000)
90,000
Variable factory overhead ($7.50 ´ 10,000)
75,000
Fixed factory overhead
120,000
405,000
Gross profit
$195,000
Selling and administrative expenses:
Variable ($1.50 ´ 10,000)
$ 15,000
Fixed
90,000
105,000
Operating income
$ 90,000
What is the sales volume required to earn an operating profit of $9,000?
58. Assume the following information:
Selling price per unit
$180
Contribution margin ratio
48%
Total fixed costs
$270,000
How many units must be sold to generate a before-tax profit of $54,000?
59. Jamie Quinn, a sole proprietor, has the following projected figures for next year:
Selling price per unit
$150.00
Contribution margin per unit
$45.00
Total fixed costs
$630,000
How many units must be sold to obtain a target before-tax profit of $270,000?
60. Jamie Quinn, a sole proprietor, has the following projected figures for next year:
Selling price per unit
$150.00
Contribution margin per unit
$45.00
Total fixed costs
$630,000
What is the contribution margin ratio?
61. Jamie Quinn, a sole proprietor, has the following projected figures for next year:
Selling price per unit
$150.00
Contribution margin per unit
$45.00
Total fixed costs
$630,000
What is the break-even point in dollars?
62. The income statement for Symbiosis Manufacturing Company for 2014 is as follows:
Sales (10,000 units)
$120,000
Variable expenses
72,000
Contribution margin
$ 48,000
Fixed expenses
36,000
Operating income
$ 12,000
What is the contribution margin ratio?
63. In 2014, Samantha’s Bath and Body Shop had variable costs of $27,000, fixed costs of $18,000, and a net
loss of $4,500.
Samantha’s 2014 break-even sales volume was
64. In 2014, Samantha’s Bath and Body Shop had variable costs of $27,000, fixed costs of $18,000, and a net
loss of $4,500.
The annual sales volume required for Samantha’s to have a before-tax income of $18,000 is
65. Assume the following information:
Variable cost ratio
80%
Total fixed costs
$60,000
What volume of sales dollars is needed to break even?
66. Which of the following equations is TRUE?
67. Nonesuch Company sells only one product at a regular price of $7.50 per unit. Variable expenses are 60
percent of sales and fixed expenses are $30,000. Management has decided to decrease the selling price to $6.00
in hopes of increasing its volume of sales.
What is the contribution margin ratio when the selling price is reduced to $6 per unit?
68. Nonesuch Company sells only one product at a regular price of $7.50 per unit. Variable expenses are 60
percent of sales and fixed expenses are $30,000. Management has decided to decrease the selling price to $6.00
in hopes of increasing its volume of sales.
What is the sales dollars level required to break even at the old price of $7.50?
69. Hologram Printing Company projected the following information for next year:
Selling price per unit
$75.00
Contribution margin per unit
$30.00
Total fixed costs
$120,000
Tax rate
40%
How many units must be sold to obtain an after-tax profit of $67,500?
70. Hologram Printing Company projected the following information for next year:
Selling price per unit
$75.00
Contribution margin per unit
$30.00
Total fixed costs
$120,000
Tax rate
40%
What is the break-even point in dollars?
71. Tiramisu Company projected the following information for next year:
Selling price per unit
$60.00
Contribution margin per unit
$30.00
Total fixed costs
$100,000
Tax rate
20%
How many units must be sold to obtain an after-tax profit of $40,000?
72. In the cost-volume-profit analysis, income taxes
73. Assume the following cost behavior data for Graphic Arts Company:
Sales price
$18.00
per unit
Variable costs
$13.50
per unit
Fixed costs
$22,500
Tax rate
40%
What volume of sales dollars is required to earn a before-tax income of $27,000?
74. Assume the following cost behavior data for Graphic Arts Company:
Sales price
$18.00
per unit
Variable costs
$13.50
per unit
Fixed costs
$22,500
Tax rate
40%
What volume of sales dollars is required to earn an after-tax income of $40,500?
75. Which of the following is a TRUE statement about sales mix?
76. Sales mix refers to
77. Victoria Company produces two products, X and Y, which account for 60 percent and 40 percent,
respectively, of total sales dollars. Contribution margin ratios are 50 percent for X and 25 percent for Y. Total
fixed costs are $120,000. What is Patricia’s break-even point in sales dollars?
78. In multiple-product analysis, direct fixed costs are
79. Information about the Harmonious Company’s two products includes:
Product X
Product Y
Unit selling price
$11.25
$11.25
Unit variable costs:
Manufacturing
$5.25
$6.75
Selling
.75
.75
Total
$6.00
$7.50
Monthly fixed costs are as follows:
Manufacturing
$ 82,500
Selling and administrative
45,000
Total
$127,500
What is the total monthly sales volume in units required to break even when the sales mix in units is 70 percent Product X and 30 percent Product
Y?
80. Information about the Harmonious Company’s two products includes:
Product X
Product Y
Unit selling price
$11.25
$11.25
Unit variable costs:
Manufacturing
$5.25
$6.75
Selling
.75
.75
Total
$6.00
$7.50
Monthly fixed costs are as follows:
Manufacturing
$ 82,500
Selling and administrative
45,000
Total
$127,500
If the sales mix in units is 50 percent Product X and 50 percent Product Y, the monthly break-even total sales dollars is
81. Product 1 has a contribution margin of $6.00 per unit, and Product 2 has a contribution margin of $7.50 per
unit. Total fixed costs are $300,000. Sales mix and total volume varies from one period to another. Which of the
following is TRUE?
82. The following data pertain to the three products produced by Culdesac Corporation:
A
B
C
Selling price per unit
$5.00
$7.00
$6.00
Variable costs per unit
4.00
5.00
3.00
Contribution margin per unit
$1.00
$2.00
$3.00
Fixed costs are $90,000 per month.
Sixty percent of all units sold are Product A, 30 percent are Product B, and 10 percent are Product C.
What is the monthly break-even point for total units?
83. On a profit-volume graph, the profit line intersects the horizontal axis at
84. In a cost-volume-profit graph,
85. Which of the following statements is TRUE in a cost-volume-profit graph?
86. In a cost-volume-profit graph, the total revenue line rises with a slope equal to
87. In a cost-volume-profit graph, the slope of the total revenue line represents
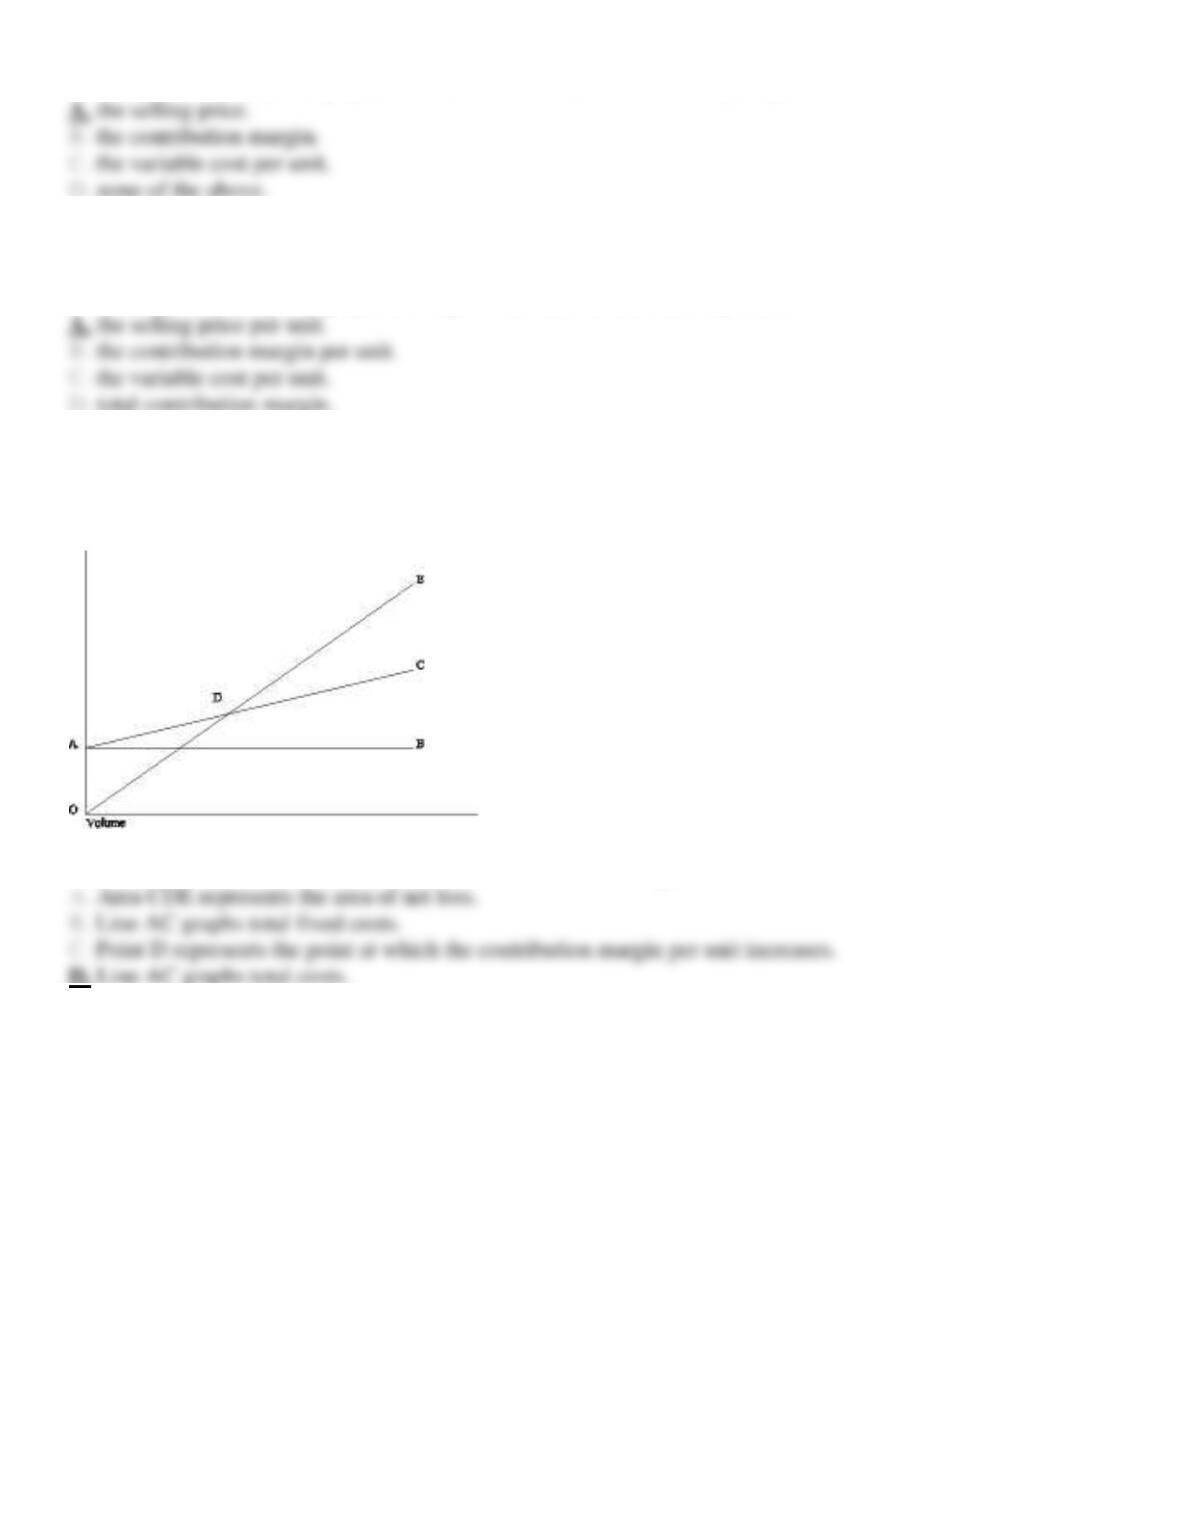
88. The following diagram is a cost-volume-profit graph for a manufacturing company:
Select the answer that best describes the labeled item on the diagram.