Exam
Name___________________________________
SHORT ANSWER. Write the word or phrase that best completes each statement or answers the question.
Provide an appropriate response.
1)
Explain the purpose of a comparative line graph.
1)
2)
List the advantages and disadvantages of using a bar graph to present data.
2)
3)
Explain why or when the median is a better average to use than the mean.
3)
4)
Describe some situations where the mode is the best average to use to describe data.
4)
MULTIPLE CHOICE. Choose the one alternative that best completes the statement or answers the question.
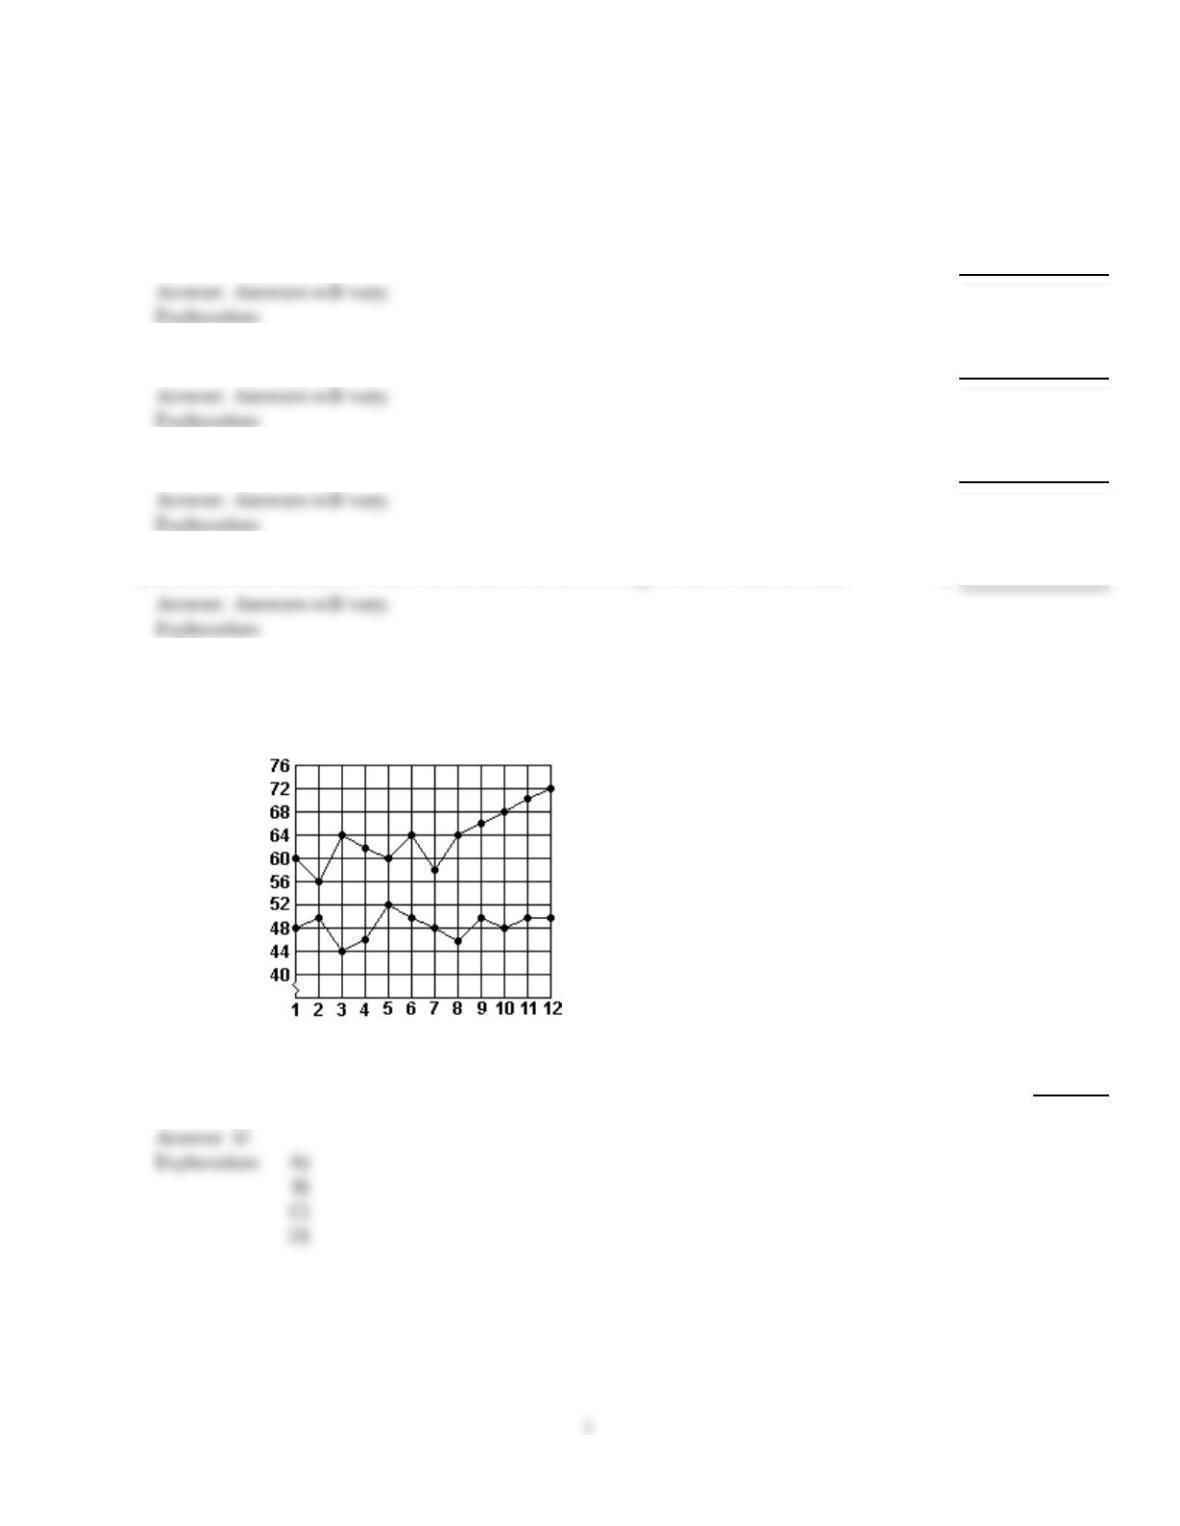
Use this graph to answer the question.
Sales
(thousands of dollars)
2010
2009
Month
5)
Which month in 2010 had the highest sales?
5)
A)
Month 6
B)
Month 3
C)
Month 8
D)
Month 12
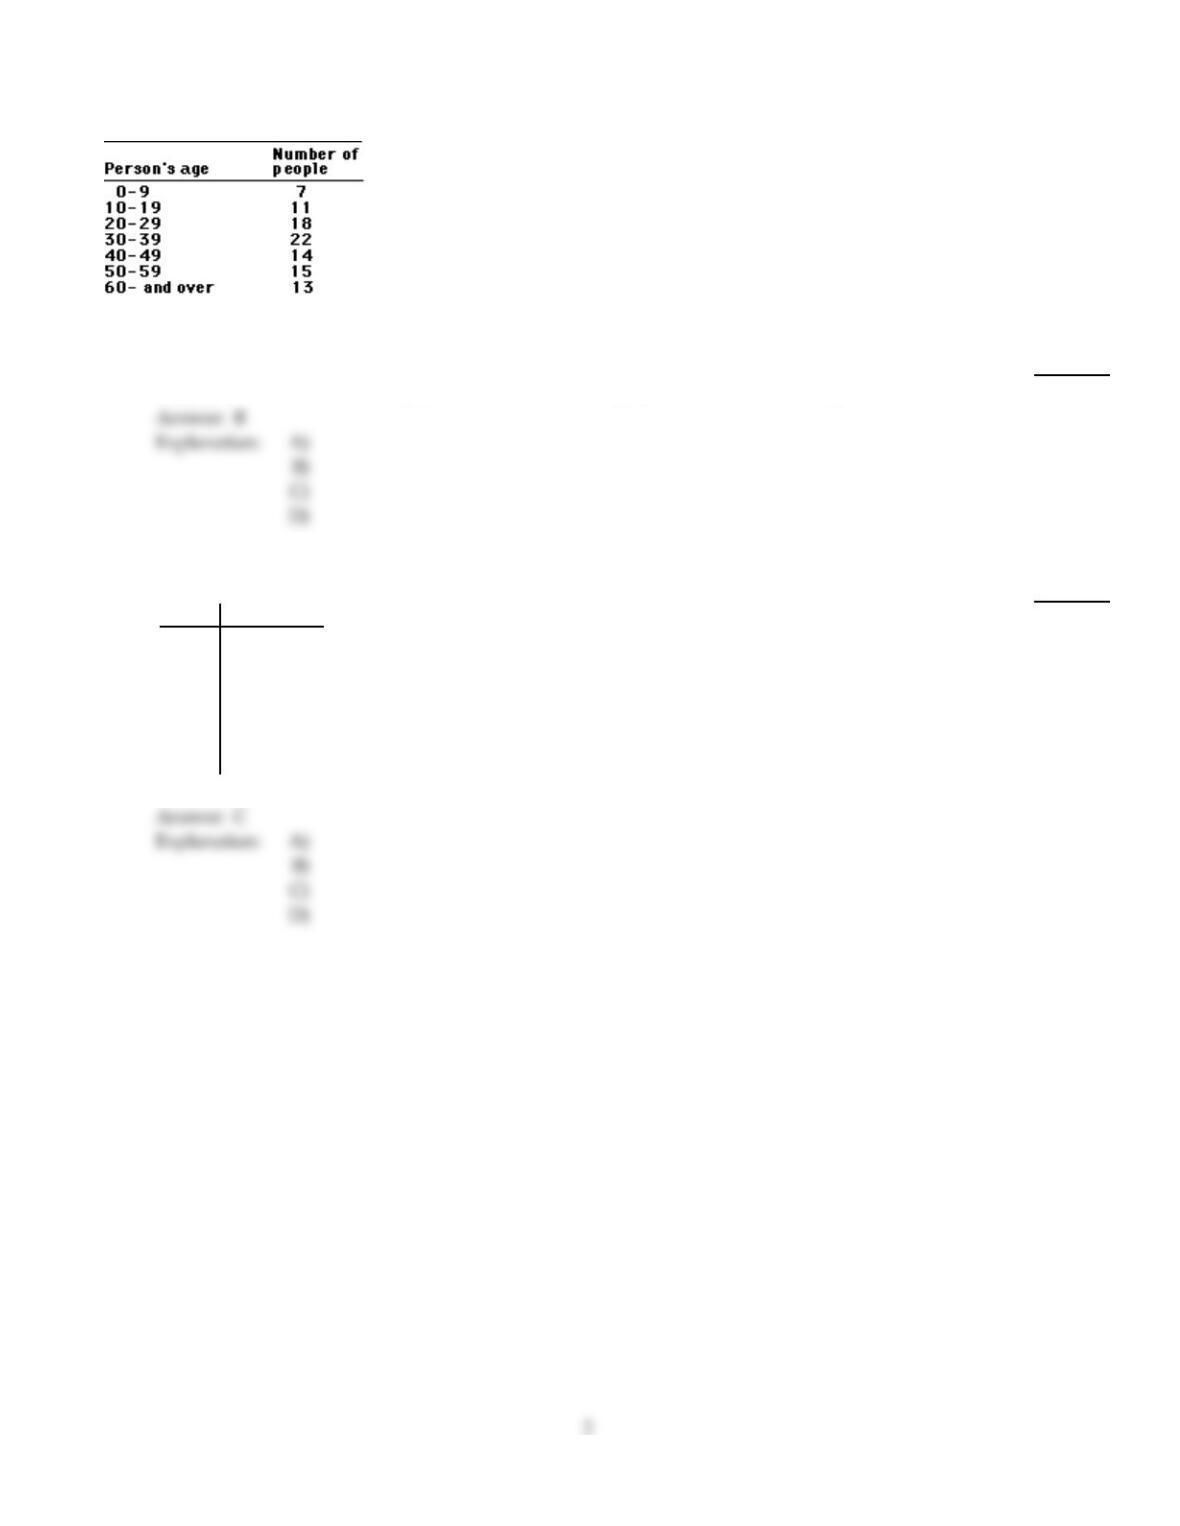
This frequency table gives the distribution of ages of 100 people in a small town.
How many people are:
6)
Less than 30 years of age
6)
A)
22
B)
36
C)
18
D)
29
Find the weighted mean. Round to the nearest tenth.
7)
Value Frequency
12 3
18 6
25 5
28 4
34 2
40 3
7)
A)
25.3
B)
6.8
C)
24.7
D)
27.1
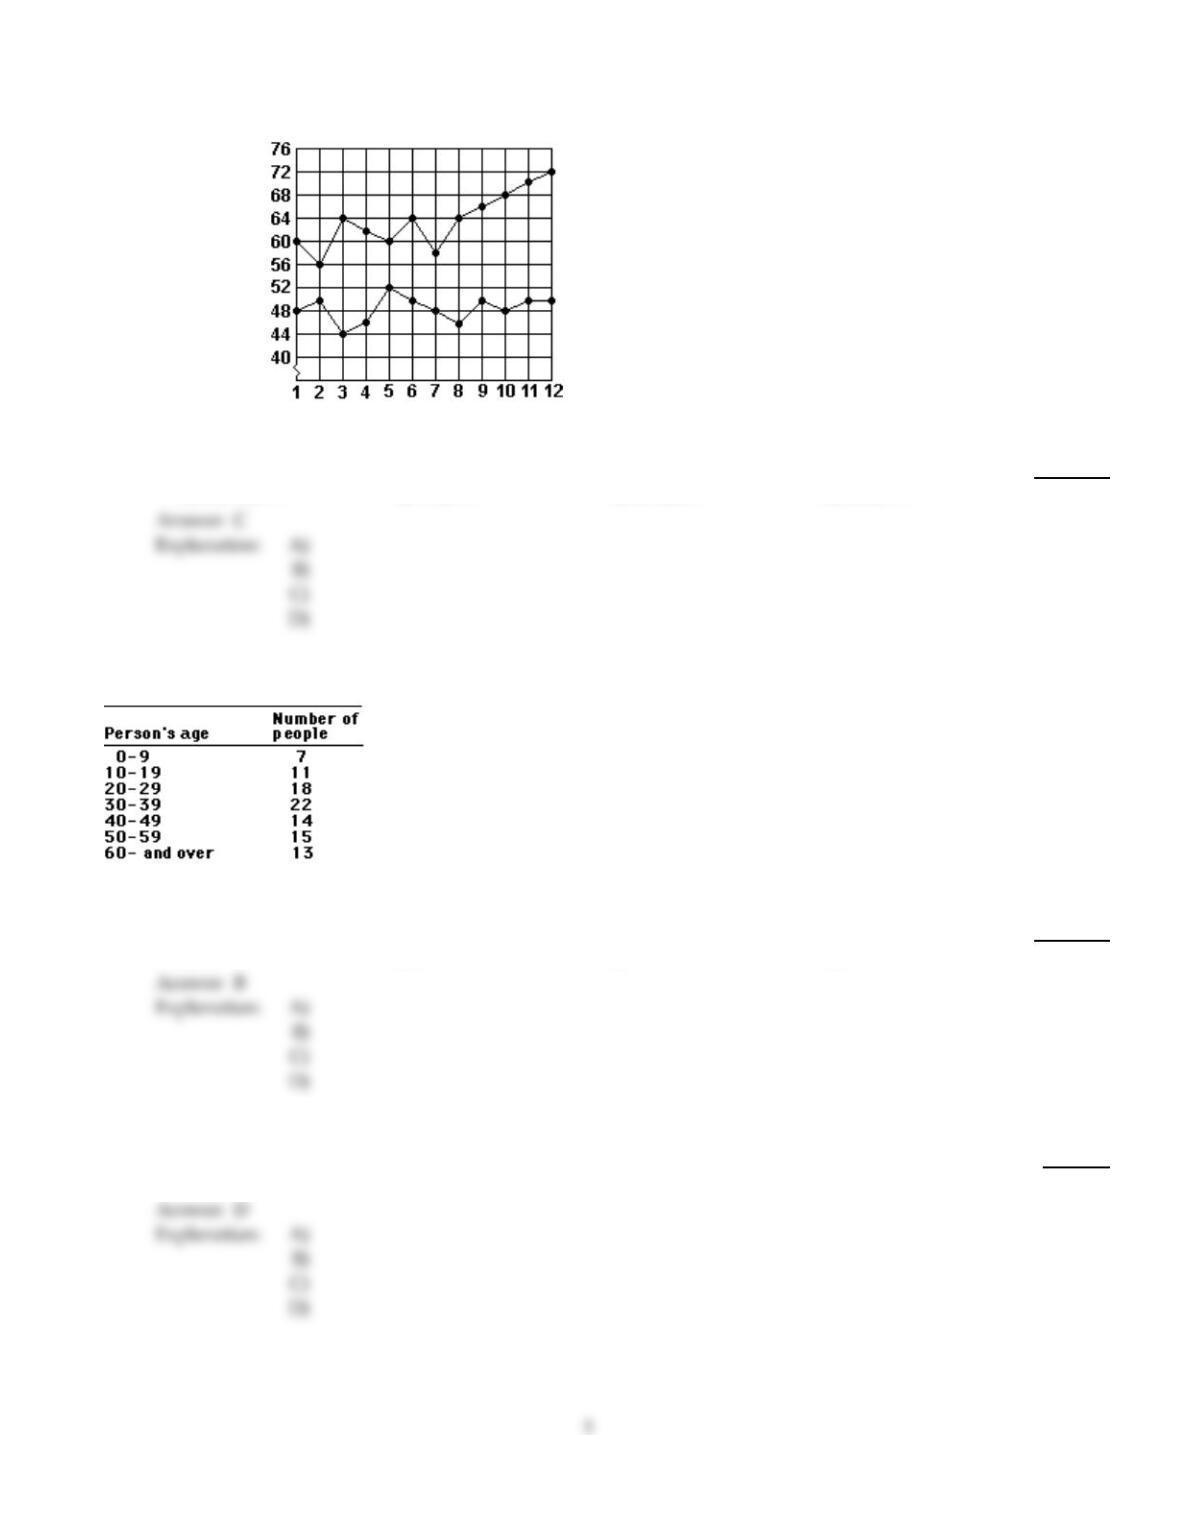
Use this graph to answer the question.
Sales
(thousands of dollars)
2010
2009
Month
8)
What was the total increase in sales from 2009 to 2010?
8)
A)
$1,342,000
B)
$12,000
C)
$182,000
D)
$22,000
This frequency table gives the distribution of ages of 100 people in a small town.
How many people are:
9)
10 years of age or older
9)
A)
82
B)
93
C)
7
D)
11
Find the median.
10)
Number of miles driven: 11, 19, 34, 54, 75, 75, 75
10)
A)
34
B)
75
C)
49
D)
54
Find the mean. Round to the nearest tenth unless otherwise stated.
11)
Snow accumulation: 9, 9.2, 7.4, 9.2, 7.2
11)
A)
7
B)
9.2
C)
8.4
D)
9
Solve the following circle graph problems.
12)
If total expenses are $1080 and miscellaneous expenses account for $54, how many degrees in a
circle graph would miscellaneous expenses represent?
12)
A)
60°
B)
18°
C)
72°
D)
54°
Find the weighted mean. Round to the nearest tenth.
13)
Value Frequency
163 2
206 4
243 5
273 6
348 3
374 3
13)
A)
69.9
B)
293.8
C)
243.3
D)
268.2
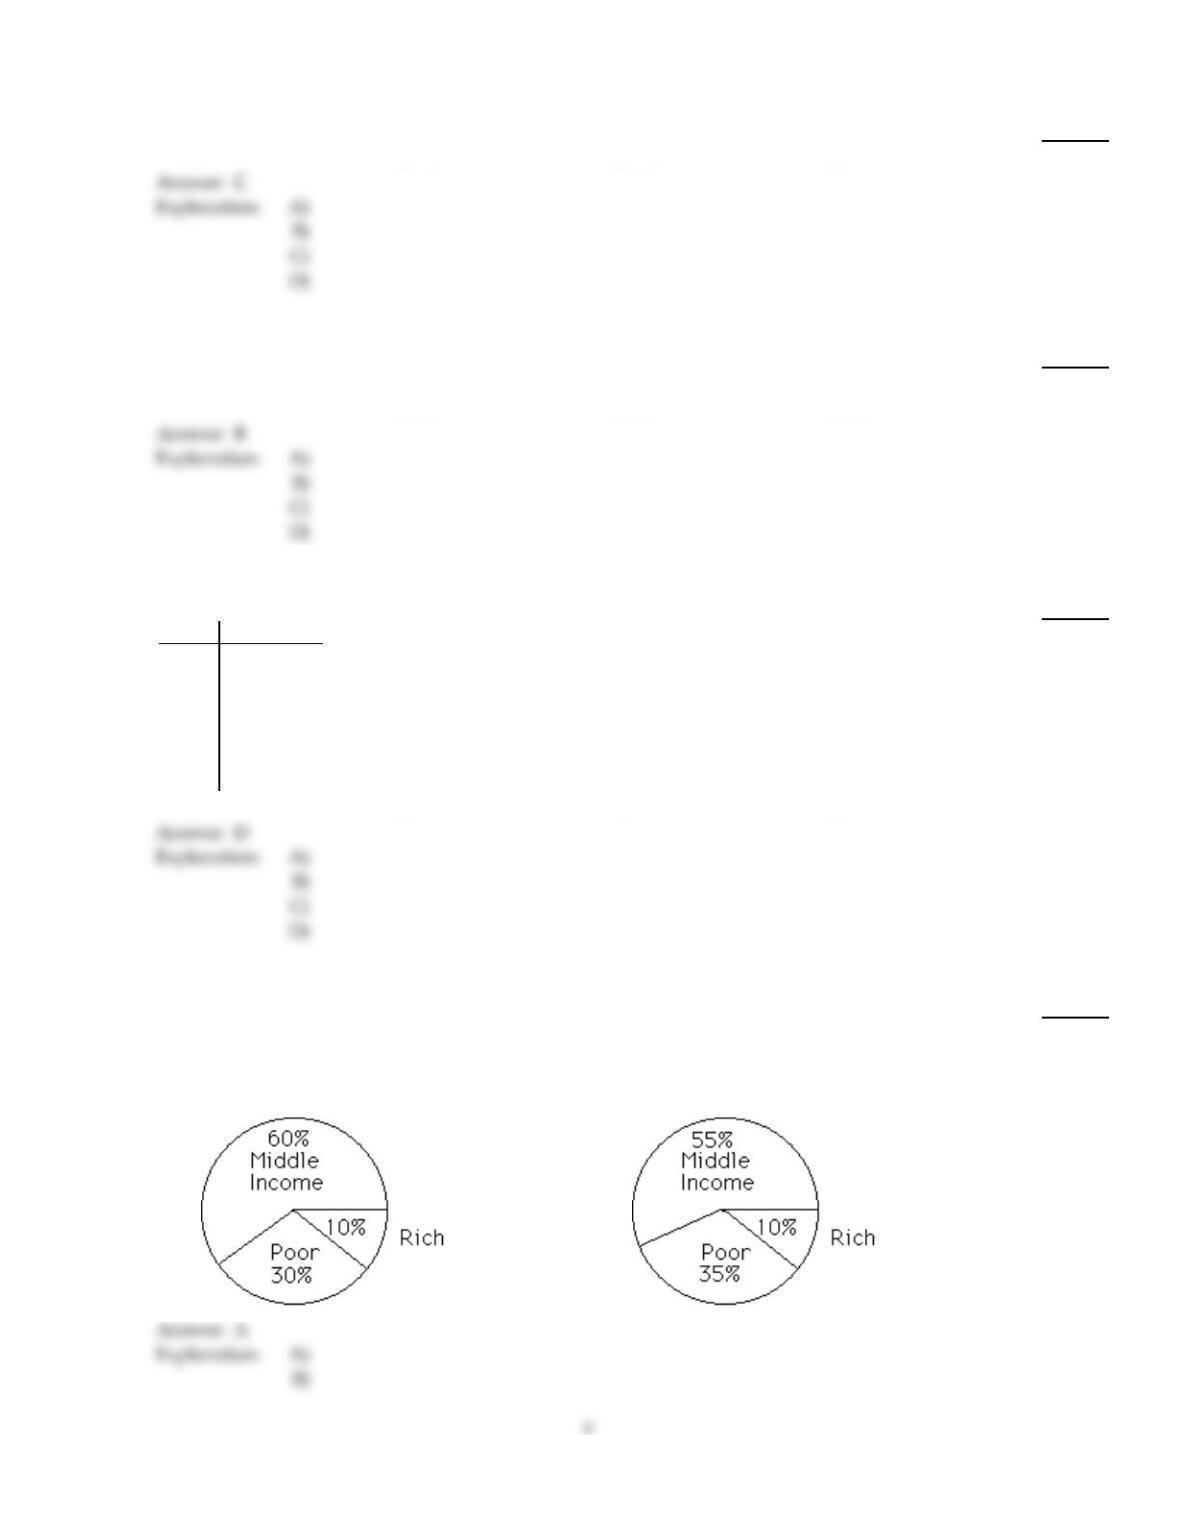
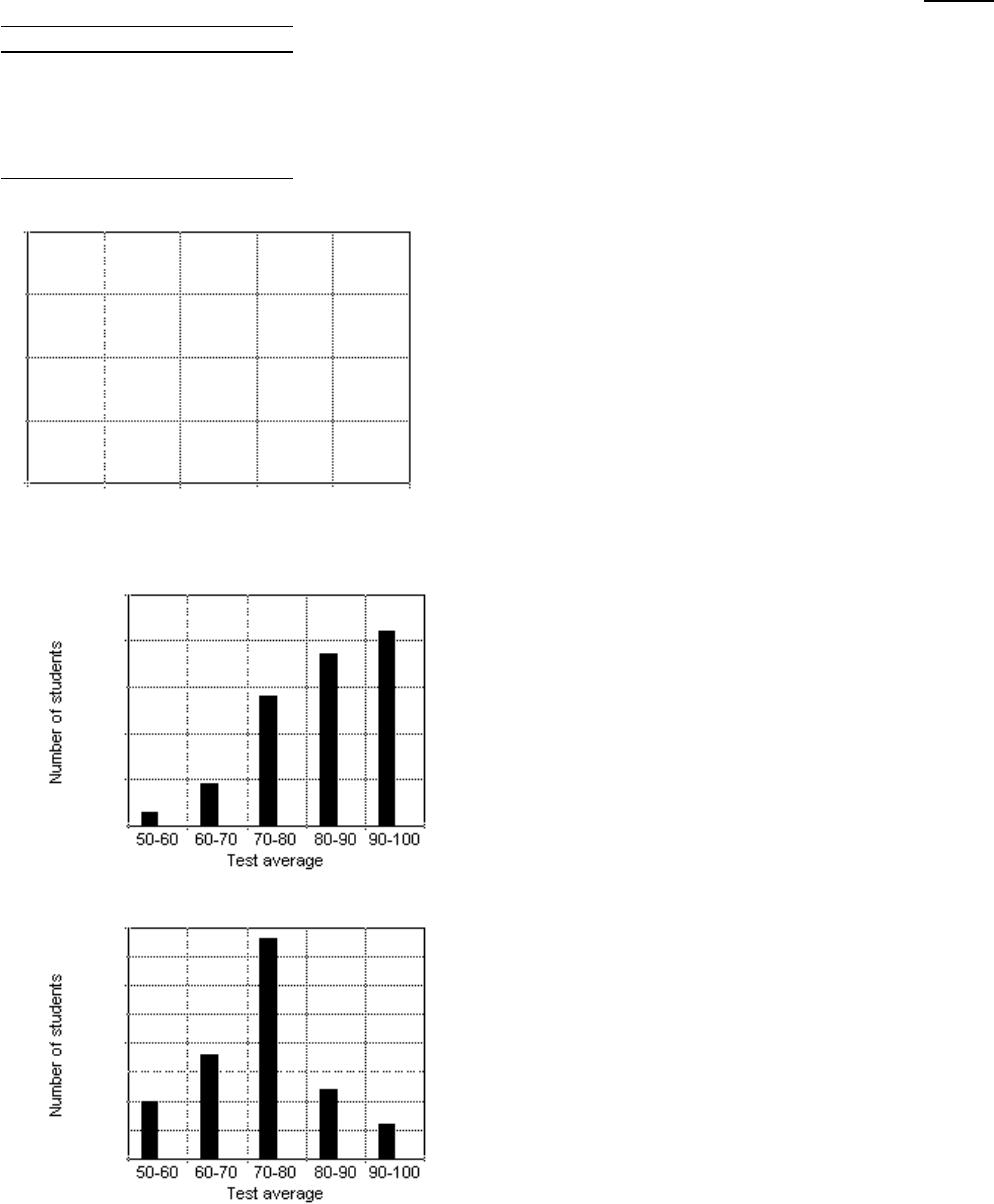
Describe the distributions with a pie chart.
14)
The following figures give the economic distribution for 20,000 people who live in a certain county.
Poor Middle Income Rich
6000 12,000 2000
14)
A)
B)
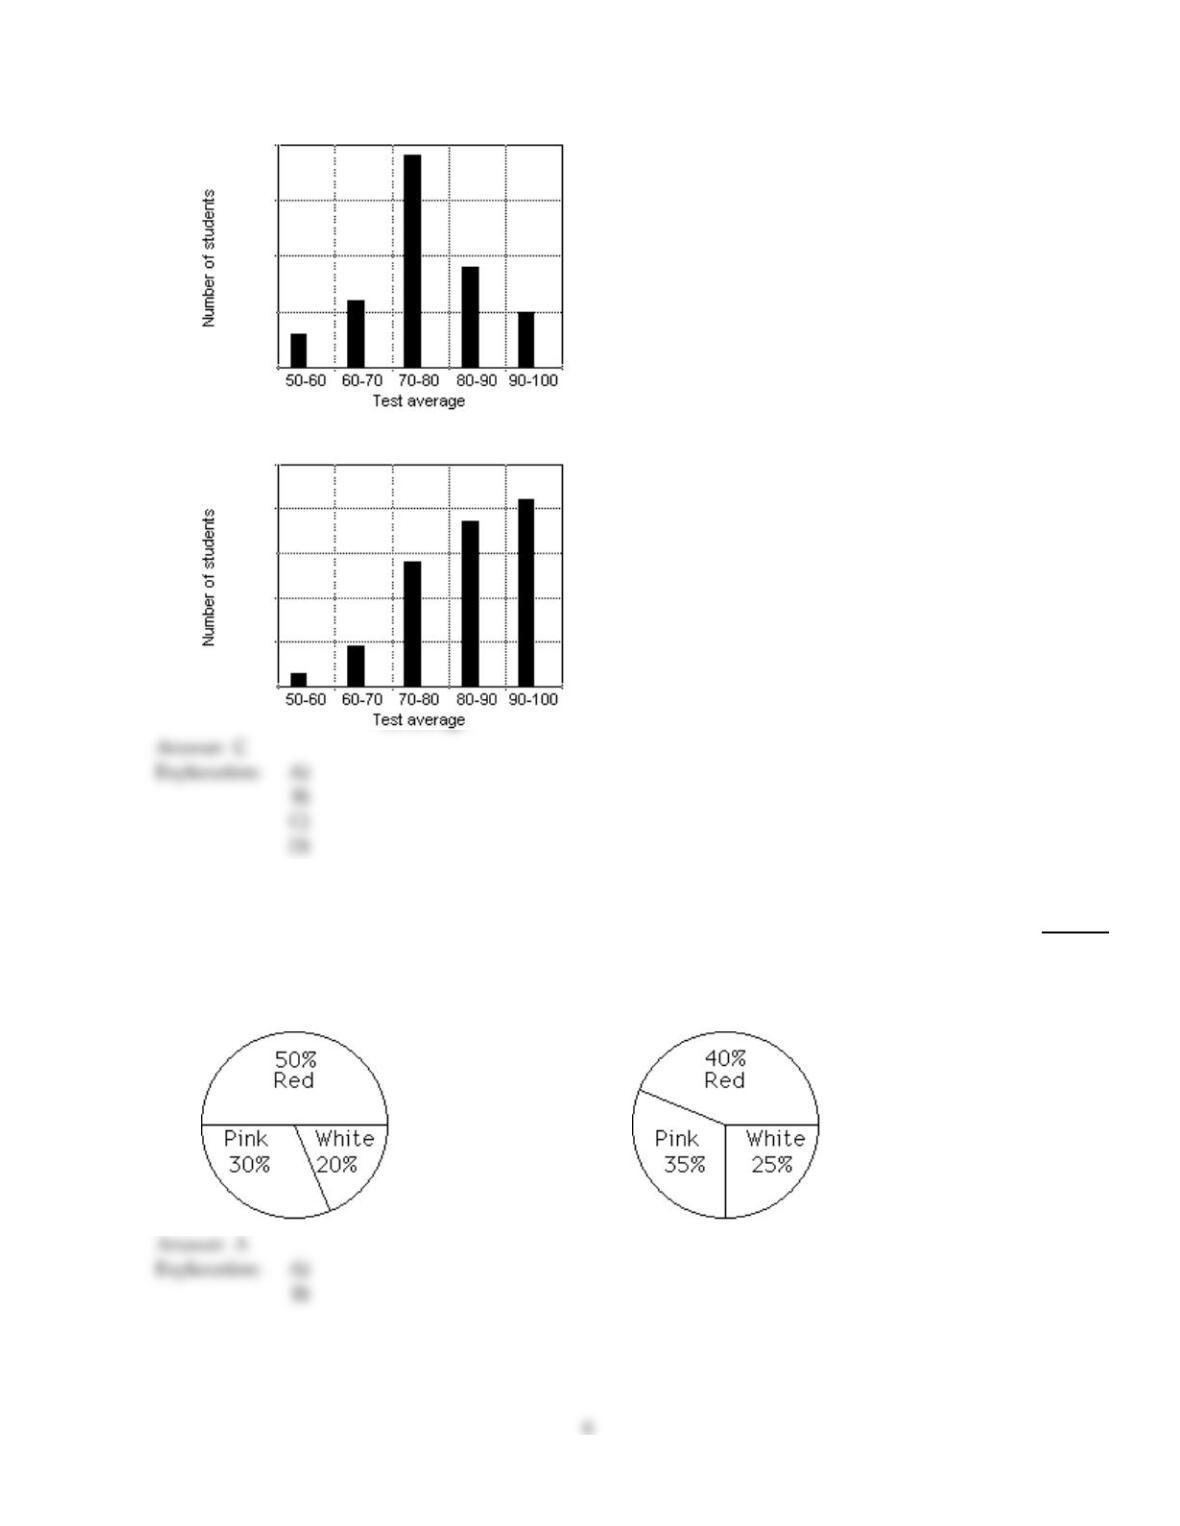
Make a bar graph using the given frequencies.
15)
The frequency distribution indicates the test averages of a group of 210 students.
Test average Number of students
90–100 25
80–90 45
70–80 95
60–70 30
50–60 15
15)
A)
250
0
B)
100
50
0
5
C)
100
50
0
D)
125
0
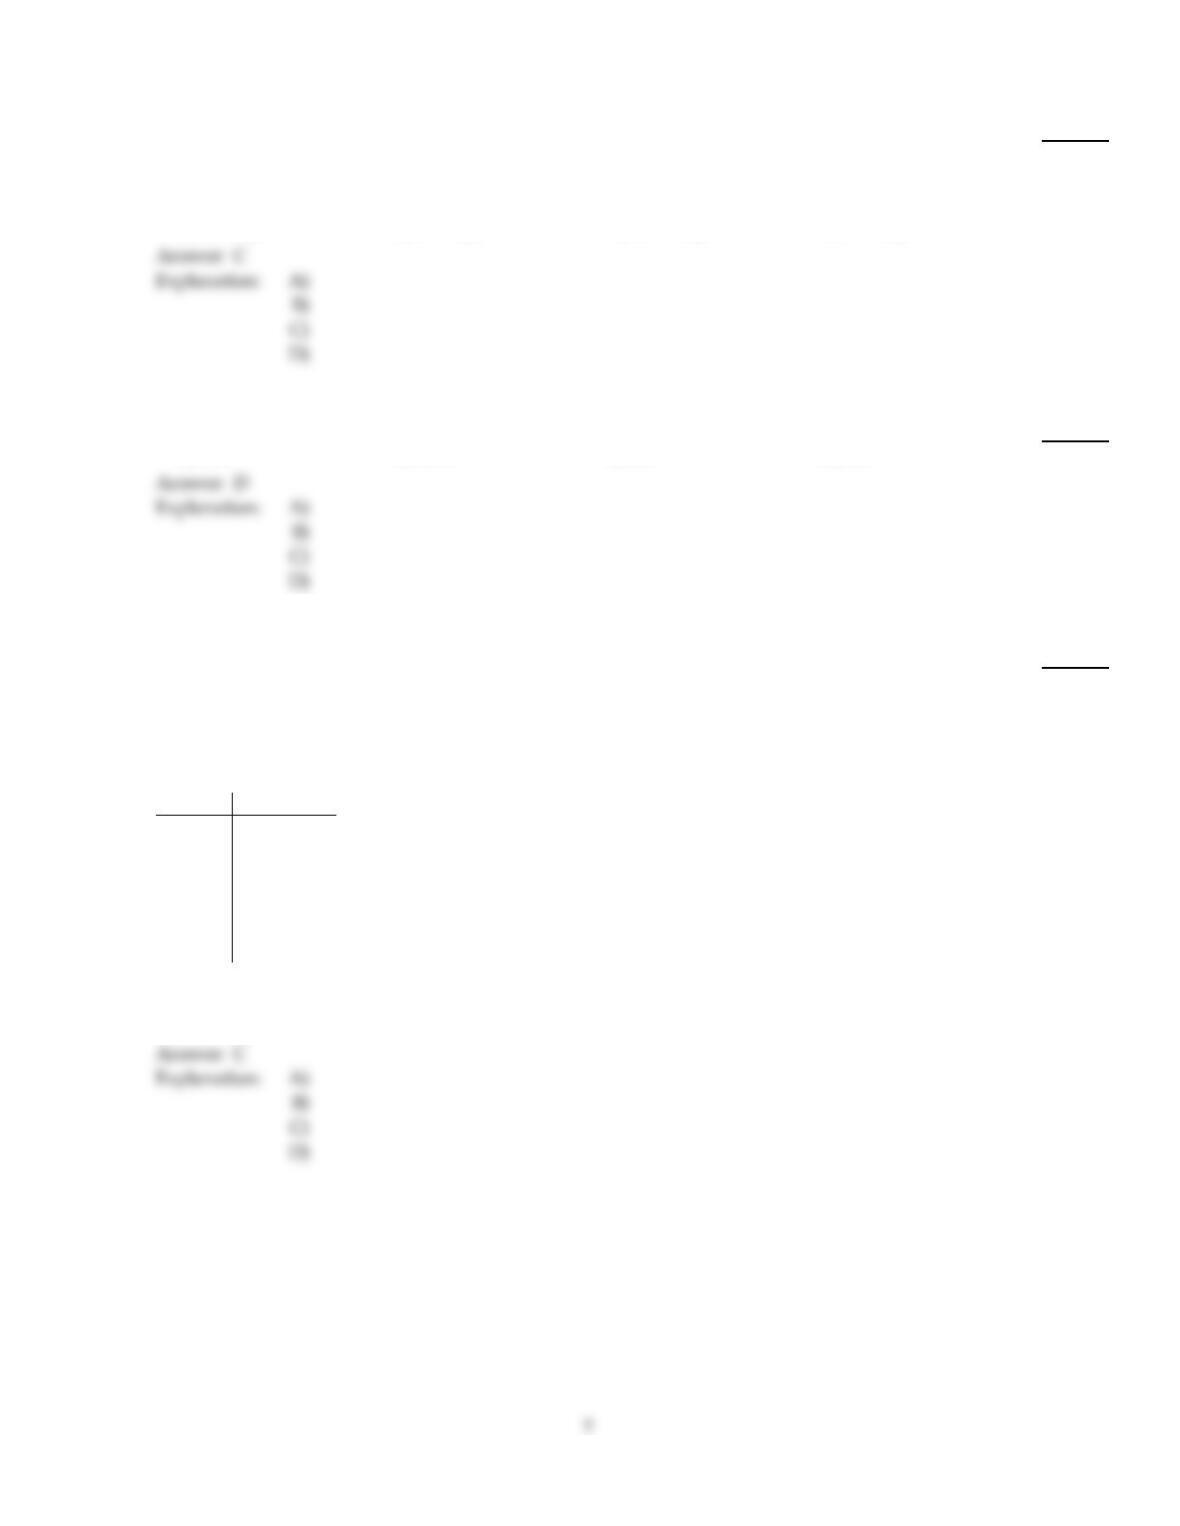
Describe the distributions with a pie chart.
16)
The following data give the color distribution of 600 carnations ordered by a local florist.
Pink Red White
180 300 120
16)
A)
B)
Solve the problem.
17)
A company that manufactures computer chips wants to determine how many defective chips are in
ten batches to be shipped. A quality control team samples 250 chips from each batch of 1000 and
finds the following defective chips per batch: 50, 15, 10, 1, 29, 12, 22, 30, 37, 33. Find the median
number of defective chips.
17)
A)
22 chips
B)
29 chips
C)
25.5 chips
D)
24 chips
Find the mode or modes.
18)
63, 25, 63, 13, 25, 29, 56, 63
18)
A)
42.1
B)
42.5
C)
25
D)
63
Use the data to complete the table.
19)
The following is the number of bonus points that 24 students have received for extra work.
27 82 138 169 230 225 163 125
50 20 52 258 57 145 192 249
161 149 49 99 150 199 160 275
Points Frequency
0–49
50–99
100–149
150–199
200–249
250–299
19)
A)
Frequency: 3, 5, 3, 8, 3, 2
B)
Frequency: 3, 4, 5, 7, 3, 2
C)
Frequency: 3, 5, 4, 7, 3, 2
D)
Frequency: 3, 5, 4, 6, 4, 2
Solve the problem.
20)
Customer relations specialists need to respond to email messages in addition to taking calls. The
department is thinking of creating a new position that will solely handle email. The supervisor
records the number of email messages received for eight consecutive days: 9, 1, 28, 18, 27, 50, 40, 30.
Find the median number of email messages received.
20)
A)
27 email messages
B)
25.5 email messages
C)
27.5 email messages
D)
28 email messages
D)
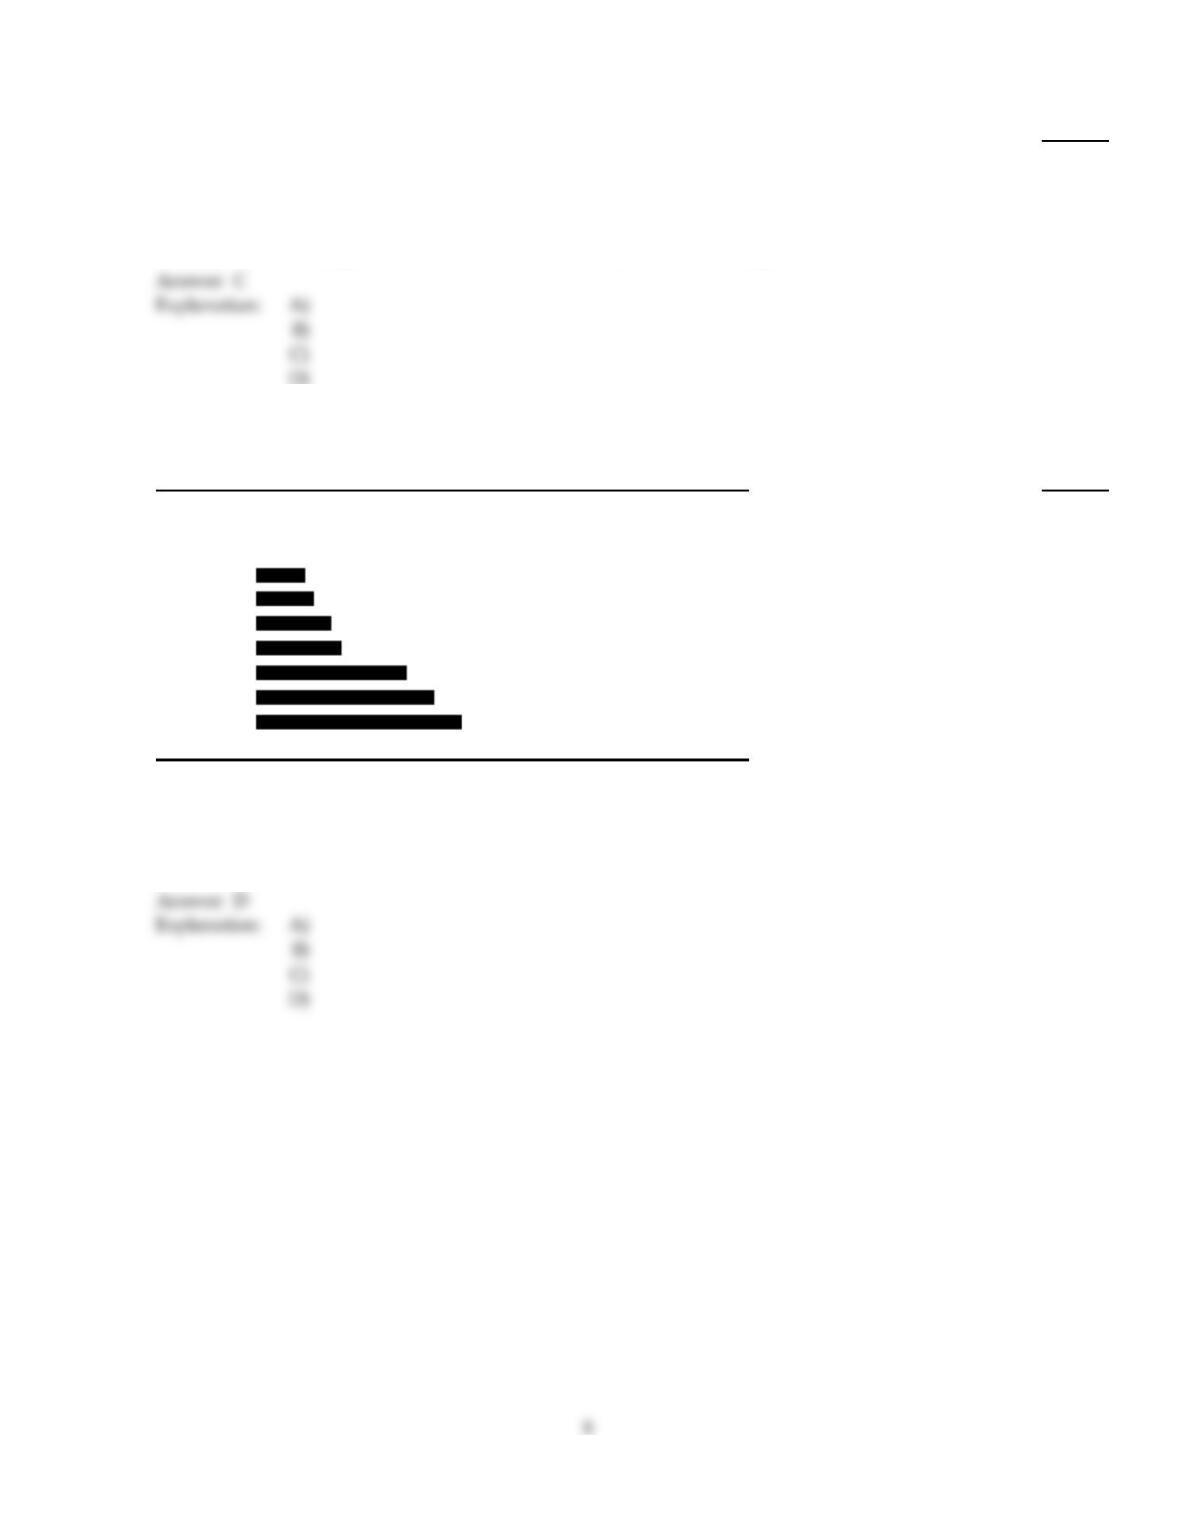
The bar graph shows the percent of income spent on leisure activities in various countries of the world. Use the graph to
answer the question.
21)
PERCENT OF HOUSEHOLD INCOME FOR LEISURE ACTIVITIES
China 5.3%
Australia 7.9%
France 11.6%
Germany 13.4%
Britain 19.3%
Japan 23.6%
USA 29.2%
List all countries in the graph in which less than 15% of household income is spent, on average, for
leisure activities.
21)
A)
China, Australia, France
B)
Britain, Japan, USA
C)
China, Australia
D)
China, Australia, France, Germany
D)
Find the grade point average for the following student. Assume A = 4, B = 3, C = 2, D = 1, and F = 0. Round answer to the
nearest tenth.
22)
Credits Grade
2 A
6 C
4 A
2 A
4 B
22)
A)
4.1
B)
3.1
C)
11.2
D)
2.1
Solve the following circle graph problems.
23)
If rent is represented by 54° on a circle graph showing all expenses, and the cost of rent is $870, how
much are the total expenses?
23)
A)
$7250
B)
$6960
C)
$5220
D)
$5800
Find the median.
24)
Cost of cellular phones: $56, $24, $219, $134, $279, $249, $240
24)
A)
$219
B)
$134
C)
$240
D)
$172
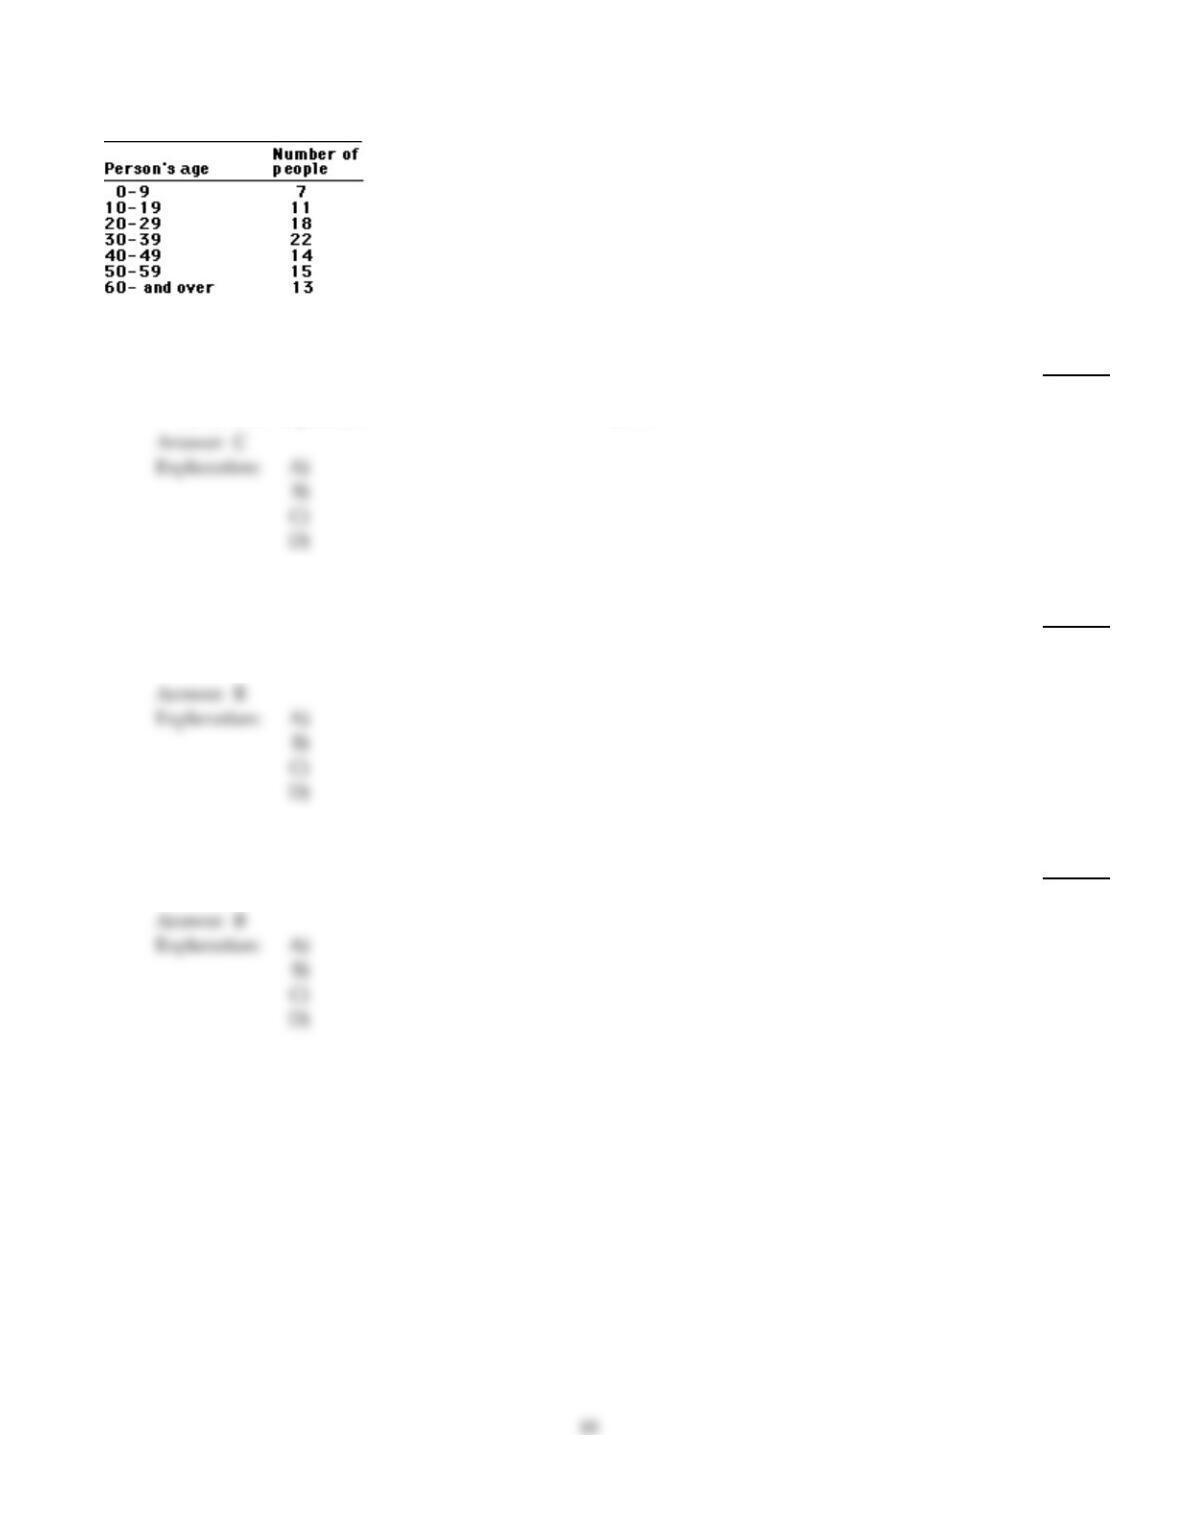
This frequency table gives the distribution of ages of 100 people in a small town.
How many people are:
25)
More than 50 years of age
25)
A)
28
B)
42
C)
No answer possible
D)
15
Find the mean. Round to the nearest tenth unless otherwise stated.
26)
Annual sales bonuses: $7290, $2080, $3390, $4030, $5280, $2140
Round to the nearest whole number.
26)
A)
$4030
B)
$4035
C)
$4034
D)
$3390
Find the mode or modes.
27)
85, 40, 32, 40, 29, 85
27)
A)
85
B)
85, 40
C)
51.8
D)
40
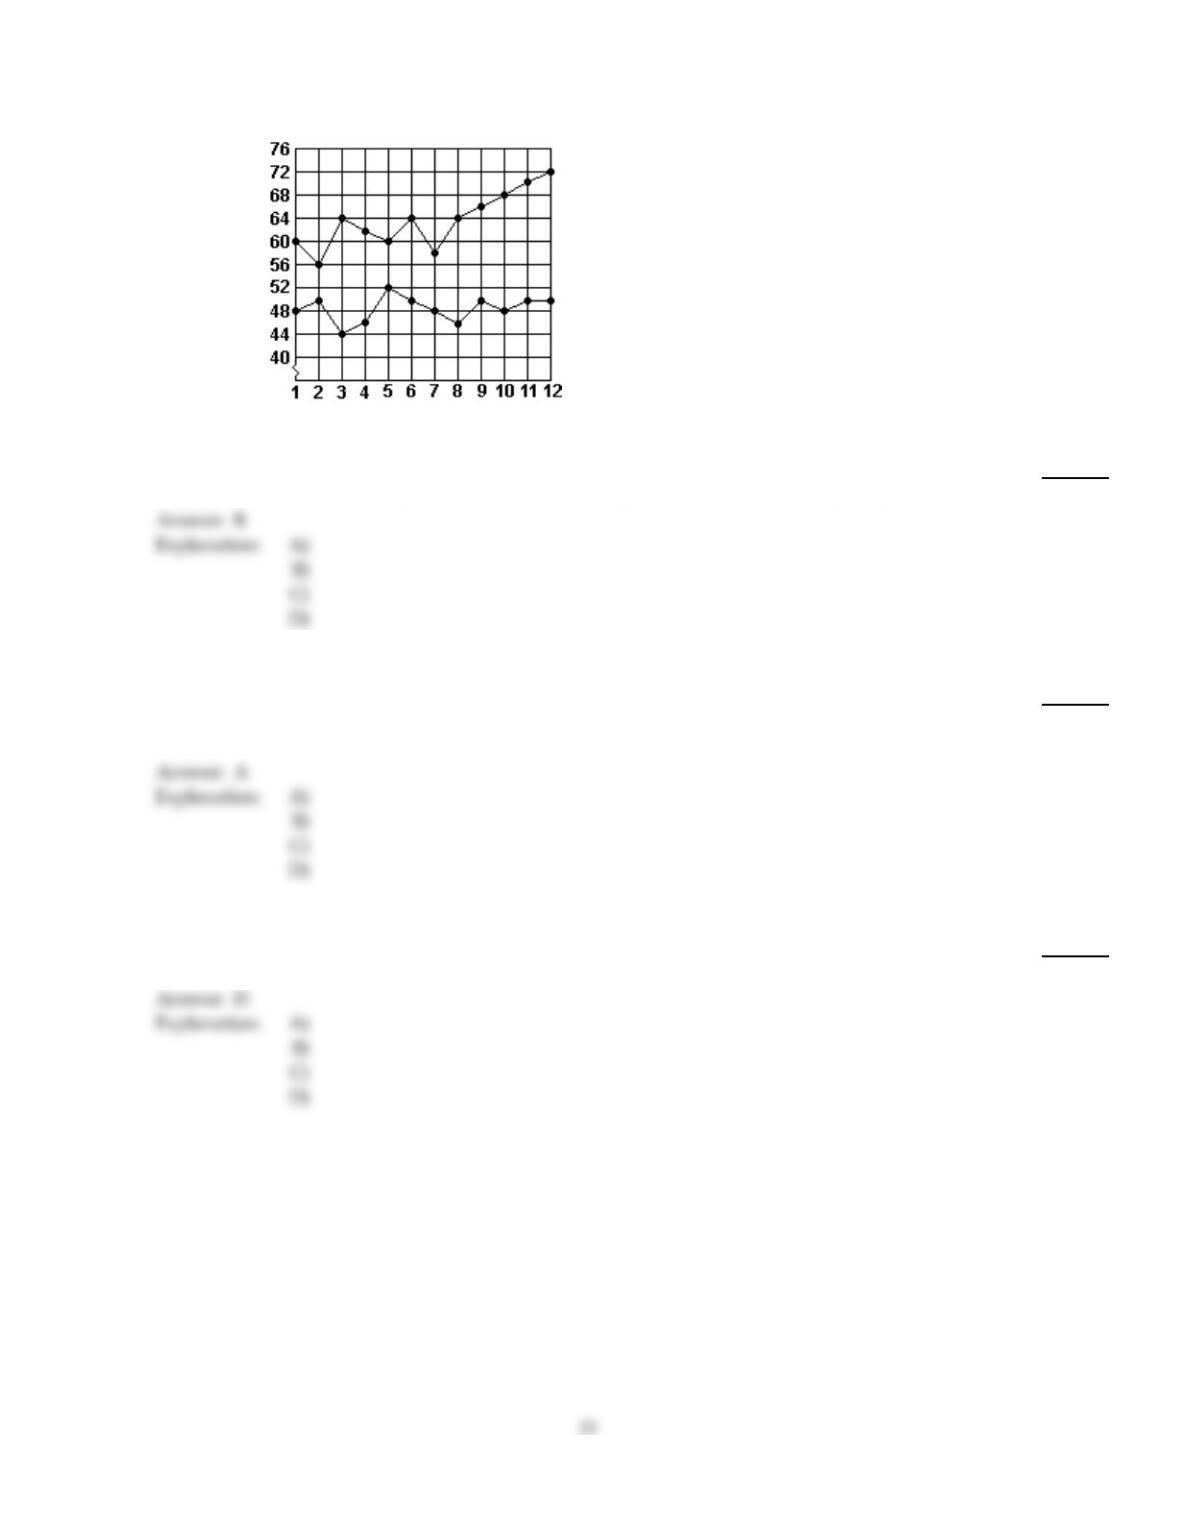
Use this graph to answer the question.
Sales
(thousands of dollars)
2010
2009
Month
28)
What were the sales in month 10 of 2010?
28)
A)
$70,000
B)
$68,000
C)
$66,000
D)
$50,000
Solve the following circle graph problems.
29)
If total expenses are $1300 and the cost of food is $260, how many degrees in a circle graph would
food represent?
29)
A)
72°
B)
54°
C)
90°
D)
60°
Find the median.
30)
Number of calls in queue: 40, 20, 8, 2, 26, 11, 24, 38, 32, 32
30)
A)
23
B)
24
C)
26
D)
25
Find the grade point average for the following student. Assume A = 4, B = 3, C = 2, D = 1, and F = 0. Round answer to the
nearest tenth.
31)
Credits Grade
3 C
1 B
5 A
5 A
31)
A)
8.3
B)
3.7
C)
2.3
D)
3.5
Find the mean. Round to the nearest tenth unless otherwise stated.
32)
Scores on an aptitude test: 508, 526, 340, 354, 580, 356, 354, 518, 470, 482
32)
A)
476
B)
448.8
C)
440
D)
458
Solve the problem.
33)
The five sales people at Southwest Appliances earned commissions last year of $16,000, $21,000,
$39,000, $18,000, and $34,000. Find the mean commission.
33)
A)
$25,600
B)
$26,880
C)
$28,160
D)
$24,320
12
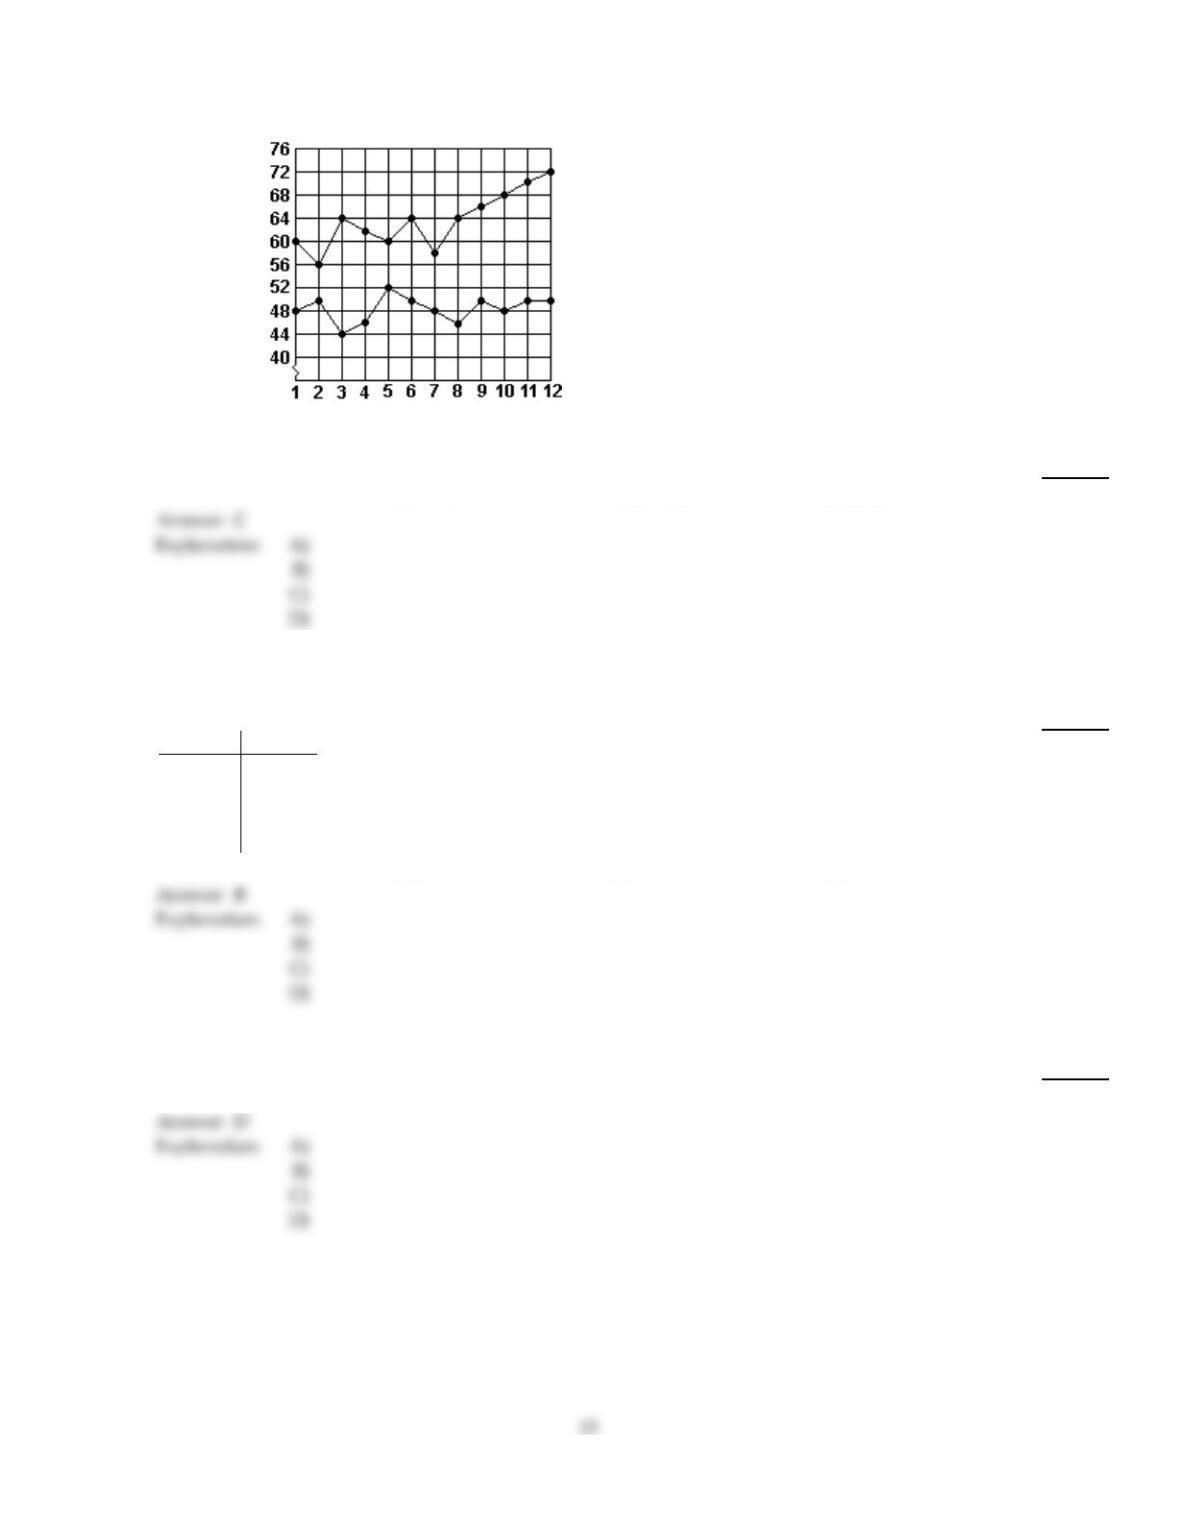
Use this graph to answer the question.
Sales
(thousands of dollars)
2010
2009
Month
34)
What were the total sales for 2010?
34)
A)
$578,000
B)
$72,000
C)
$764,000
D)
$60,000
Find the grade point average for the following student. Assume A = 4, B = 3, C = 2, D = 1, and F = 0. Round answer to the
nearest tenth.
35)
Credits Grade
5 B
1 B
5 B
3 B
35)
A)
10.5
B)
3.0
C)
3.6
D)
3.5
Find the mean. Round to the nearest tenth unless otherwise stated.
36)
Number enrolled in a night class: 11, 16, 14, 11, 19
36)
A)
11
B)
13
C)
17.8
D)
14.2
Find the mode or modes.
37)
7.18, 7.41, 7.56, 7.18, 7.88, 7.99, 7.62
37)
A)
7.56
B)
7.546
C)
7.41
D)
7.18
Find the weighted mean. Round to the nearest tenth.
38)
Value Frequency
16 6
21 15
23 19
29 10
33 10
38)
A)
25.3
B)
24.5
C)
28.3
D)
2.0
Find the mean. Round to the nearest tenth unless otherwise stated.
39)
Retirement ages of teachers: 54, 62, 62, 54, 67, 58, 62, 55, 50
39)
A)
57.6
B)
58
C)
57
D)
58.2
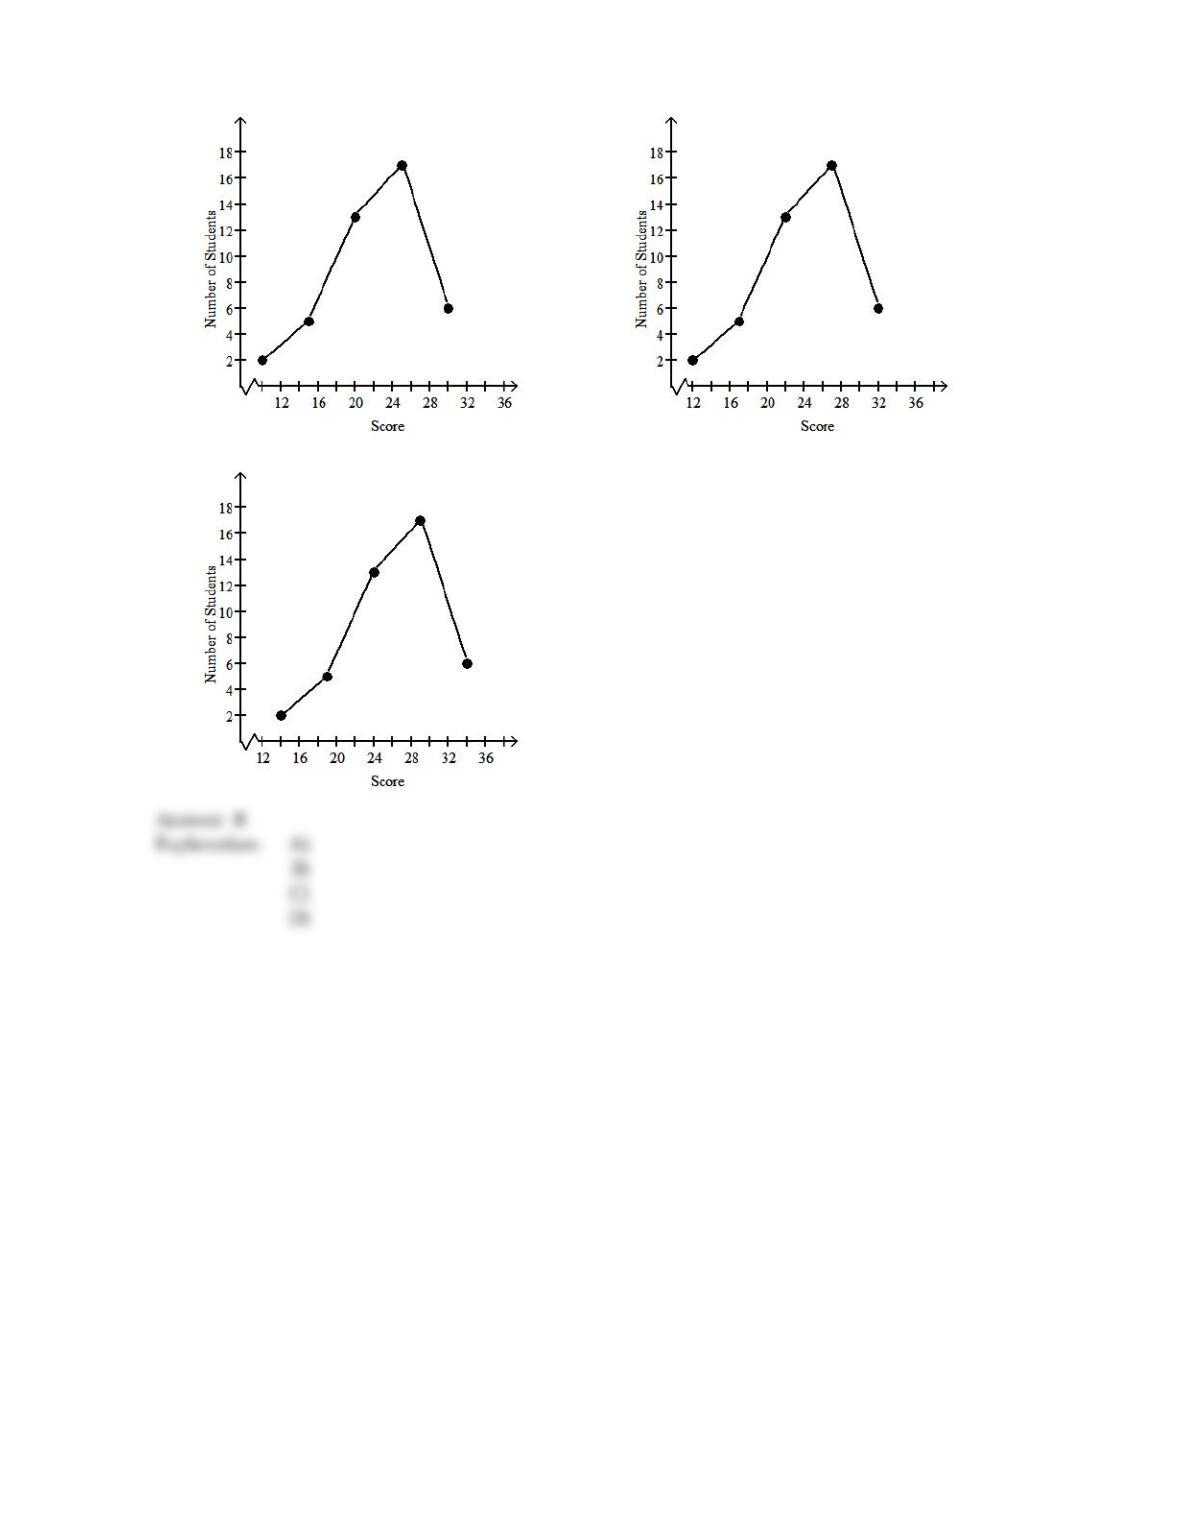
Make a line graph using the given frequencies.
40)
Student Quiz Scores
Quiz Scores Frequency
10–14 2
15–19 5
20–24 13
25–29 17
30–34 6
40)
14
A)
B)
C)
D)
None of the above
15
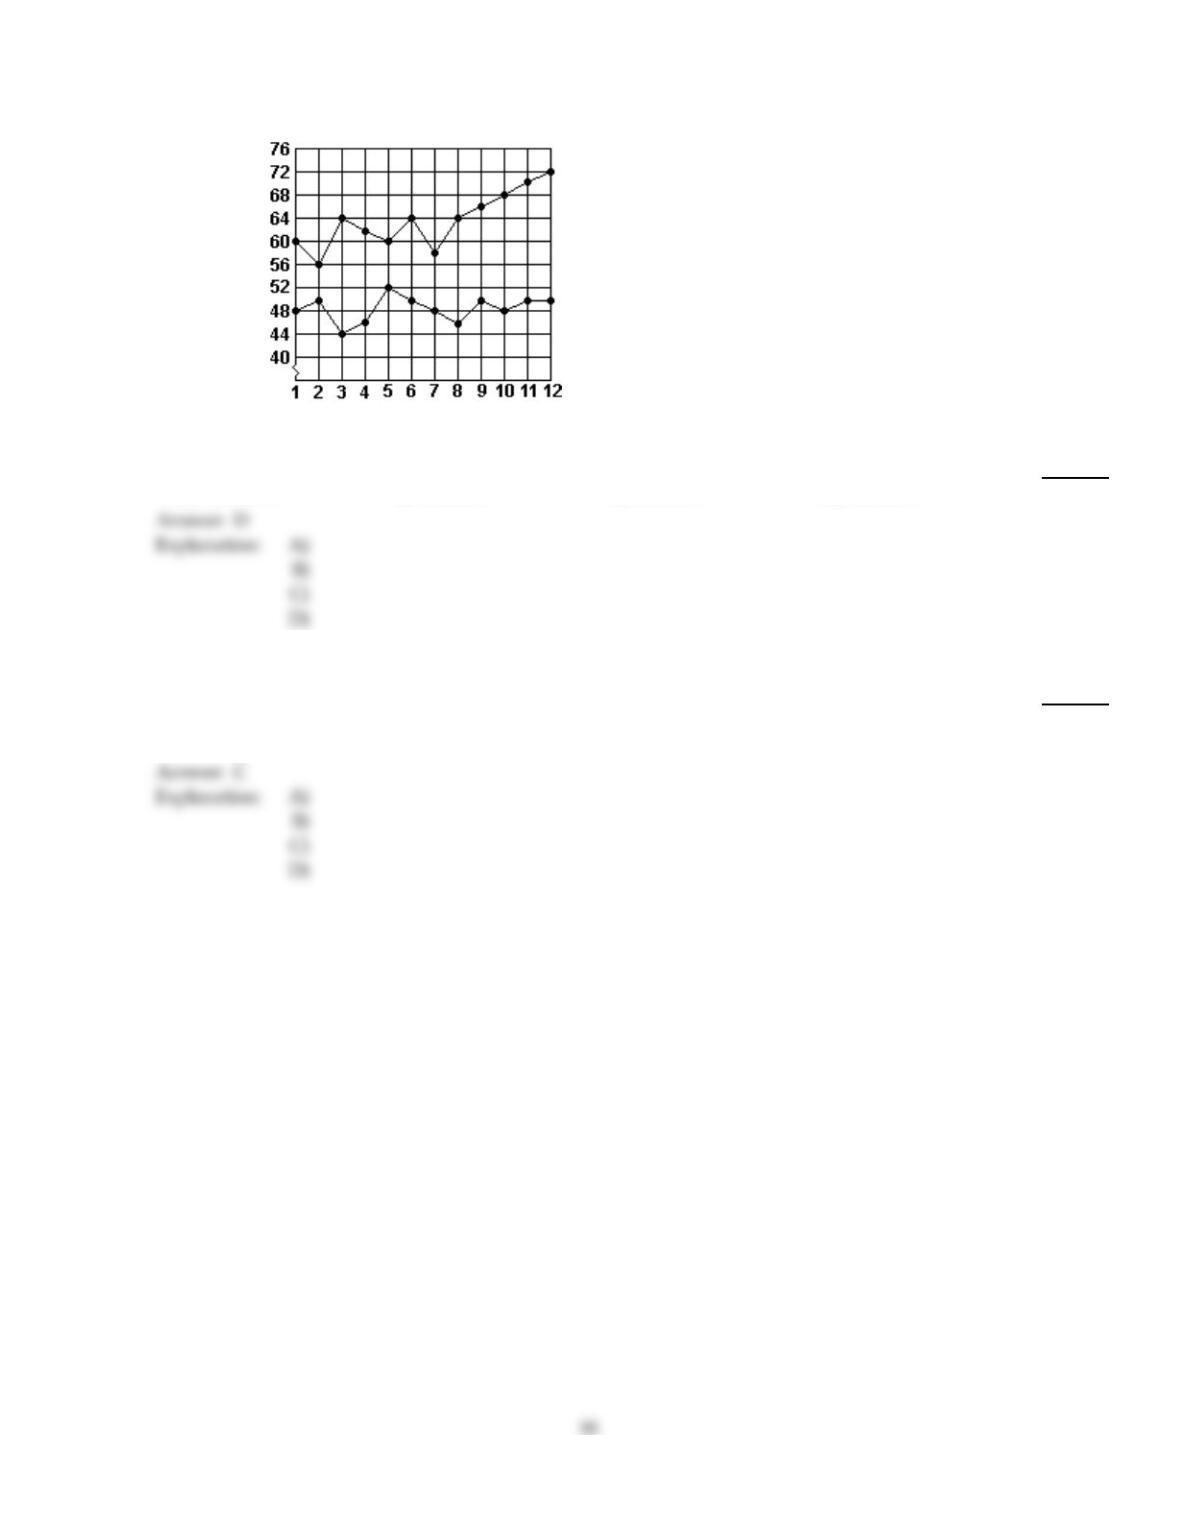
Use this graph to answer the question.
Sales
(thousands of dollars)
2010
2009
Month
41)
Which month in 2009 had the lowest sales?
41)
A)
Month 10
B)
Month 2
C)
Month 8
D)
Month 3
Find the mean. Round to the nearest tenth unless otherwise stated.
42)
Average number of defects: 8.0, 6.5, 9.0, 8.8, 8.3, 8.0, 8.8, 9.0, 6.5, 8.0, 8.8, 7.1, 8.3, 6.5, 6.5, 6.7,
8.3, 8.8
42)
A)
8.1
B)
8.3
C)
7.9
D)
7.5
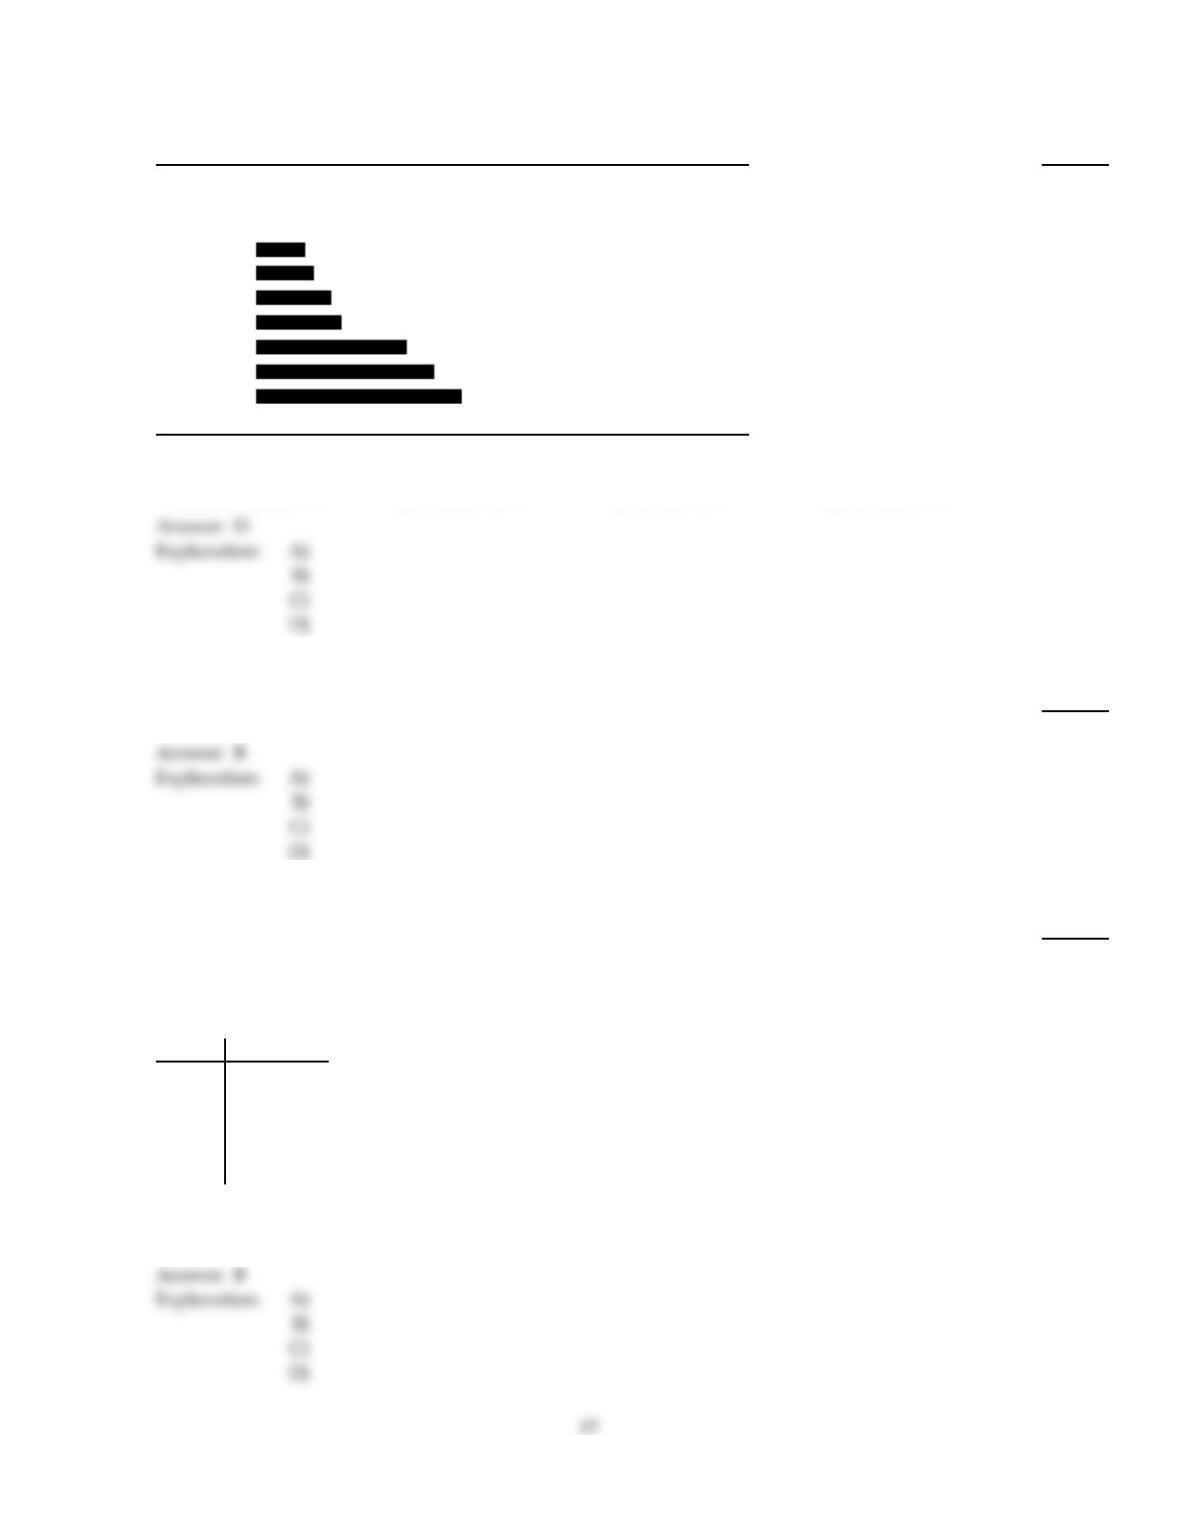
The bar graph shows the percent of income spent on leisure activities in various countries of the world. Use the graph to
answer the question.
43)
PERCENT OF HOUSEHOLD INCOME FOR LEISURE ACTIVITIES
China 5.7%
Australia 7.7%
France 9.7%
Germany 13.2%
Britain 20.1%
Japan 25.4%
USA 29.9%
In which country is the lowest percent of income spent on leisure activities? What percent is this?
43)
A)
Australia; 7.7%
B)
China; 94.3%
C)
USA; 70.1%
D)
China; 5.7%
Find the mean. Round to the nearest tenth unless otherwise stated.
44)
Number of days spent working out in a month: 3, 18, 10, 14, 1, 14, 1, 19
44)
A)
22
B)
10
C)
9
D)
11.4
Use the data to complete the table.
45)
On a 25–point math test student scores were as follows.
1 6 11 18 22 22 17 11 8 2
710 19 20 17 10 4 9 15 20
Score Frequency
0–4
5–9
10–14
15–19
20–24
45)
A)
Frequency: 3, 3, 5, 5, 4
B)
Frequency: 3, 4, 4, 5, 4
C)
Frequency: 3, 4, 4, 4, 5
D)
Frequency: 3, 4, 3, 6, 4
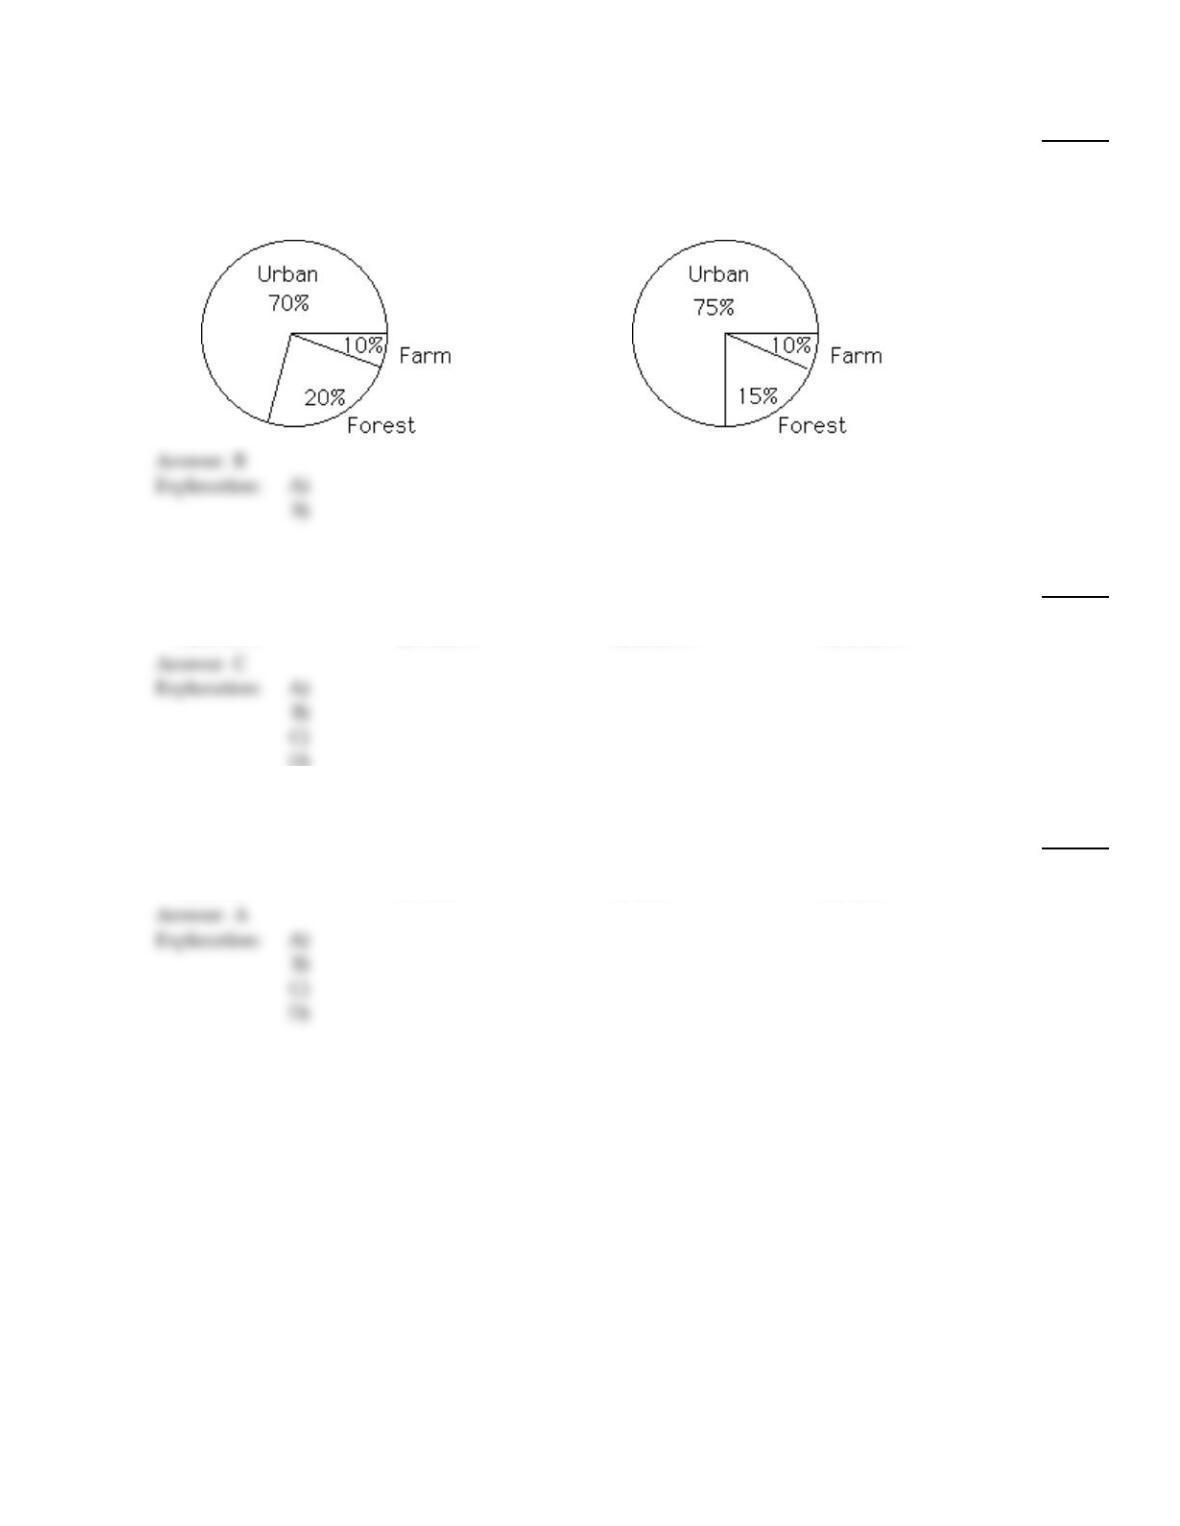
Describe the distributions with a pie chart.
46)
The following figures give the distribution of land (in acres) of a county containing 62,000 acres.
Forest Farm Urban
9300 6200 46,500
46)
A)
B)
Find the mean. Round to the nearest tenth unless otherwise stated.
47)
Annual salaries: $24,108, $22,089, $19,365, $26,451
Round to the nearest whole number.
47)
A)
$23,002
B)
$24,108
C)
$23,003
D)
$22,089
D)
Solve the following circle graph problems.
48)
If savings are represented by 45° on a circle graph showing all expenses, and the total expenses are
$1440, how much go into savings?
48)
A)
$180
B)
$300
C)
$120
D)
$240
D)
Make a line graph using the given frequencies.
18