98. Figure 4-8.
A company provided the following data:
Sales
$540,000
Variable costs
$378,000
Fixed costs
$120,000
Expected production and sales in units
40,000
Refer to Figure 4-8. How much sales in dollars is necessary to generate a profit of $30,000?
99. Figure 4-4.
Yerke Company makes jungle gyms and tree houses for children. For jungle gyms, the price is $120 and
variable expenses are $90 per unit. For tree houses, the price is $200 and variable expenses are $100. Total
fixed expenses are $253,750. Last year, Yerke sold 12,000 gyms and 4,000 tree houses.
Refer to Figure 4-4. Using the lowest whole numbers, what is the sales mix of gyms and tree houses?
100. Figure 4-4.
Yerke Company makes jungle gyms and tree houses for children. For jungle gyms, the price is $120 and
variable expenses are $90 per unit. For tree houses, the price is $200 and variable expenses are $100. Total
fixed expenses are $253,750. Last year, Yerke sold 12,000 gyms and 4,000 tree houses.
Refer to Figure 4-4. Now suppose that Yerke expects tree house demand to increase from 4,000 to 8,000 units.
What is the new contribution margin ratio (rounded to two decimal places)?
101. Figure 4-4.
Yerke Company makes jungle gyms and tree houses for children. For jungle gyms, the price is $120 and
variable expenses are $90 per unit. For tree houses, the price is $200 and variable expenses are $100. Total
fixed expenses are $253,750. Last year, Yerke sold 12,000 gyms and 4,000 tree houses.
Refer to Figure 4-4. Now suppose that Yerke expects tree house demand to increase from 4,000 to 8,000 units.
What is the number of jungle gyms sold at break-even?
102. Figure 4-4.
Yerke Company makes jungle gyms and tree houses for children. For jungle gyms, the price is $120 and
variable expenses are $90 per unit. For tree houses, the price is $200 and variable expenses are $100. Total
fixed expenses are $253,750. Last year, Yerke sold 12,000 gyms and 4,000 tree houses.
Refer to Figure 4-4. Now suppose that Yerke expects tree house demand to increase from 4,000 to 8,000 units.
What is the number of tree houses sold at break-even?
103. Figure 4-4.
Yerke Company makes jungle gyms and tree houses for children. For jungle gyms, the price is $120 and
variable expenses are $90 per unit. For tree houses, the price is $200 and variable expenses are $100. Total
fixed expenses are $253,750. Last year, Yerke sold 12,000 gyms and 4,000 tree houses.
Refer to Figure 4-4. Now suppose that Yerke expects tree house demand to increase from 4,000 to 8,000 units.
What is the sales revenue at break-even?
104. Figure 4-5.
Standlar Company makes wireless speakers. The standard model price is $360 and variable expenses are $210.
The deluxe model price is $500 and variable expenses are $300. The superior model price is $1,600 and
variable expense per unit is $600. Total fixed expenses are $300,000. Generally, Standlar sells 8 standard
models and 4 deluxe models for every superior model sold.
Using the sales mix stated in the facts from Figure 4-5 to form a package, what is the total package
contribution margin?
105. Figure 4-5.
Standlar Company makes wireless speakers. The standard model price is $360 and variable expenses are $210.
The deluxe model price is $500 and variable expenses are $300. The superior model price is $1,600 and
variable expense per unit is $600. Total fixed expenses are $300,000. Generally, Standlar sells 8 standard
models and 4 deluxe models for every superior model sold.
Refer to Figure 4-5. What is the number of standard models sold at break-even?
106. Figure 4-5.
Standlar Company makes wireless speakers. The standard model price is $360 and variable expenses are $210.
The deluxe model price is $500 and variable expenses are $300. The superior model price is $1,600 and
variable expense per unit is $600. Total fixed expenses are $300,000. Generally, Standlar sells 8 standard
models and 4 deluxe models for every superior model sold.
Refer to Figure 4-5. What is the number of deluxe models sold at break-even?
107. Figure 4-5.
Standlar Company makes wireless speakers. The standard model price is $360 and variable expenses are $210.
The deluxe model price is $500 and variable expenses are $300. The superior model price is $1,600 and
variable expense per unit is $600. Total fixed expenses are $300,000. Generally, Standlar sells 8 standard
models and 4 deluxe models for every superior model sold.
Refer to Figure 4-5. What is the number of superior models sold at break-even?
108. Figure 4-5.
Standlar Company makes wireless speakers. The standard model price is $360 and variable expenses are $210.
The deluxe model price is $500 and variable expenses are $300. The superior model price is $1,600 and
variable expense per unit is $600. Total fixed expenses are $300,000. Generally, Standlar sells 8 standard
models and 4 deluxe models for every superior model sold.
Refer to Figure 4-5. What is the overall sales revenue at break-even?
109. Melody Company sells a product for $14, variable costs are $10 per unit, and total fixed costs are $5,040.
If Melody wants to earn an operating profit of $880, how many units must it sell?
110. The formula used to calculate the number of units needed in order to earn a target income is
111. The formula that can be used to calculate sales dollars necessary in order to earn a target income is
112. Assume the following information:
Selling price per unit
$150
Contribution margin ratio
40%
Total fixed costs
$225,000
How many units must be sold to generate a profit of $45,000?
113. Which is the equation for operating income?
114. Rachel Company sells office chairs at $350 each, incurs variable cost per unit of $100, and has a total fixed
expense of $30,000. How many units must be sold to achieve a target operating income of $55,000?
115. A graph that depicts the relationships among cost, volume and profits (operating income) is the
116. A profit-volume graph differs from a cost-volume-profits graph in that a profit-volume graph displays
only
117. On a cost-volume-profit graph, the break-even point is where
118. Which of the following is not an assumption used to prepare a cost-volume-profit graph?
119. Which of the following is not an assumption of a cost-volume-profit analysis?
120. A profit-volume graph visually portrays the relationship between
121. The profit-volume graph
122. The cost-volume-profit graph
123. Fixed expenses that cannot be directly traced to individual segments are called
124. Sales mix is the relative combination of
125. Sales mix can be expressed in terms of
126. In order for the break-even computation to be meaningful to management, sales mix should be computed
using the
127. If sales remain the same and the margin of safety increases, which of the following is true?
128. Information about the Harmon Company’s two products includes:
Product X
Product Y
Unit selling price
$9.00
$9.00
Unit variable costs:
Manufacturing
$5.25
$6.75
Selling
.75
.75
Total
$6.00
$7.50
Monthly fixed costs are as
follows:
Manufacturing
$ 82,500
Selling and administrative
45,000
Total
$127,500
What is the total monthly sales volume in units required to break even when the sales mix in units is 70 percent Product X and 30 percent Product
Y?
129. Product 1 has a contribution margin of $6.00 per unit, and Product 2 has a contribution margin of $7.50 per
unit. Total fixed costs are $300,000. Sales mix and total volume varies from one period to another. Which of the
following is true?
130. The following data pertain to the three products produced by Alberts Corporation:
A
B
C
Selling price per unit
$5.00
$7.00
$6.00
Variable costs per unit
4.00
5.00
3.00
Contribution margin per unit
$1.00
$2.00
$3.00
Fixed costs are $90,000 per month.
Sixty percent of all units sold are Product A, 30 percent are Product B, and 10 percent are Product C.
What is the monthly break-even point for total units?
131. If actual sales equal break-even sales
132. The units sold or expected to be sold or sales revenue earned or expected to be earned above the break-
even volume is called
133. The margin of safety in dollars is
134. ____ can be measured for a given level of sales by taking the ratio of contribution margin to operating
income.
135. Which of the following can be considered a measure of risk in cost-volume-profit analysis?
136. Sales can decline by how much before losses are incurred?
137. Firm X and Firm Y are competitors within the same industry. Firm X produces its product using large
amounts of direct labor. Firm Y has replaced direct labor with investment in machinery. Projected sales for both
firms are 15% less than in the prior year. Which statement regarding projected profits is true?
138. Operating leverage is
139. A “what-if” technique that examines the impact of changes in underlying assumptions on an answer is
140. Biggers Company expects the following results for the next accounting period:
Sales
$240,000
Variable costs
$135,000
Fixed costs
$ 40,000
Expected production and sales in units
3,000
The sales manager believes sales could be increased by 400 units if advertising expenditures were increased by $10,000. If advertising expenditures
are increased and sales increase by 400 units, the effect on operating income will be a(n)
141. Degree of operating leverage is calculated as
142. Operating leverage is the relative mix of
143. Figure 4-6.
Shorter Company had originally expected to earn operating income of $130,000 in the coming year. Shorter’s
degree of operating leverage is 2.4. Recently, Shorter revised its plans and now expects to increase sales by
20% next year.
Refer to Figure 4-6. What is the percent change in operating income expected by Shorter in the coming year?
144. Figure 4-6.
Shorter Company had originally expected to earn operating income of $130,000 in the coming year. Shorter’s
degree of operating leverage is 2.4. Recently, Shorter revised its plans and now expects to increase sales by
20% next year.
Refer to Figure 4-6. What is Shorter’s revised expected operating income for the coming year?
145. Dance Unlimited plans to sell 10,000 ballet shoes at $50 each in the coming year. Unit variable cost is
$30 and total fixed cost equals $65,000.
Required:
A.) Calculate the break-even in ballet shoes.
B.) Calculate the break-even in sales dollars.
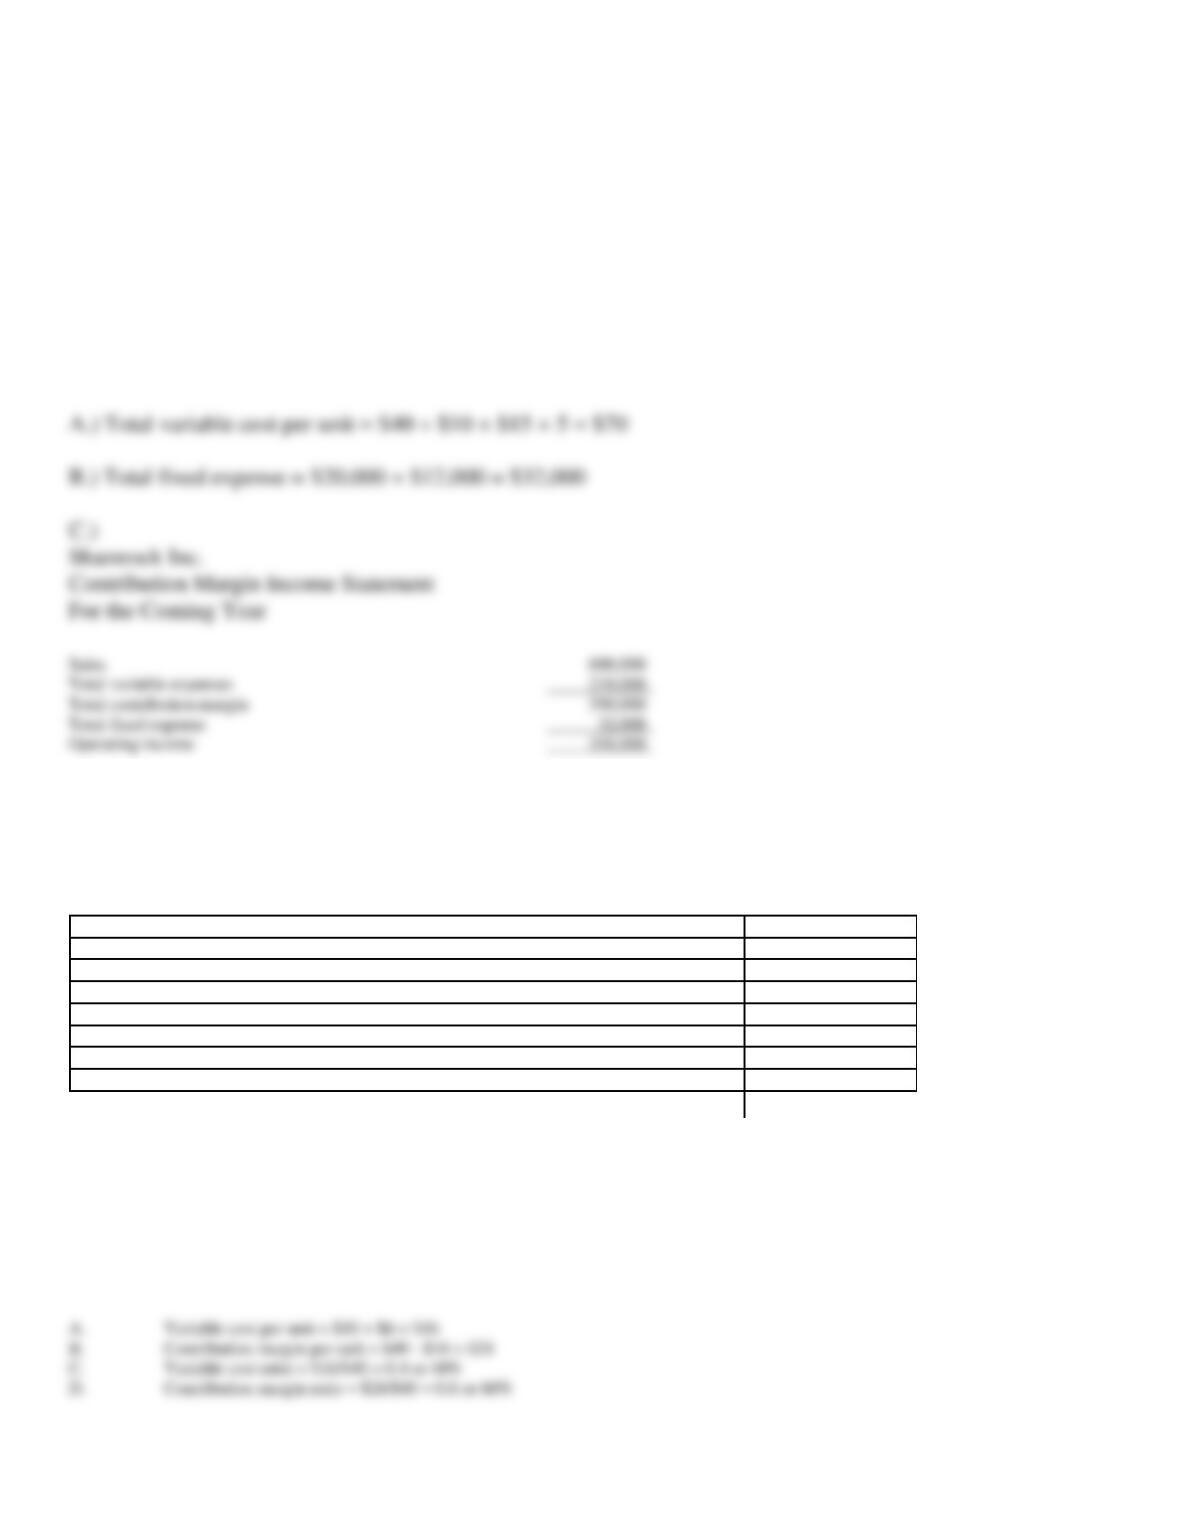
146. Shamrock Inc. plans to sell 3,000 Irish sweaters for $200 each in the coming year. Product costs include:
Direct materials per sweater
$40
Direct labor per sweater
10
Variable overhead per sweater
15
Total fixed factory overhead
20,000
Variable selling expenses are $5 per sweater and fixed selling and administrative expenses total $12,000.
Required:
A.) Calculate the total variable cost per unit.
B.) Calculate the total fixed expenses for the year.
C.) Prepare a contribution margin income statement for Shamrock Inc. for the coming year.
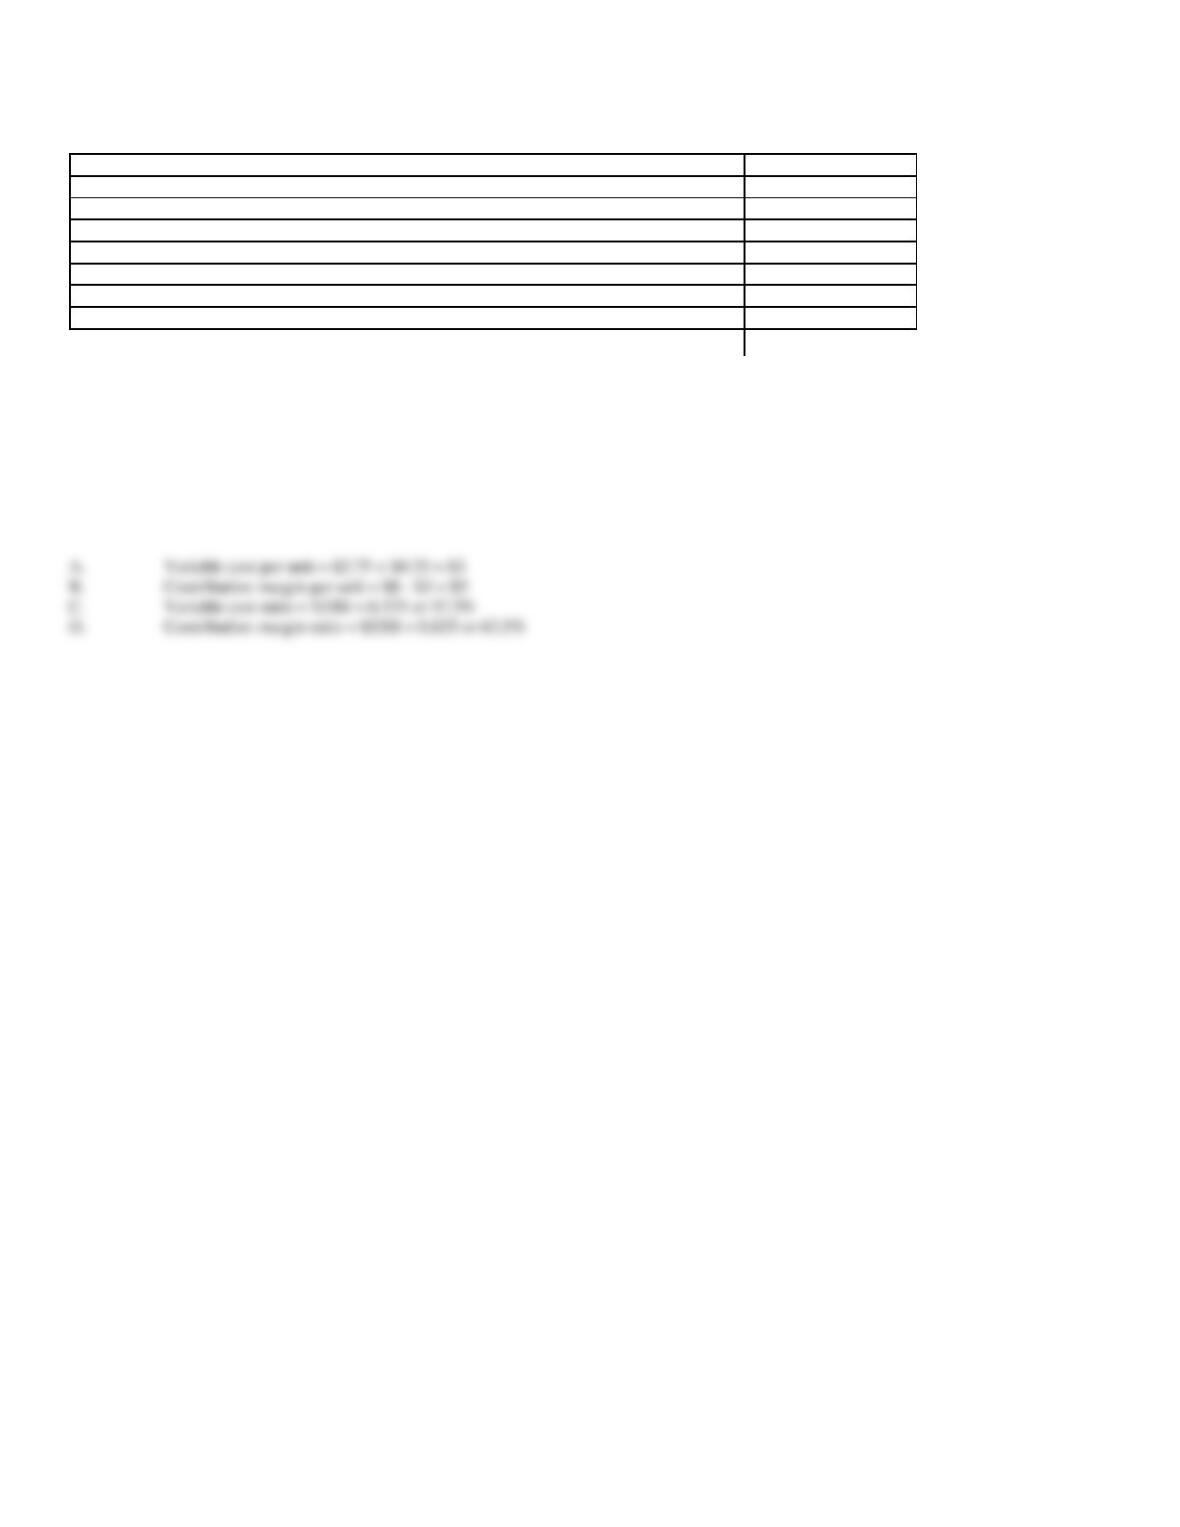
147. Newman Company expects to produce and sell 2,000 units next month. Data on costs follows:
Per unit costs:
Selling price
$40
Variable manufacturing costs
$10
Variable selling costs
$ 6
Total costs:
Fixed manufacturing costs
$16,000
Fixed selling costs
$ 8,000
Required:
A.
What is the variable cost per unit?
B.
What is contribution margin per unit?
C.
What is the variable cost ratio?
D.
What is the contribution margin ratio?
A.
Variable cost per unit = $10 + $6 = $16
Sales
600,000
Total variable expenses
210,000
Total contribution margin
390,000
Total fixed expense
32,000
Operating income
358,000
148. McCallen Company expects to produce and sell 500 units next month. Data on costs follows:
Per unit costs:
Selling price
$8
Variable manufacturing costs
$2.75
Variable selling costs
$0.25
Total costs:
Fixed manufacturing costs
$1,000
Fixed selling costs
$ 125
Required:
A.
What is the variable cost per unit?
B.
What is contribution margin per unit?
C.
What is the variable cost ratio?
D.
What is the contribution margin ratio?
A.
Variable cost per unit = $2.75 + $0.25 = $3
Contribution margin per unit = $8 – $3 = $5
C.
Variable cost ratio = $3/$8 = 0.375 or 37.5%
D.
Contribution margin ratio = $5/$8 = 0.625 or 62.5%