176. The comparative balance sheet of Ramos Company appears below:
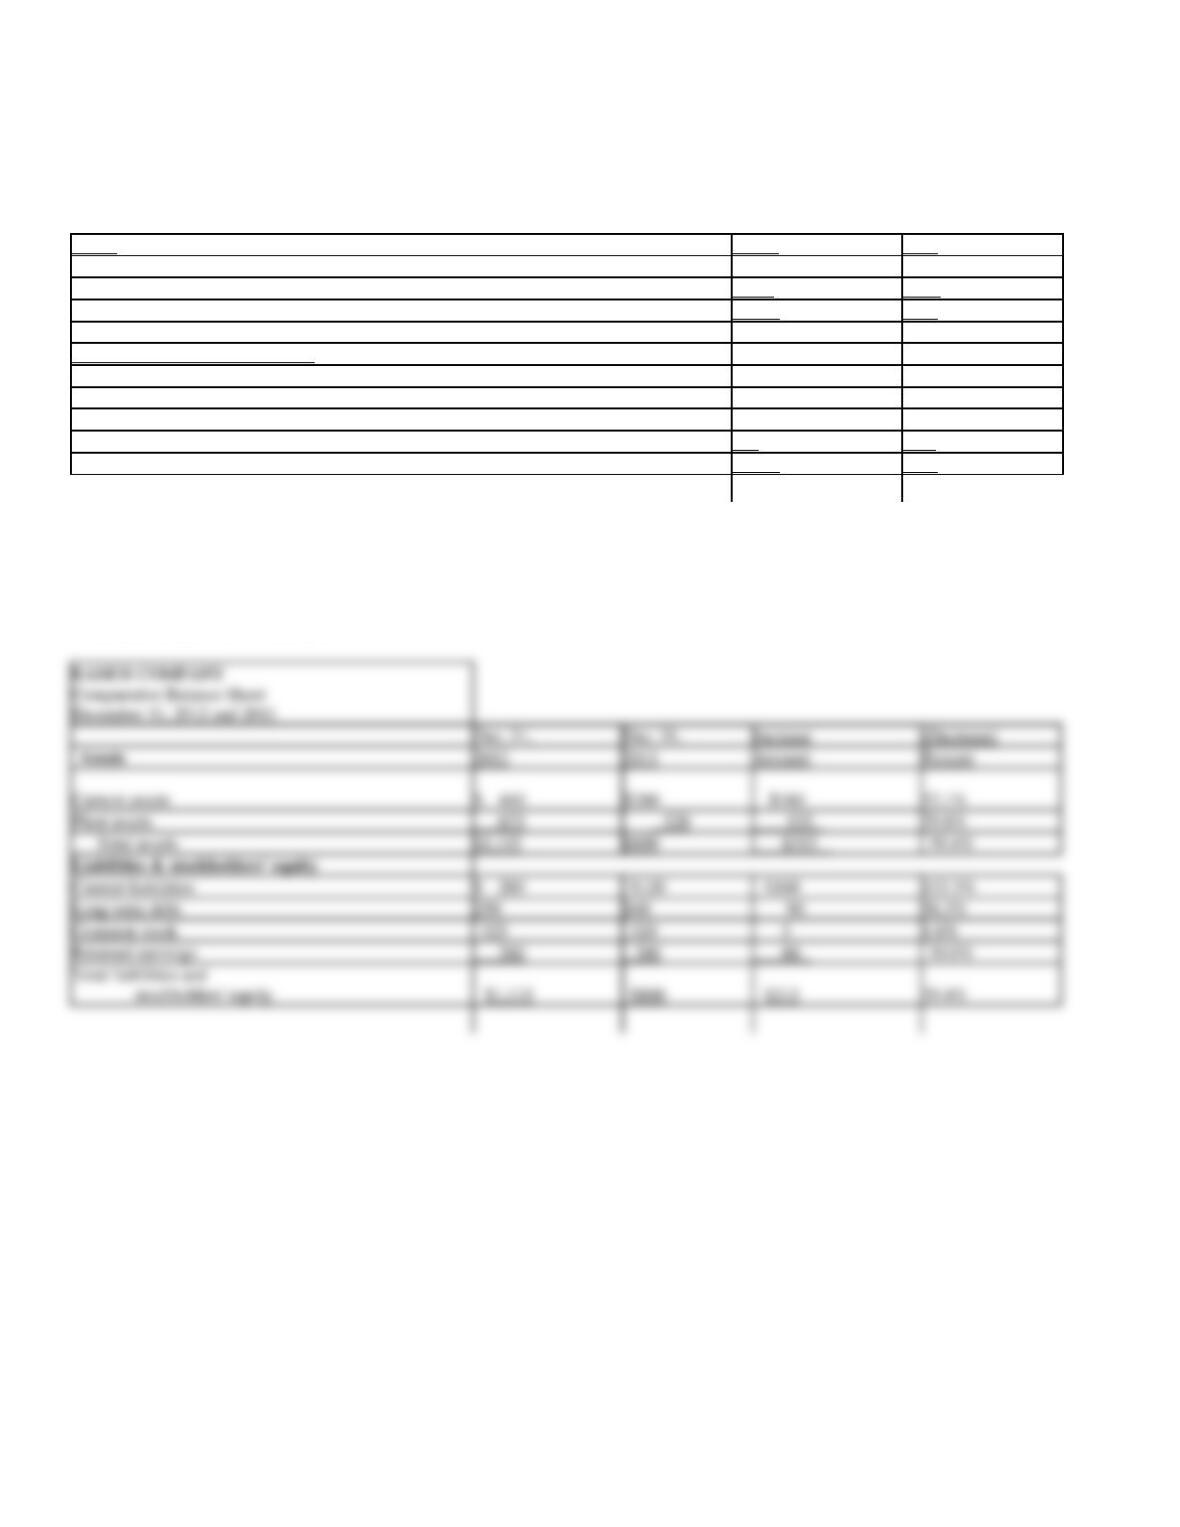
(a) RAMOS COMPANY
Comparative Balance Sheet
December 31, 2012 and 2011
Assets
2012
2011
Current assets
$ 440
$280
Plant assets
675
520
Total assets
$1,115
$800
Liabilities and stockholders’ equity
Current liabilities
$ 280
$120
Long-term debt
250
160
Common stock
325
320
Retained earnings
260
200
Total liabilities and stockholders’ equity
$1,115
$800
Instructions
(a)
Using horizontal analysis, show the percentage change for each balance sheet item using 2011 as a base year.
(b)
Using vertical analysis, prepare a common size comparative balance sheet.
Round percentage to one decimal place.
Dec. 31,
Dec. 31,
Increase
(Decrease)
2012
2011
Amount
Percent
Plant assets
675
520
155
29.8%
Total assets
$1,115
$800
$315
39.4%
Current liabilities
$ 280
$120
$160
133.3%
Long-term debt
56.3%
Common stock
325
1.6%
Retained earnings
260
200
30.0%
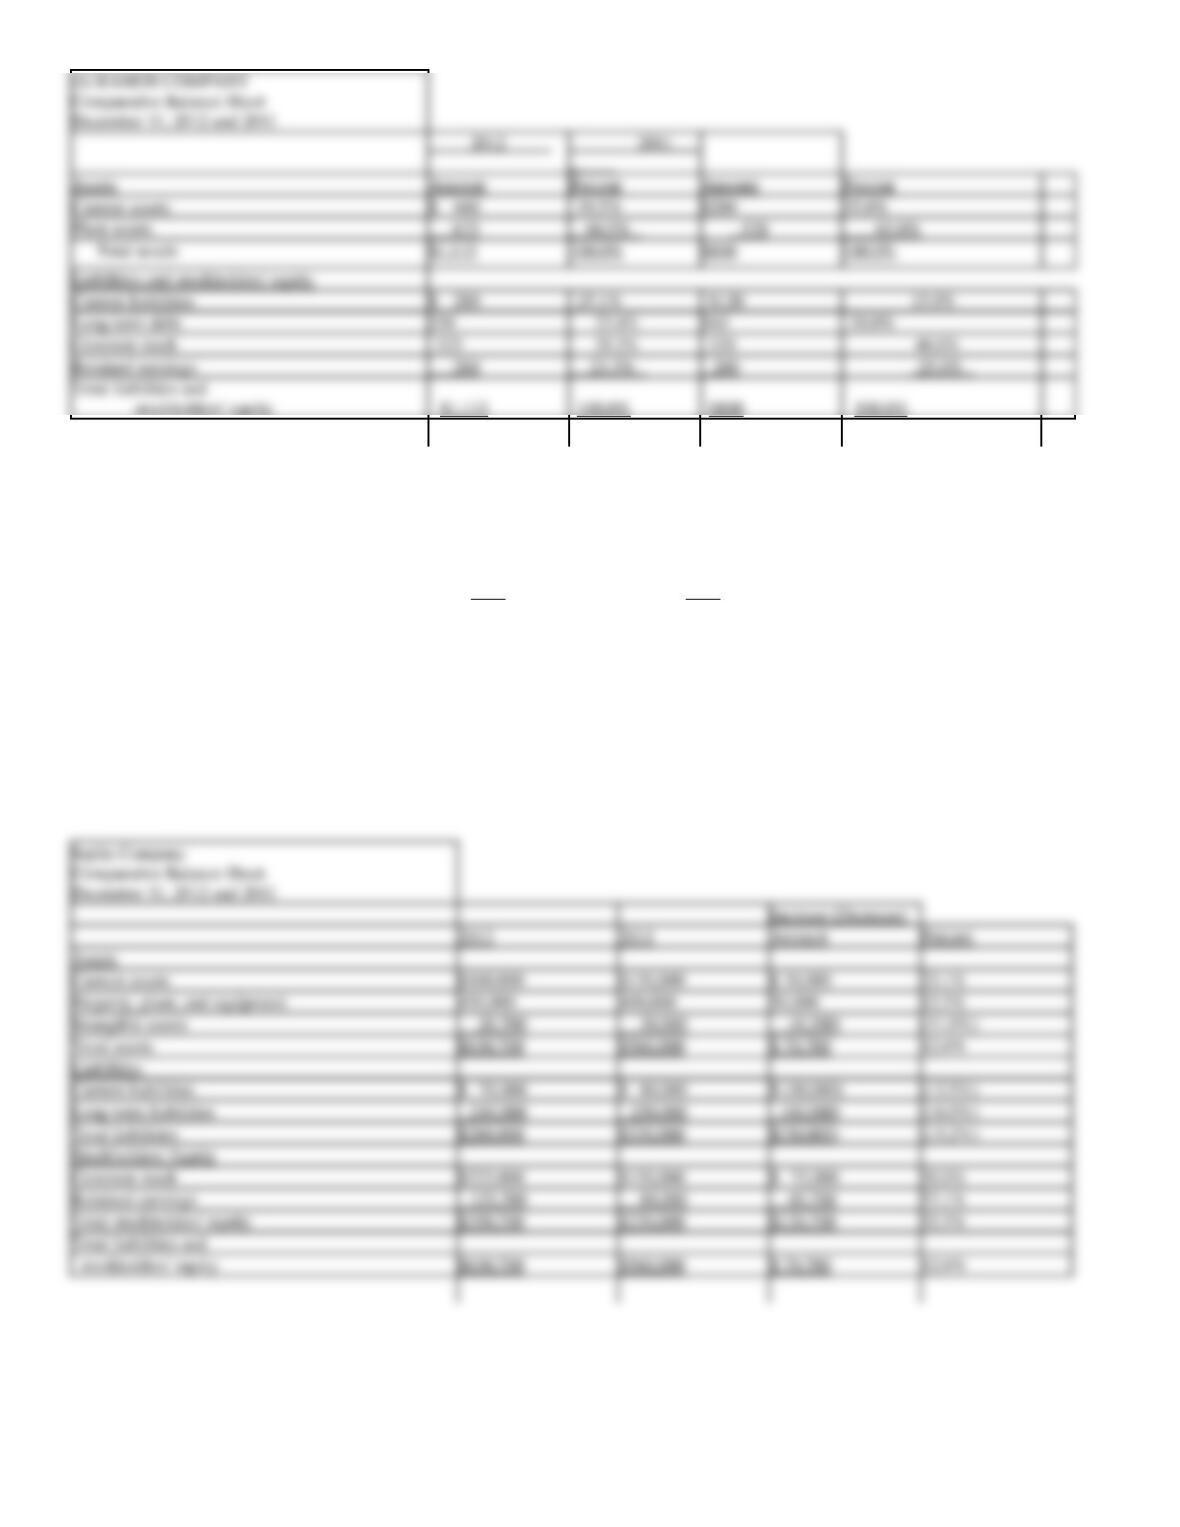
177. Condensed data taken from the ledger of Joplin Company at December 31, 2012 and 2011, are as follows:
2012
2011
Current assets
$160,000
$130,000
Property, plant, and equipment
450,000
400,000
Intangible assets
20,700
30,000
Current liabilities
70,000
80,000
Long-term liabilities
210,000
250,000
Common stock
225,000
150,000
Retained earnings
125,700
80,000
Prepare a comparative balance sheet, with horizontal analysis, for December 31, 2012 and 2011. (Round percents to one decimal point.)
Increase (Decrease)
2012
2011
Amount
Percent
Assets
Current assets
$160,000
$130,000
$ 30,000
23.1%
Property, plant, and equipment
450,000
400,000
50,000
12.5%
Intangible assets
20,700
30,000
(9,300)
(31.0%)
Total assets
$630,700
$560,000
$ 70,700
12.6%
Liabilities
Current liabilities
$ 70,000
$ 80,000
$ (10,000)
(12.5%)
Long-term liabilities
210,000
250,000
(40,000)
(16.0%)
Total liabilities
$280,000
$330,000
$(50,000)
(15.2%)
Stockholders’ Equity
Common stock
$225,000
$150,000
$ 75,000
50.0%
Retained earnings
125,700
80,000
45,700
57.1%
Total stockholders’ equity
$350,700
$230,000
$120,700
52.5%
Total liabilities and
stockholders’ equity
$630,700
$560,000
$ 70,700
12.6%
_
Assets
Amount
Percent
Amount
Percent
Current assets
$ 440
39.5%
$280
35.0%
Plant assets
675
60.5%
520
65.0%
Liabilities and stockholders’ equity
Current liabilities
$ 280
25.1%
$120
15.0%
Long-term debt
22.4%
20.0%
Common stock
29.2%
40.0%
Retained earnings
260
23.3%
200
25.0%
178. Revenue and expense data for Martinez Company are as follows:
2012
2011
Administrative expenses
$37,000
$20,000
Cost of goods sold
350,000
320,000
Income tax
40,000
32,000
Net sales
800,000
700,000
Selling expenses
150,000
110,000
(a)
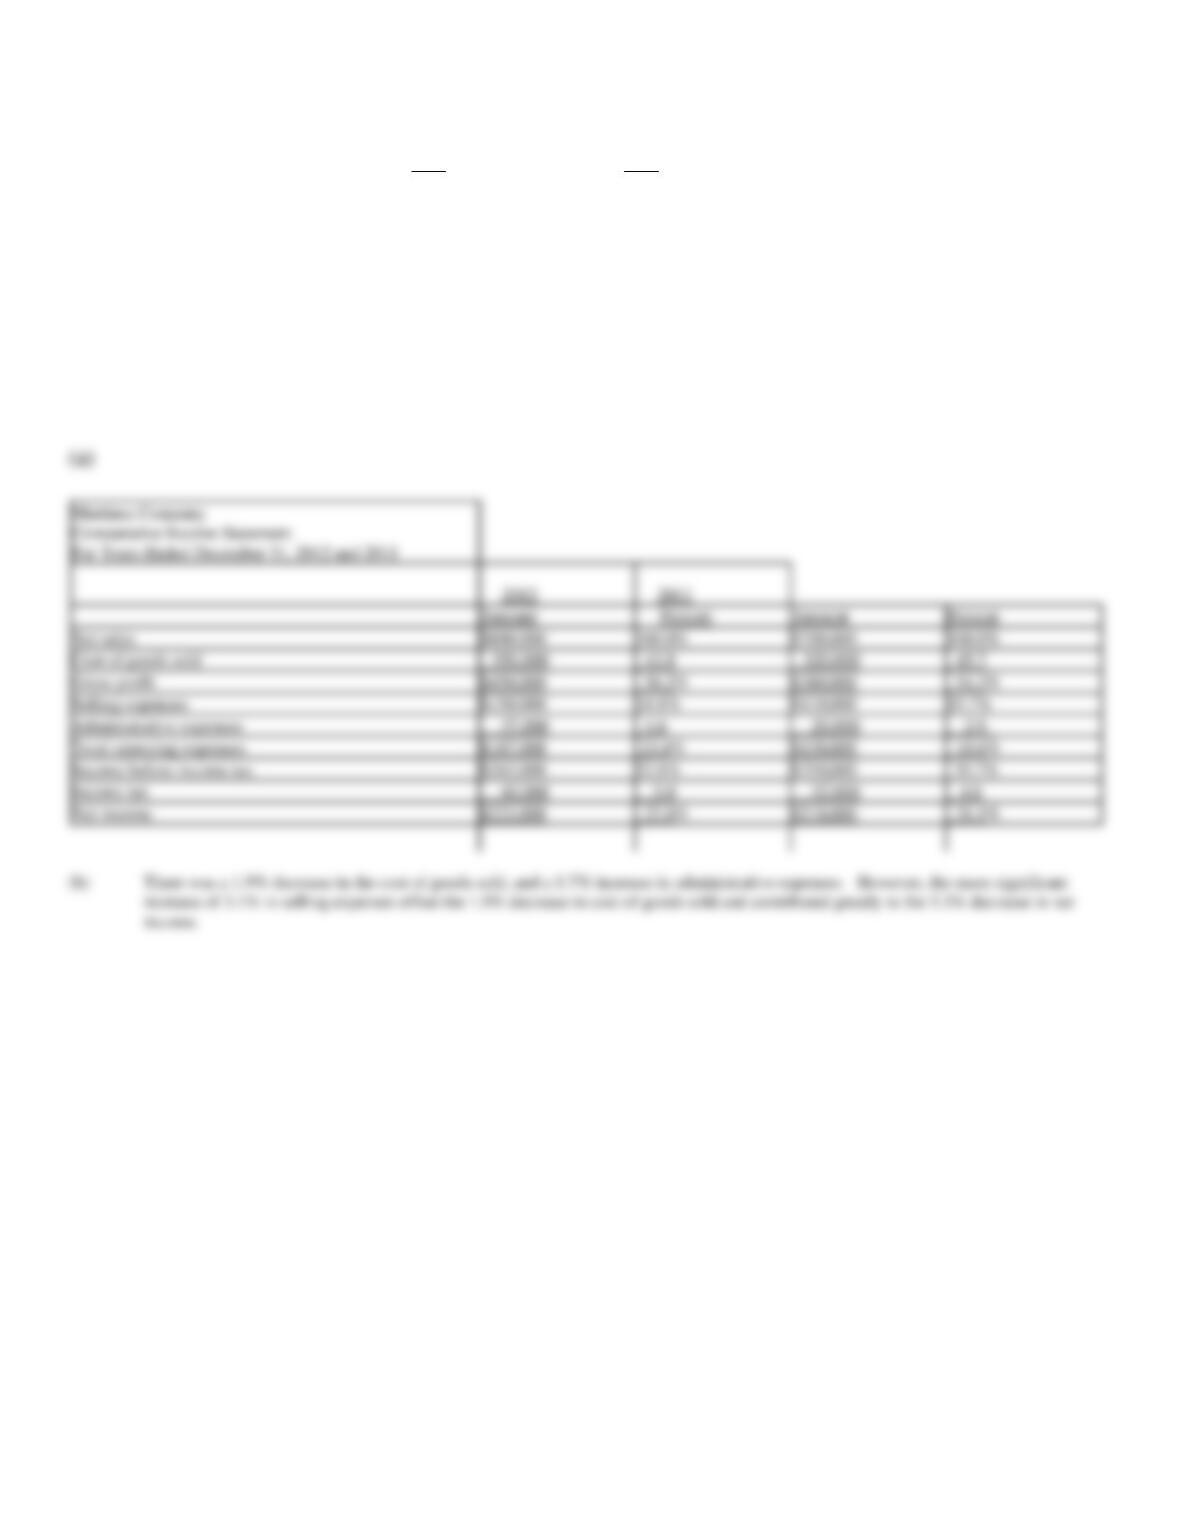
Prepare a comparative income statement, with vertical analysis, stating each item for both 2012 and 2011 as a percent of sales.
(b)
Comment upon significant changes disclosed by the comparative income statement.
Round percentage to one decimal place.
Amount
Percent
Amount
Percent
Net sales
$800,000
100.0%
$700,000
100.0%
Cost of goods sold
350,000
43.8
320,000
45.7
Gross profit
$450,000
56.2%
$380,000
54.3%
Selling expenses
$150,000
18.8%
$110,000
15.7%
Administrative expenses
37,000
4.6
20,000
2.9
Total operating expenses
$187,000
23.4%
$130,000
18.6%
Income before income tax
$263,000
32.8%
$250,000
35.7%
Income tax
40,000
5.0
32,000
4.6
Net income
$223,000
27.8%
$218,000
31.1%
179. The following data are taken from the balance sheet at the end of the current year. Determine the (a)
working capital, (b) current ratio, and (c) quick ratio. Present figures used in your computations. Round ratios
to the nearest tenth.
Accounts payable
$245,000
Accounts receivable
210,000
Accrued liabilities
4,000
Cash
114,000
Income tax payable
10,000
Inventory
240,000
Temporary investments
350,000
Notes payable, short-term
85,000
Prepaid expenses
15,000
Property, plant, and equipment
375,000
180. The following data are taken from the financial statements:
Current
Preceding
Year
Year
Net sales
$3,600,000
$4,000,000
Cost of goods sold
2,000,000
2,700,000
Average inventory
332,000
328,000
Inventory, end of year
372,000
347,000
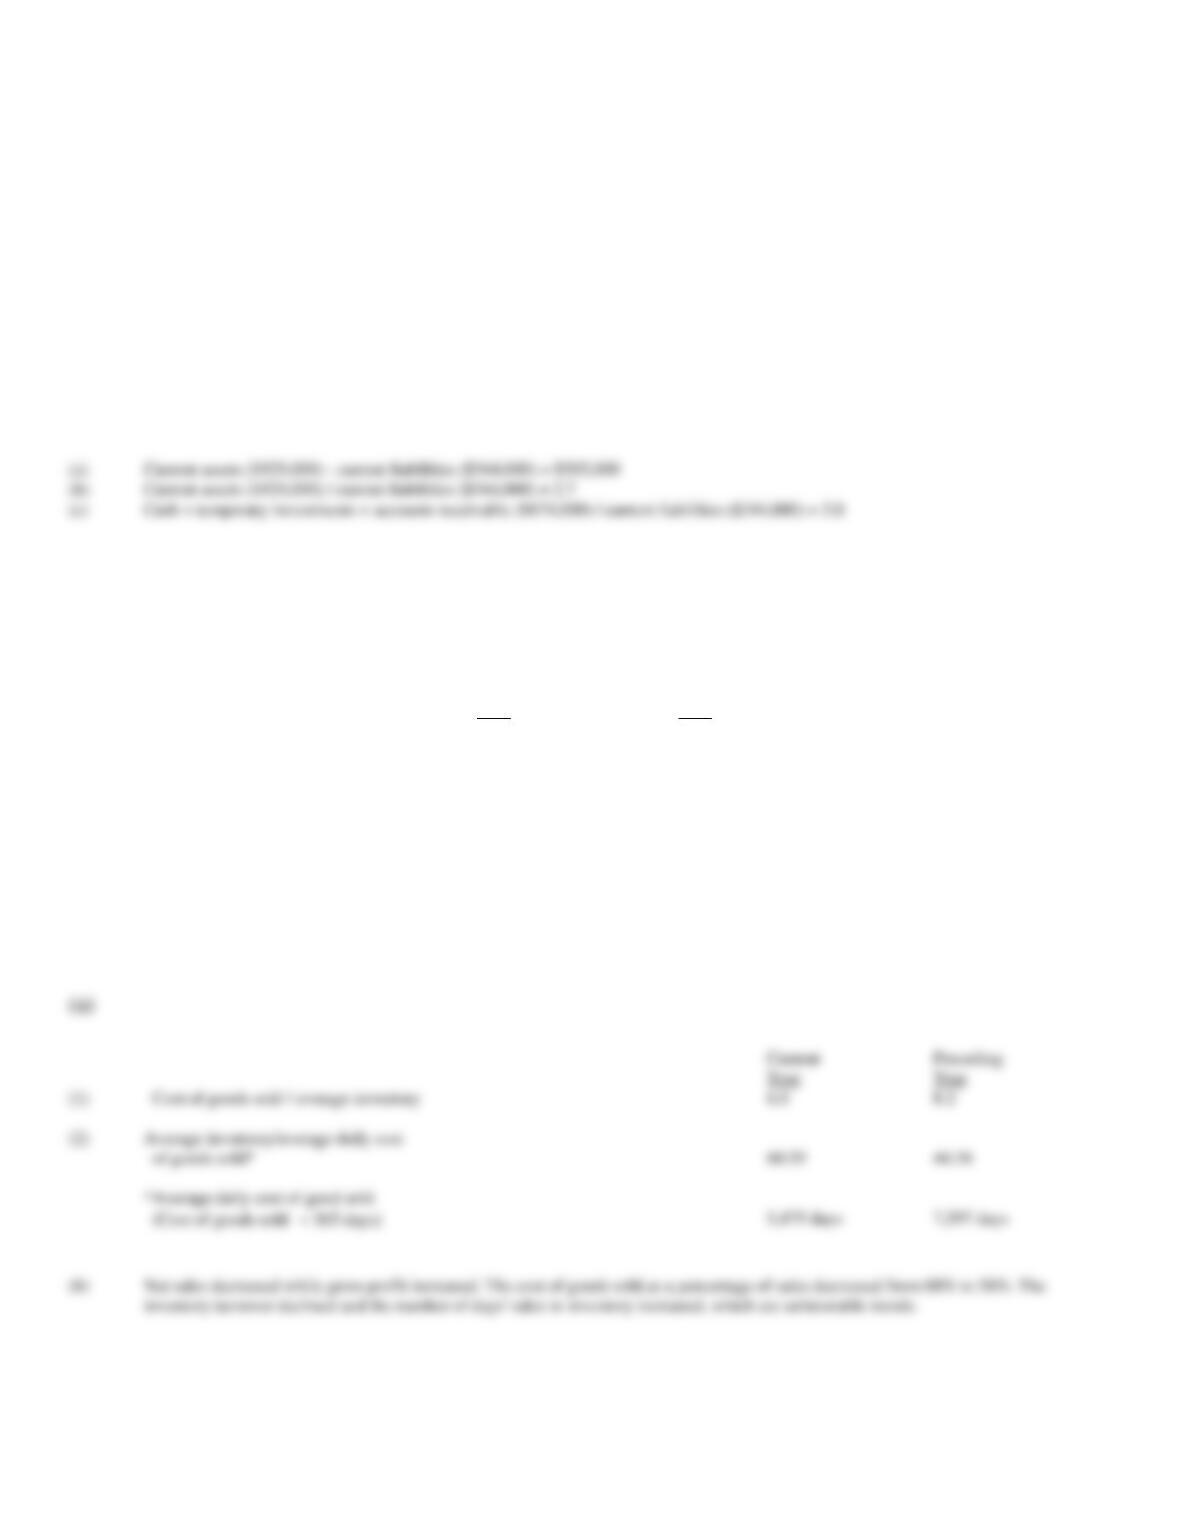
(a)
Determine for each year (1) the inventory turnover (Round answer to one decimal place) and (2) the number of days’ sales in inventory
(Round intermediate calculation to two decimal place and final answer to whole number).
(b)
Comment on the favorable and unfavorable trends revealed by the data.
Current
Preceding
Year
Year
(1)
Cost of goods sold / average inventory
6.0
8.2
(2)
Average inventory/average daily cost
of goods sold*
60.59
44.34
*Average daily cost of good sold
(Cost of goods sold 365 days)
(a)
Current assets ($929,000) – current liabilities ($344,000) = $585,000
(b)
Current assets ($929,000) / current liabilities ($344,000) = 2.7
(c)
Cash + temporary investments + accounts receivable ($674,000) / current liabilities ($344,000) = 2.0
181. The following data are taken from the financial statements:
Current
Preceding
Year
Year
Average accounts receivable (net)
$123,000
$ 95,000
Accounts receivable (net), end of year
129,012
87,516
Net sales on account
950,000
825,000
(a)
Assuming that credit terms on all sales are n/45, determine for each year (1) the accounts receivable turnover and (2) the number of
days’ sales in receivables.
Round intermediate calculation to whole number and final answer to two decimal place.
(b)
Comment on any significant trends revealed by the data.
Current
Preceding
Year
Year
(1)
Net sales on account/average
accounts receivable (net)
7.72
8.68
(2)
Average accounts receivable /
average daily sales on account **
47.25
42.04
** Current: $950,000 / 365 = $2,603
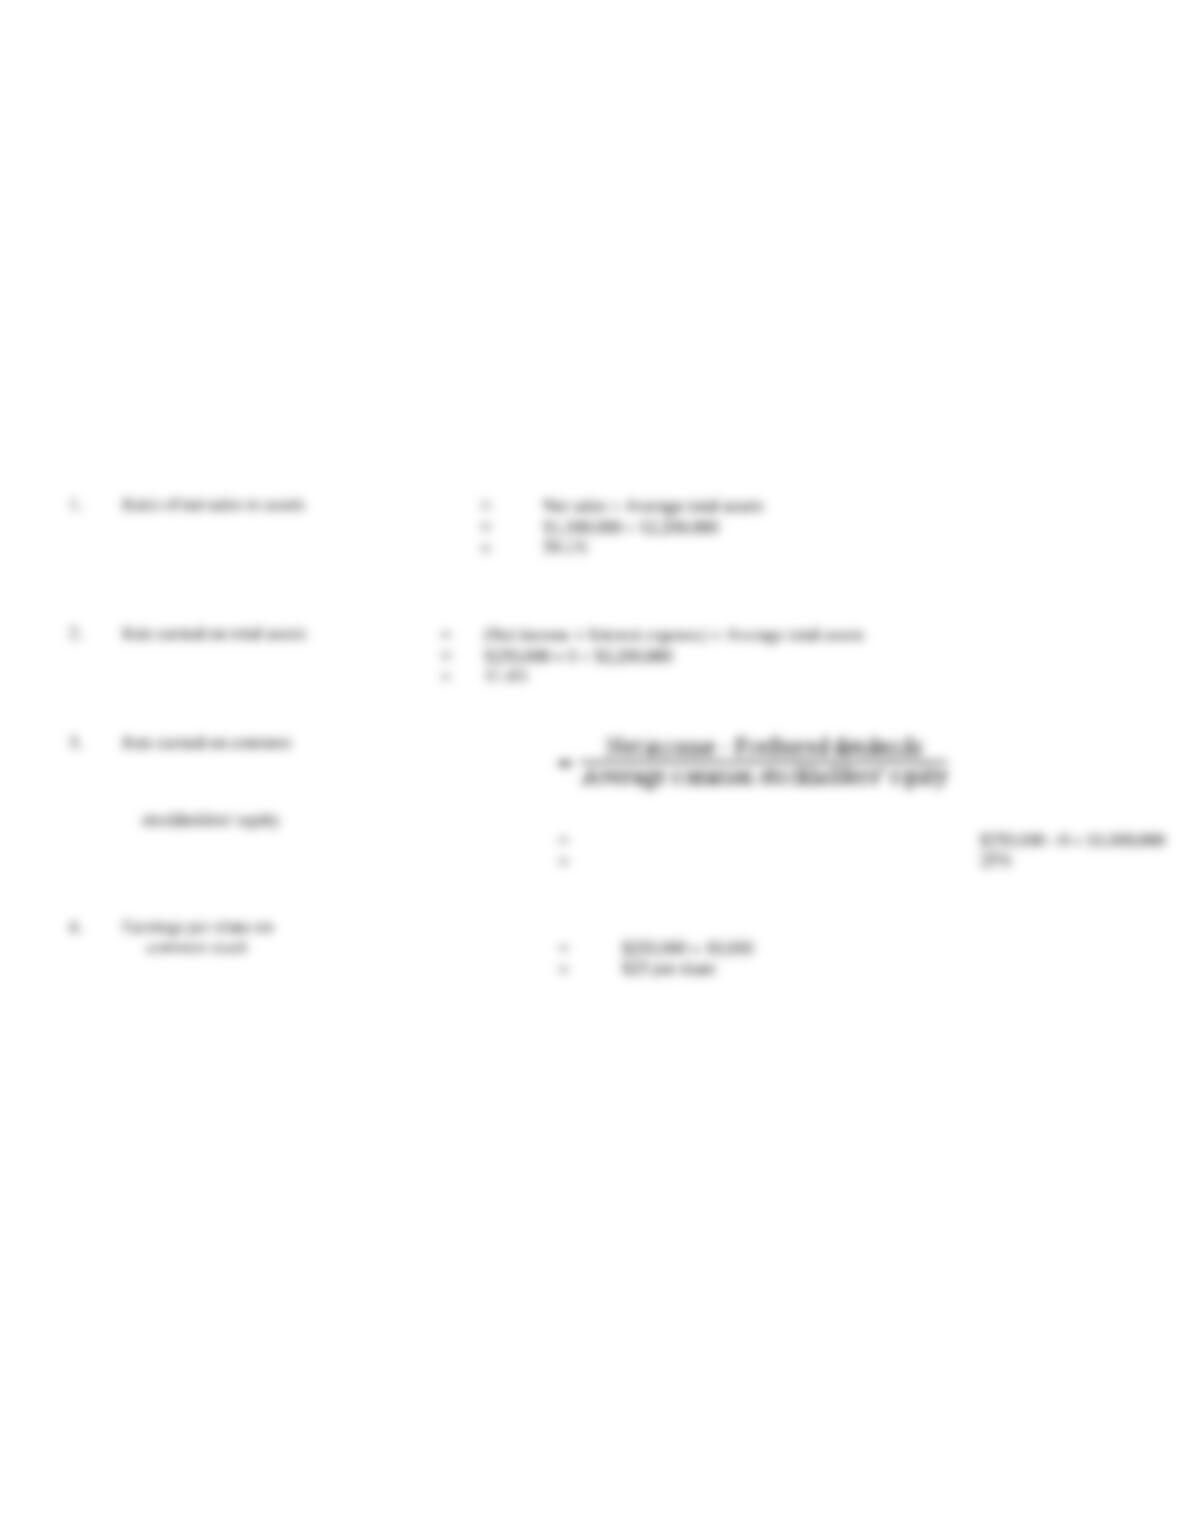
182. From the following data, determine for the current year the (a) rate earned on total assets, (b) rate earned
on stockholders’ equity, (c) rate earned on common stockholders’ equity, (d) earnings per share on common
stock, (e) price-earnings ratio on common stock, and (f) dividend yield on common stock. Assume that the
current market price per share of common stock is $25. (Present key figures used in your computations.)
Round percentage values to one decimal place, dollar values to two decimal places, and other ratios to one
decimal place.
Current
Year
Preceding
Year
Current assets
$ 745,000
$ 820,000
Property, plant, and equipment
1,510,000
1,400,000
Current liabilities
(non-interest-bearing)
160,000
140,000
Long-term liabilities, 12%
400,000
400,000
Preferred 10% stock
250,000
250,000
Common stock, $25 par
1,200,000
1,200,000
Retained earnings:
Beginning of year
230,000
160,000
Net income for year
110,000
155,000
Preferred dividends declared
(25,000)
(25,000)
Common dividends declared
(70,000)
(60,000)
= 7.1%
($2,255,000 + $2,220,000)
Average total assets
2
Net income ($ 110,000)
($1,695,000 + $1,680,000)
2
= 5.9%
Average common
($1,445,000 + $1,430,000)
stockholders’ equity
2
183. The following information has been condensed from the December 31 balance sheets of Hanson Co.:
2012
2011
Assets:
Current assets
$ 825,500
$ 674,300
Fixed assets (net)
1,473,600
1,275,300
Total assets
$2,299,100
$1,949,600
Liabilities:
Current liabilities
$ 313,500
$ 309,600
Long-term liabilities
703,000
545,000
Total liabilities
$1,016,500
$ 854,600
Stockholders’ equity
$1,282,600
$1,095,000
Total liabilities and
stockholders’ equity
$2,299,100
$1,949,600
(a)
Determine the ratio of fixed assets to long-term liabilities for 2012 and 2011.
(b)
Determine the ratio of liabilities to stockholders’ equity for 2012 and 2011.
(c)
Comment on the year-to-year changes for both ratios.
Round your answers to two decimal place.
2012
2011
Ratio of fixed assets to
long-term liabilities
2.10
2.34
Ratio of liabilities to
stockholders’ equity
0.79
0.78
Net income ($110,000) – preferred dividends ($25,000)
= $1.77
Shares of common stock outstanding (48,000)
Market price per share of common stock ($25)
= 14.1
Earnings per share of common stock ($1.77)
Dividends per share of common stock ($1.46)
= 5.8%
Market price per share of common stock ($25)
184. A company reports the following:
Net income
$275,000
Preferred dividends
$30,000
Average stockholders’ equity
$1,000,000
Average common stockholders’ equity
$700,000
Determine the (a) rate earned on stockholders’ equity, and (b) rate earned on common stockholders’ equity. Round your answer to one decimal
place.
Rate earned on stockholders’ equity = Net income / Average stockholders’ equity
Rate earned on stockholders’ equity = $275,000 / $1,000,000
Rate earned on stockholders’ equity = 27.5%
Rate earned on common stockholders’ equity = (Net income – preferred dividends) /
Average common stockholders’ equity
Rate earned on common stockholders’ equity = ($275,000 – $30,000) / $700,000
Rate earned on common stockholders’ equity = 35%
185. Selected data from the Carmen Company at year end are presented below:
Total assets
$2,000,000
Average total assets
2,200,000
Net income
250,000
Net sales
1,300,000
Average common stockholders’ equity
1,000,000
Net cash provided by operating activities
275,000
Shares of common stock outstanding
10,000
Instructions
Calculate the profitability ratios that can be computed from the above information.Assume the company had no preferred stock or interest expense.
Round percentage value to one decimal place and dollar value to zero decimal place.
With the information provided, the profitability ratios that can be calculated are as follows:
Net sales Average total assets
$1,300,000 $2,200,000
=
59.1%
(Net income + Interest expense) Average total assets
$250,000 + 0 $2,200,000
=
11.4%
stockholders’ equity
=
Earnings per share on
=
$25 per share
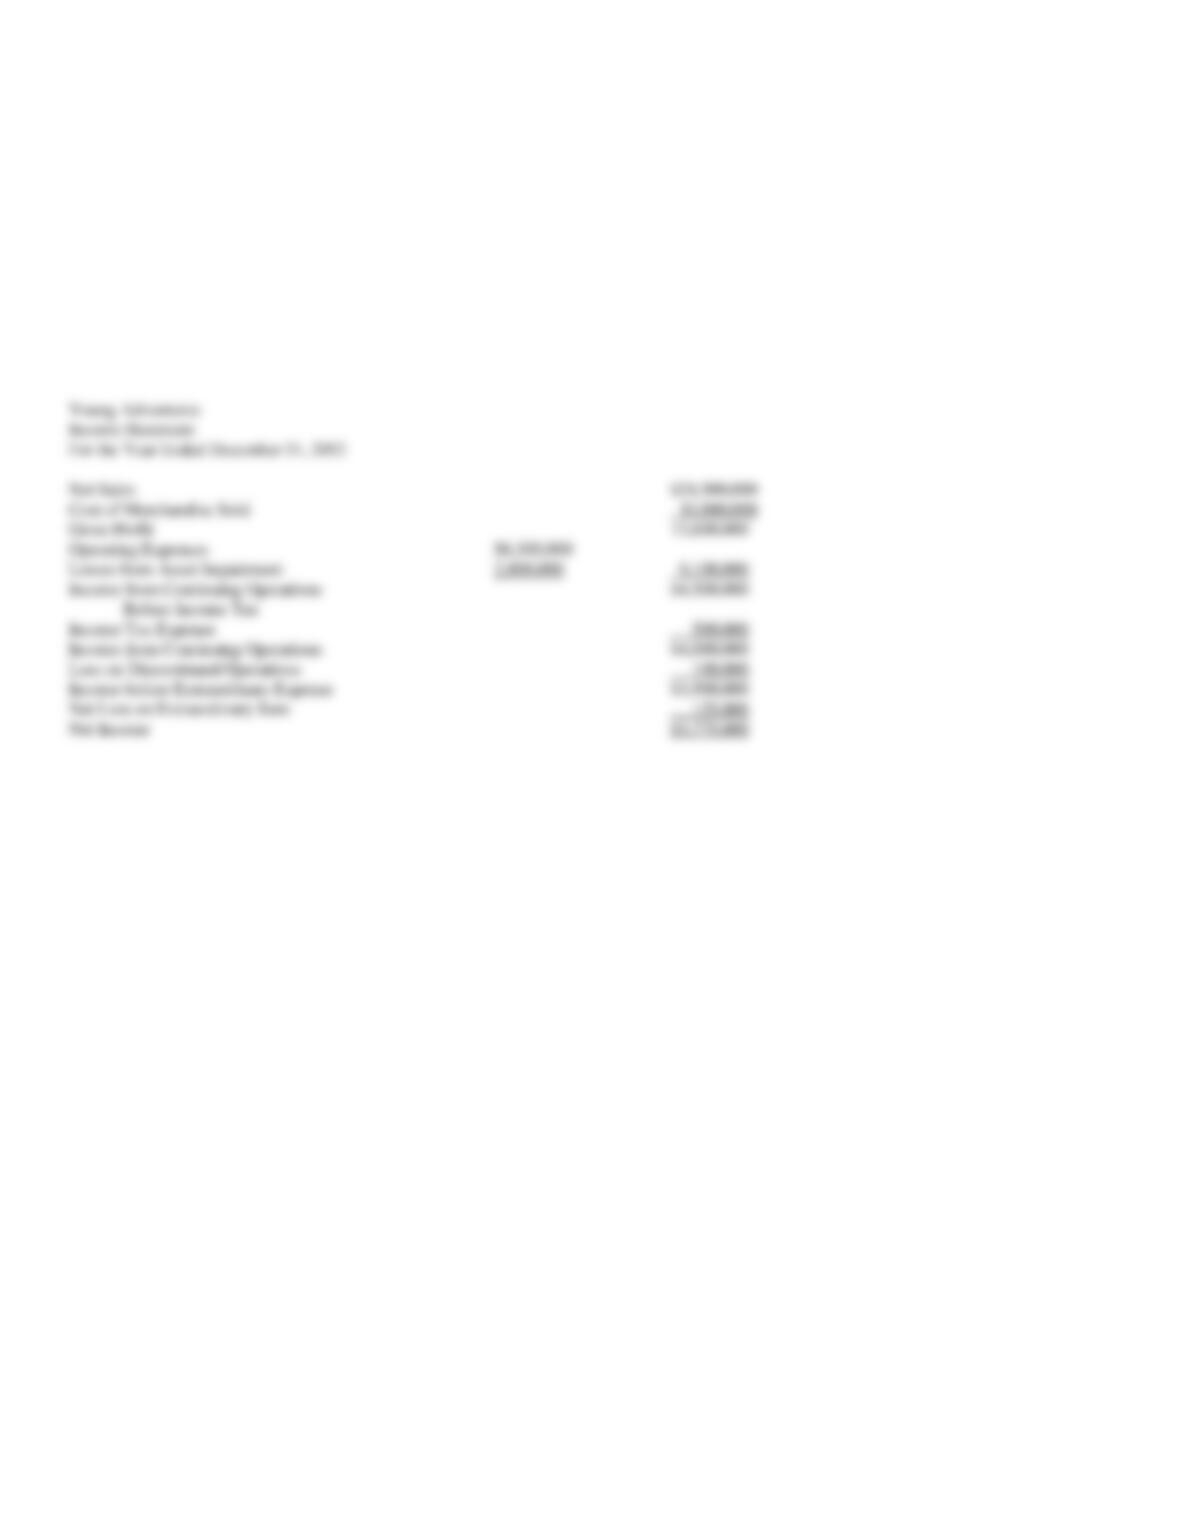
186. Prepare an Income Statement using the following data for Young Adventures for the year ended December
31, 2012:
Net Sales
$24,500,000
Cost of Merchandise Sold
10,900,000
Operating Expenses
6,300,000
Losses from Asset Impairment
2,800,000
Income Tax Expense
500,000
Loss on Discontinued Operations
100,000
Net Loss on Extraordinary Item
125,000
Net Sales
$24,500,000
Cost of Merchandise Sold
10,900,000
Gross Profit
13,600,000
Operating Expenses
$6,300,000
Losses from Asset Impairment
2,800,000
9,100,000
Income from Continuing Operations
$4,500,000
Before Income Tax
Income Tax Expense
500,000
Income from Continuing Operations
$4,000,000
Loss on Discontinued Operations
100,000
Income before Extraordinary Expense
$3,900,000
Net Loss on Extraordinary Item
125,000
Net Income
$3,775,000
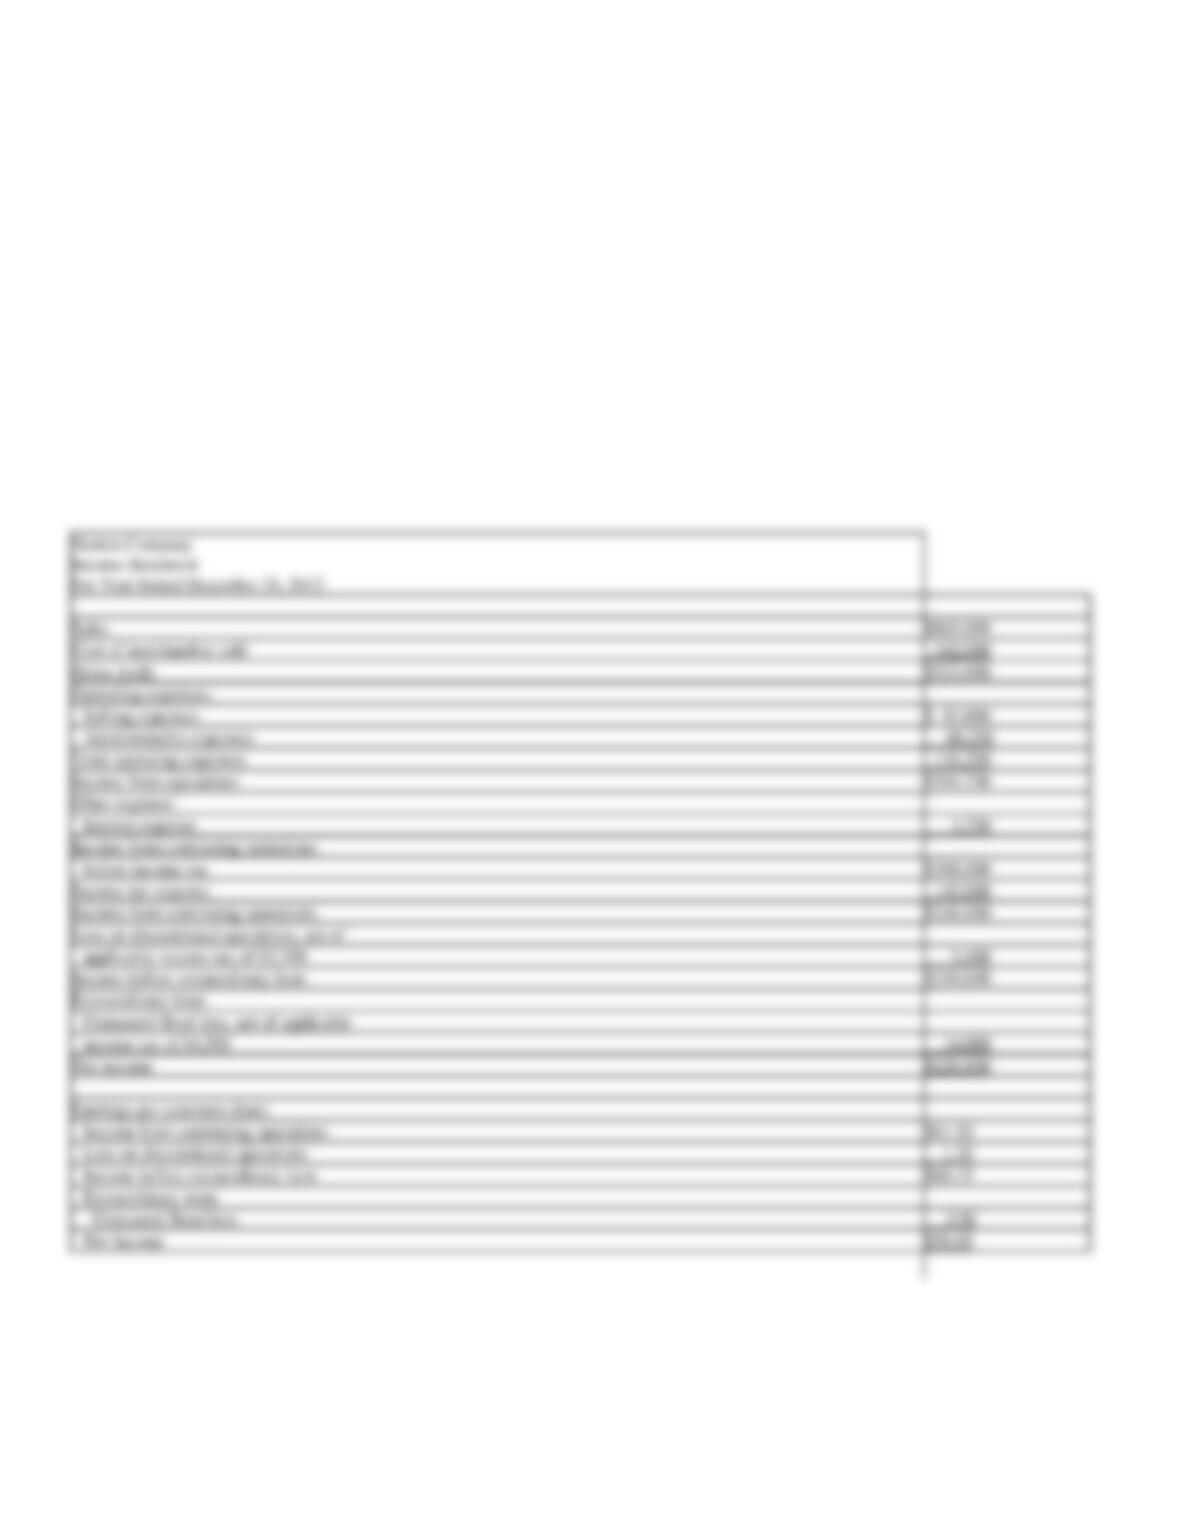
187. From the following data for Norton Company for the year ended December 31, 2012 prepare a multiple-
step income statement. Show parenthetically earnings per share for the following: income from continuing
operations, loss on discontinued operations (less applicable income tax), income before extraordinary item,
extraordinary item (less applicable income tax), and net income.
Common stock, $50 par
$200,000
Cost of merchandise sold
342,000
Administrative expenses
48,250
Income tax (applicable to continuing operations)
142,000
Interest expense
3,750
Loss on discontinued operations,
net of applicable tax of $2,700
5,400
Sales
865,000
Selling expenses
83,000
Uninsured flood loss, net of applicable
income tax of $4,500
14,000
Sales
$865,000
Cost of merchandise sold
342,000
Gross profit
$523,000
Operating expenses:
Selling expenses
$ 83,000
Administrative expenses
48,250
Total operating expenses
131,250
Income from operations
$391,750
Interest expense
3,750
Income from continuing operations
before income tax
$388,000
Income tax expense
142,000
Income from continuing operations
$246,000
Loss on discontinued operations, net of
applicable income tax of $2,700
5,400
Income before extraordinary item
$240,600
Extraordinary item:
Uninsured flood loss, net of applicable
income tax of $4,500
14,000
Net income
$226,600
Earnings per common share:
Income from continuing operations
$61.50
Loss on discontinued operations
1.35
Income before extraordinary item
$60.15
Extraordinary item:
Uninsured flood loss
3.50
Net Income
$56.65
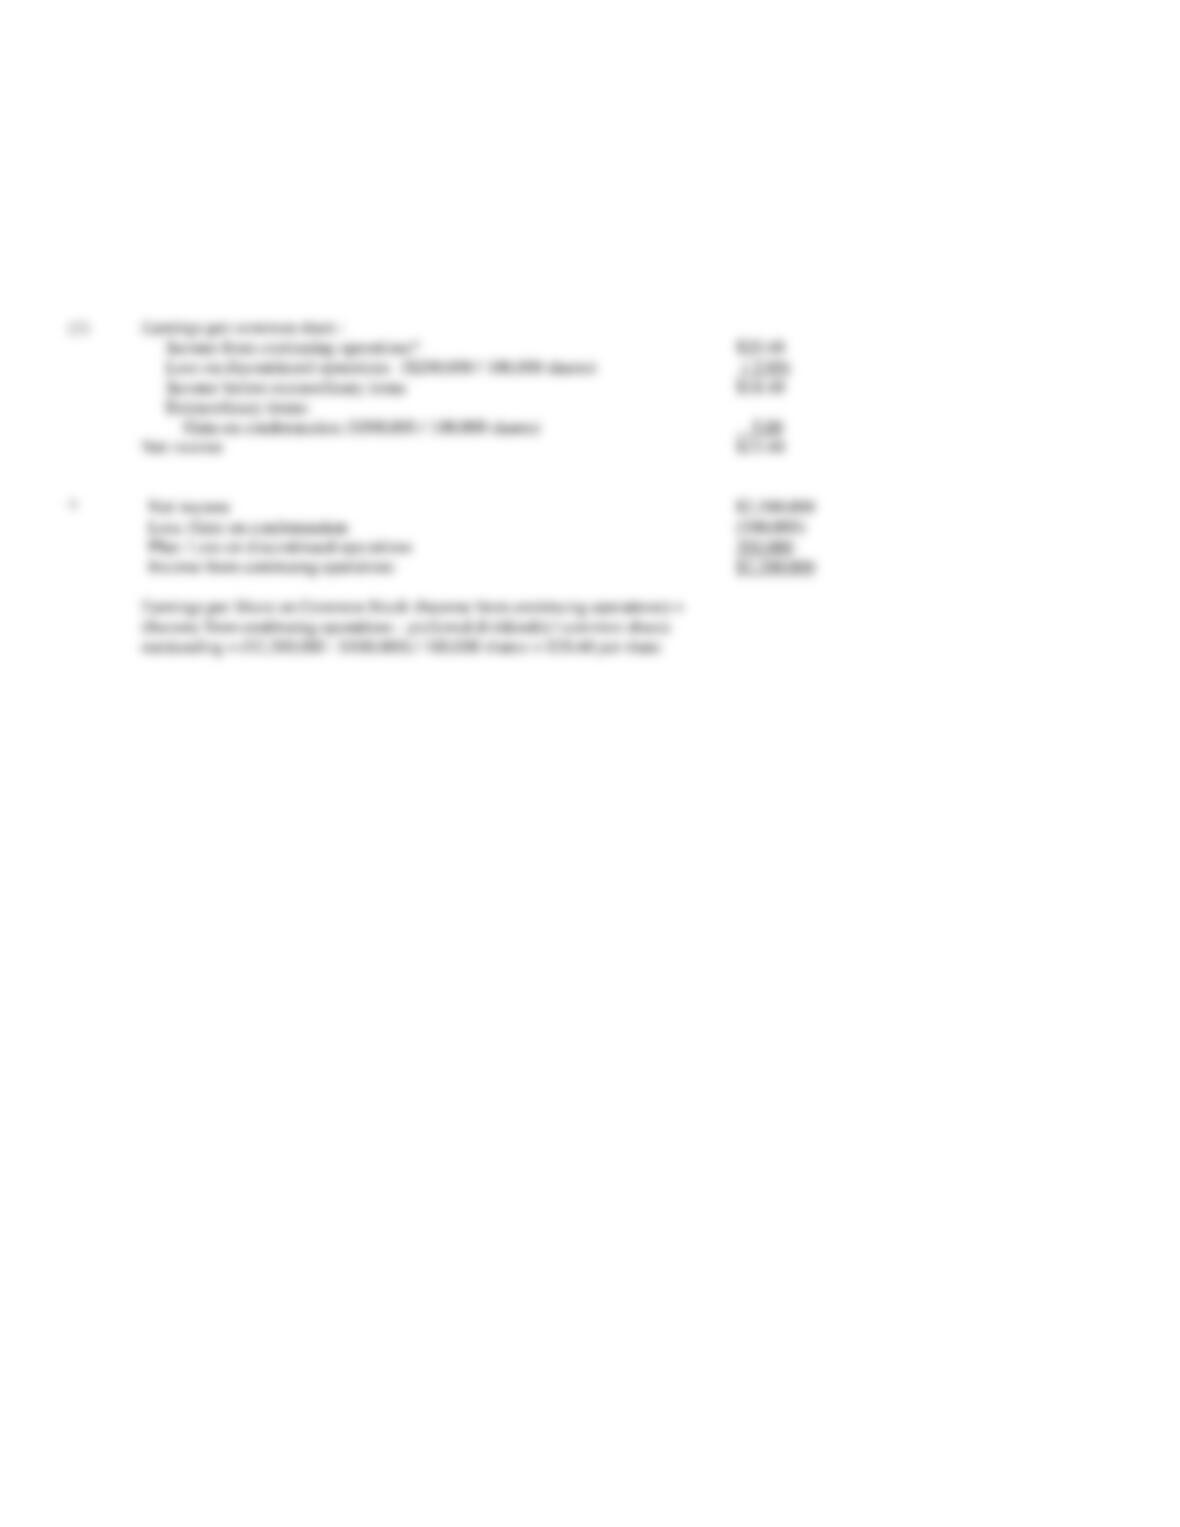
188. Gallant Company reported net income of $2,500,000. The income statement included one extraordinary
item: a $500,000 gain from condemnation of land and a $200,000 loss on discontinued operations, both after
applicable income tax.
There were 100,000 shares of $10 par common stock and 40,000 shares 4% preferred stock of $100 par
outstanding throughout the current year.
Required: Prepare the earnings per share section of Gallant Company’s income statement.