Chapter 15(14): Financial Statement Analysis
146.
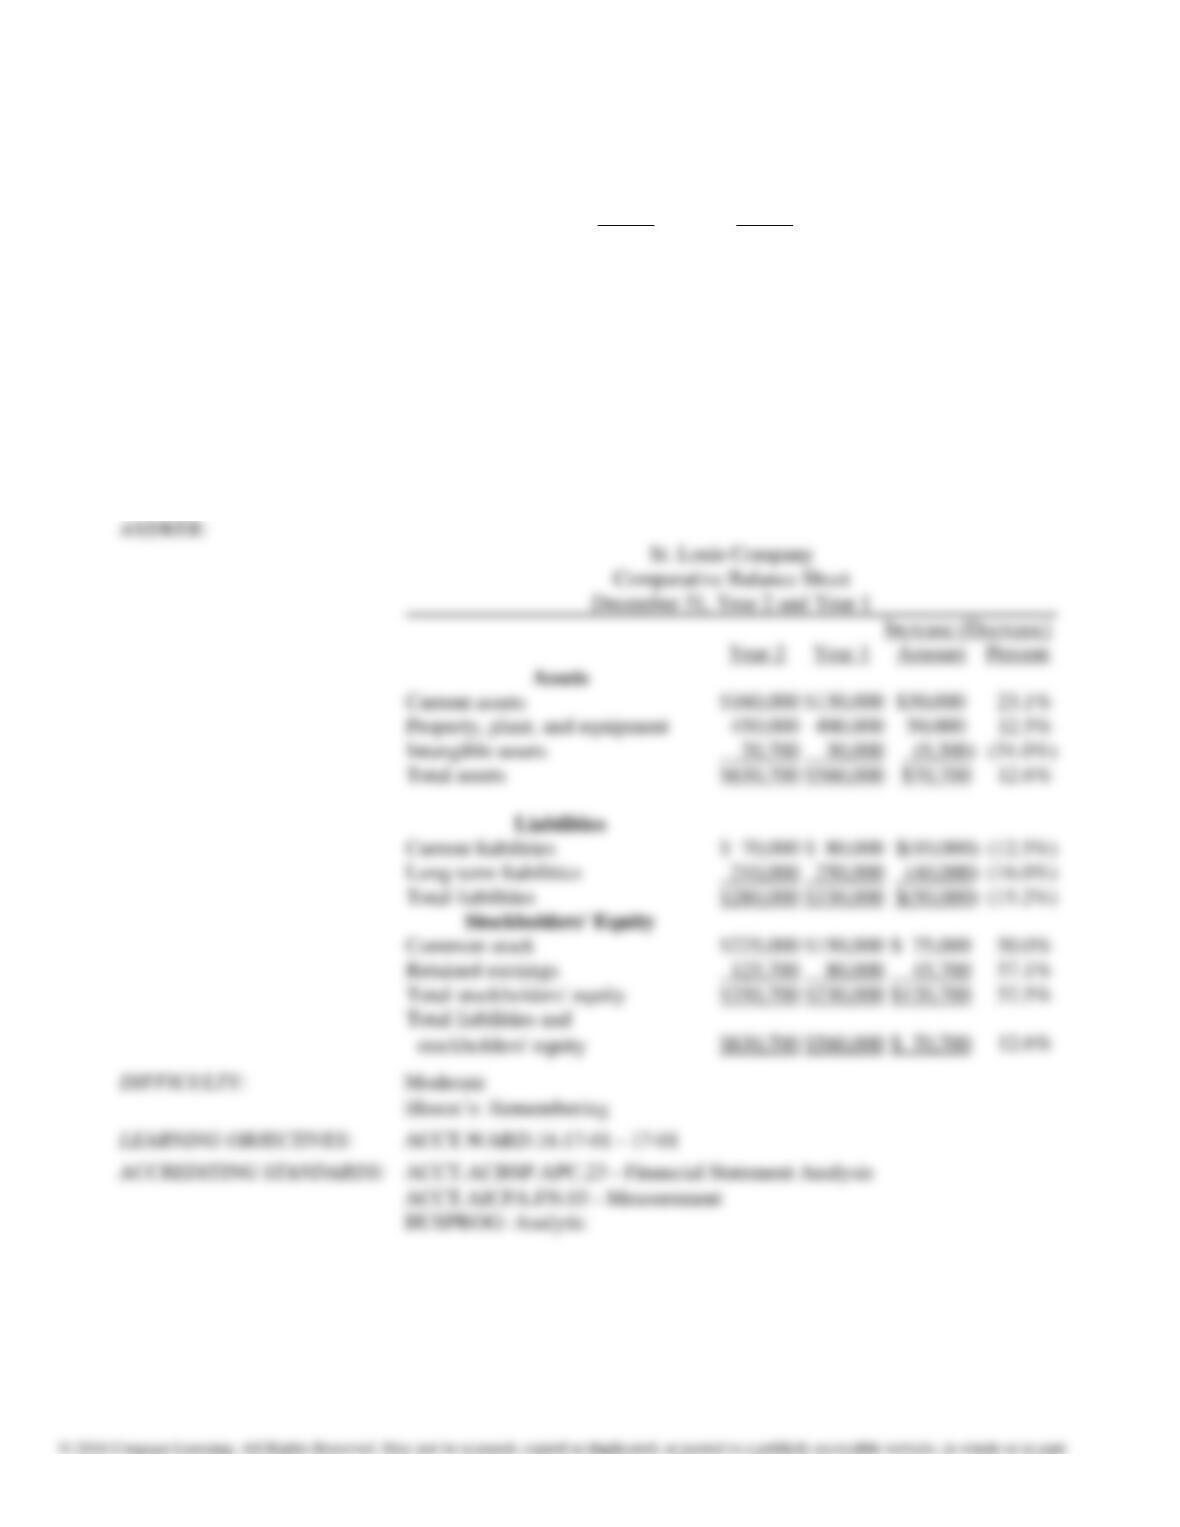
Condensed data taken from the ledger of St. Louis Company at December 31, for the current and preceding years,
are as follows:
Year 2
Year 1
Current assets
$160,000
$130,000
Property, plant, and equipment
450,000
400,000
Intangible assets
20,700
30,000
Current liabilities
70,000
80,000
Long-term liabilities
210,000
250,000
Common stock
225,000
150,000
Retained earnings
125,700
80,000
Prepare a comparative balance sheet, with horizontal analysis, for December 31, Year 2 and Year 1. (Round
percents to one decimal point.)
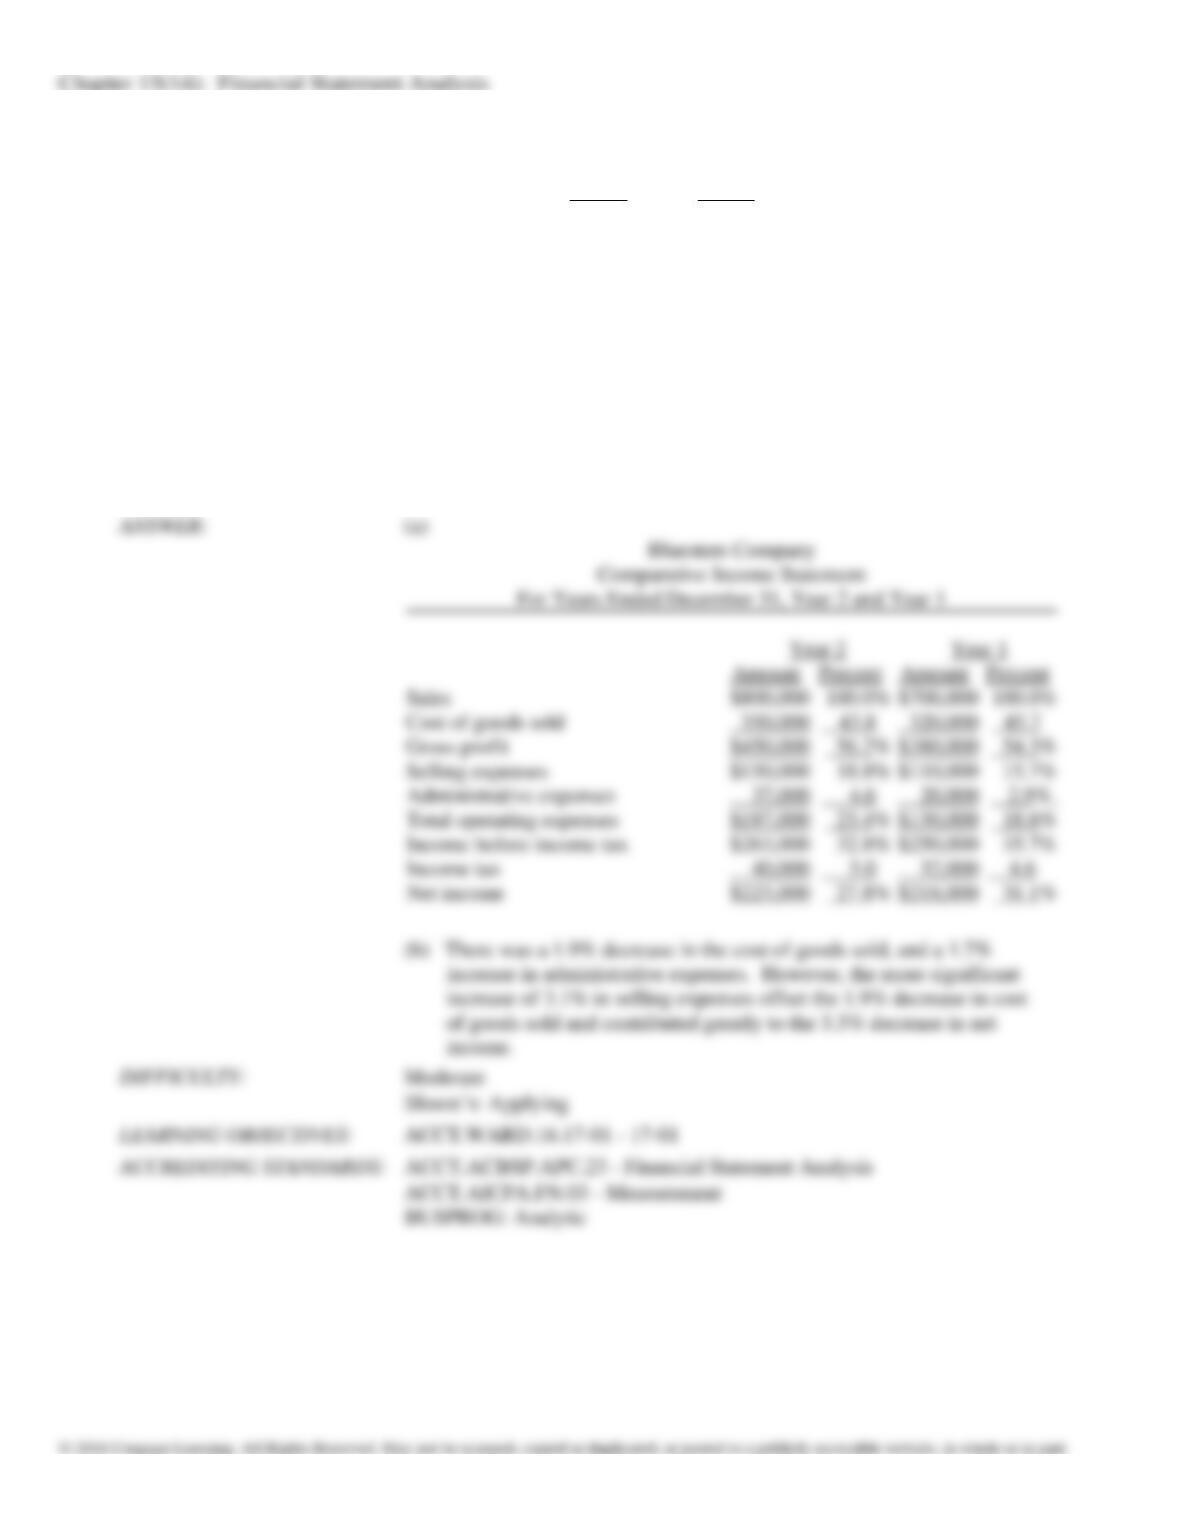
147.
Revenue and expense data for Bluestem Company are as follows:
Year 2
Year 1
Administrative expenses
$ 37,000
$ 20,000
Cost of goods sold
350,000
320,000
Income tax
40,000
32,000
Sales
800,000
700,000
Selling expenses
150,000
110,000
(a)
Prepare a comparative income statement, with vertical analysis, stating each item for
both
years as a percent of sales.
(b)
Comment upon significant changes disclosed by the comparative income statement.
Round percentages to one decimal place.
148.
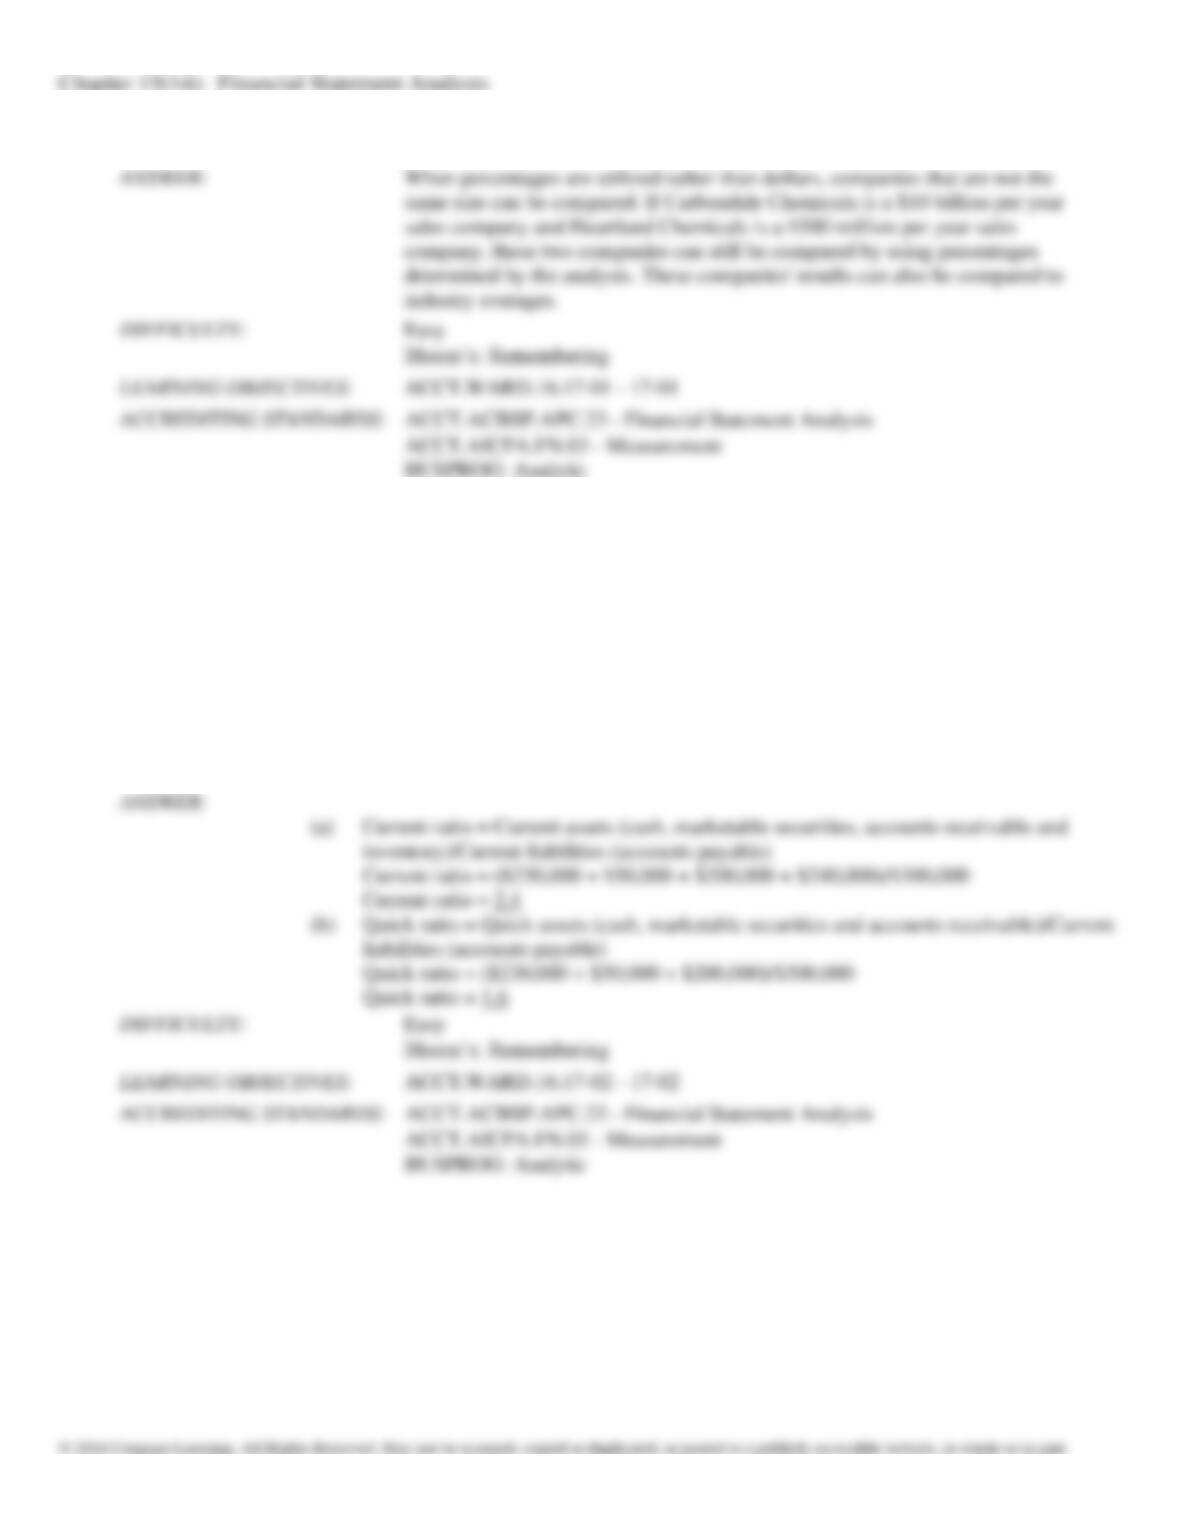
What is a major advantage of using percentages rather than dollar changes in doing horizontal and vertical analysis?
149.
The following items are reported on a company’s balance sheet:
Cash
$230,000
Marketable securities
50,000
Accounts receivable
200,000
Inventory
240,000
Accounts payable
300,000
Determine the (a) current ratio, and (b) quick ratio. Round your answer to one decimal place.
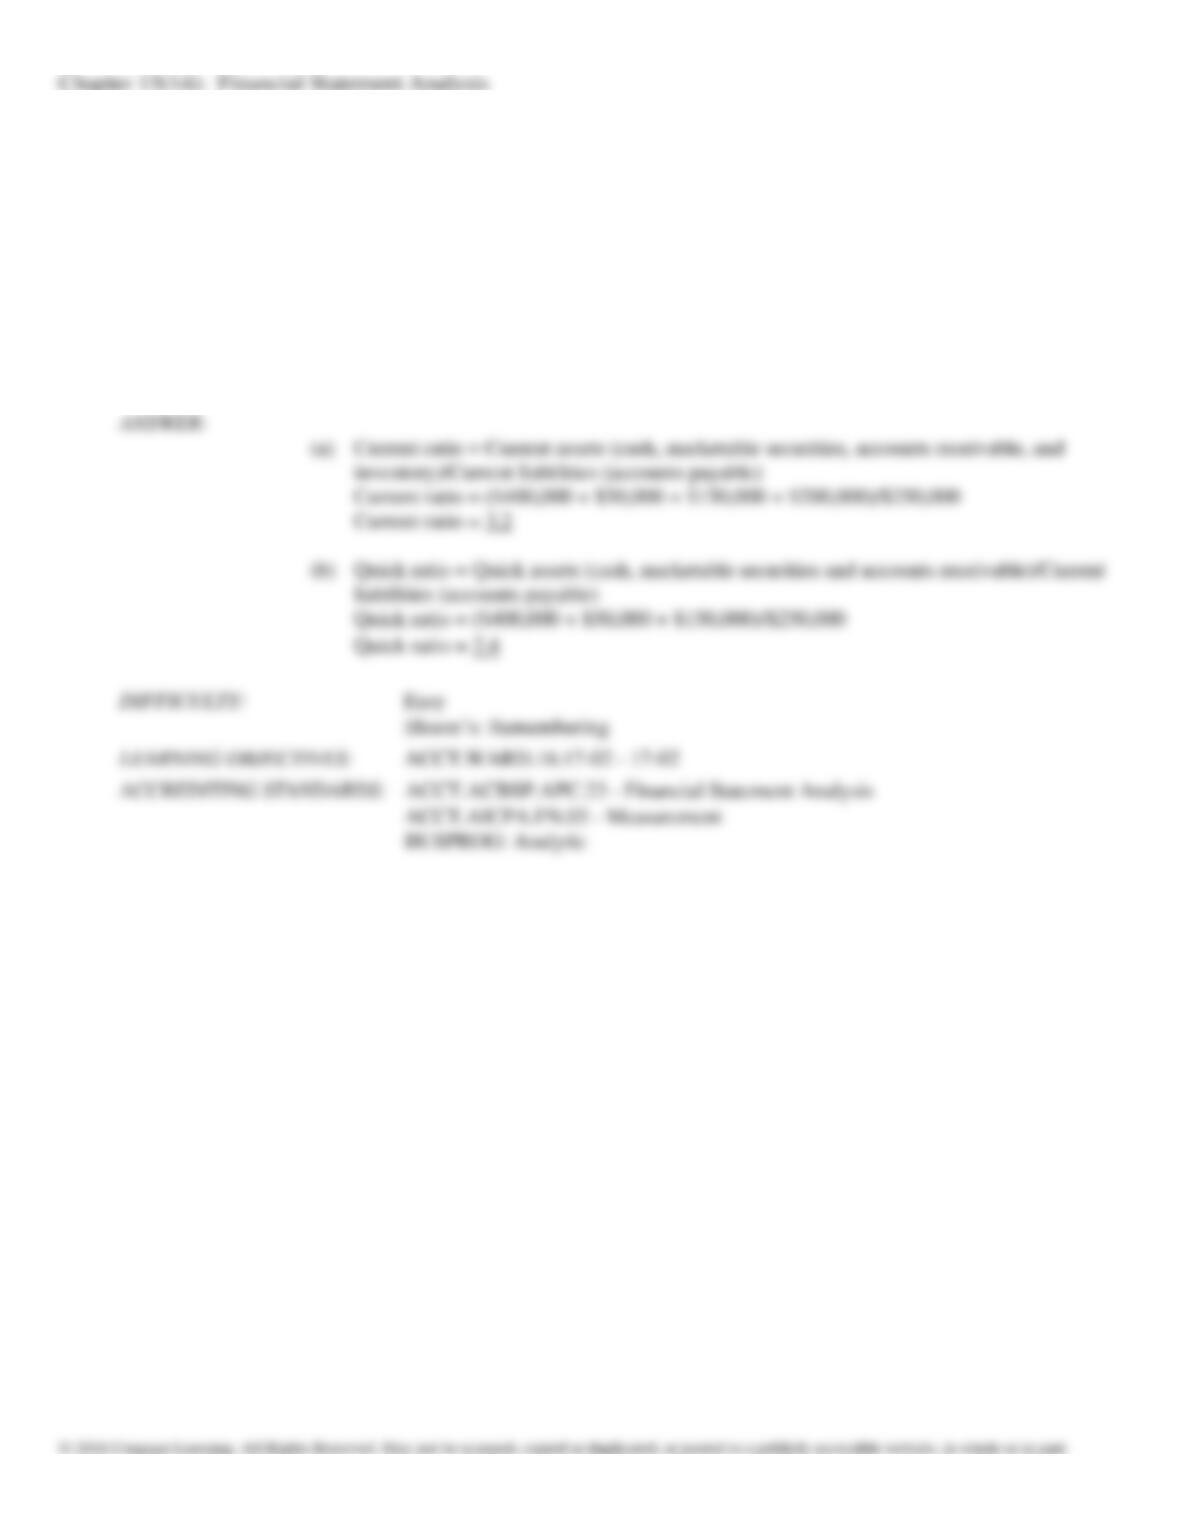
150.
The following items are reported on a company’s balance sheet:
Cash
$400,000
Marketable securities
50,000
Accounts receivable
150,000
Inventory
200,000
Accounts payable
250,000
Determine the (a) current ratio, and (b) quick ratio. Round your answer to one decimal place.
151.
The following items are reported on Denver Company’s balance sheet:
Cash
$190,000
Marketable securities
160,000
Accounts receivable (net)
240,000
Inventory
350,000
Accounts payable
600,000
Determine (a) the current ratio and (b) the quick ratio. Round to one decimal place.
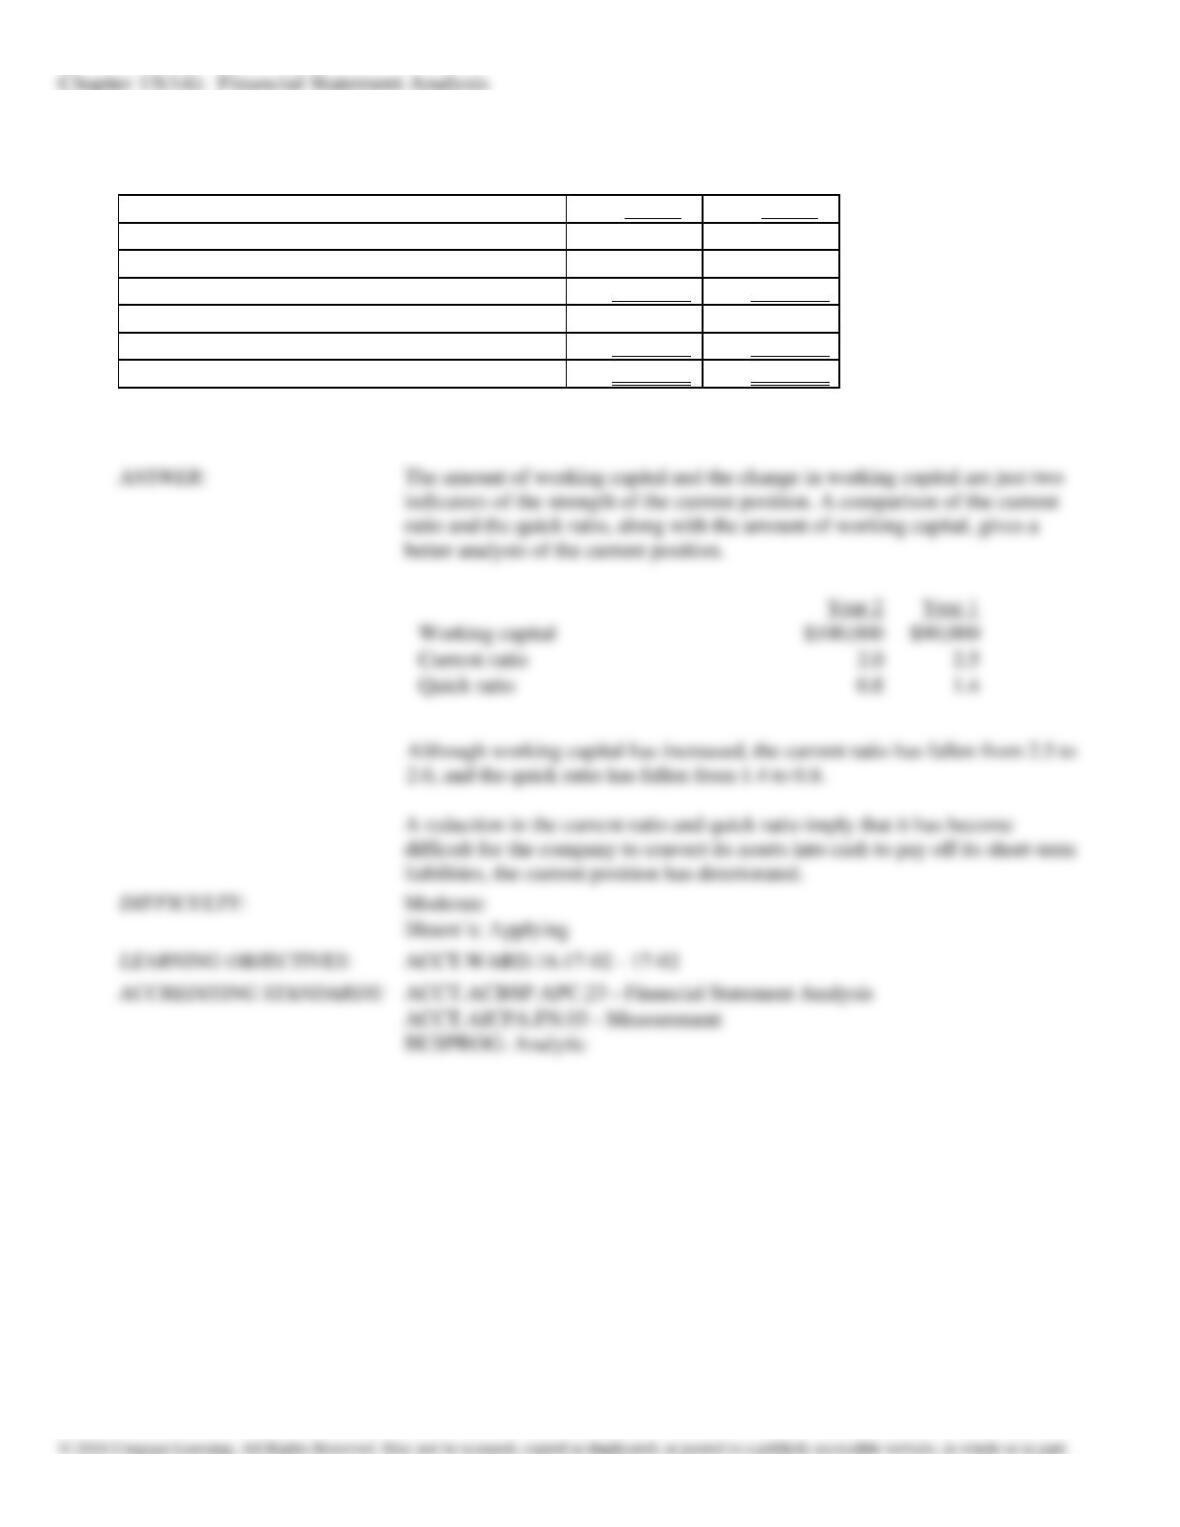
152.
For Garrison Corporation, the working capital at the end of the current year is $10,000 more than the
working
capital at the end of the preceding year, reported as follows:
Year 2
Year 1
Current assets:
Cash, marketable securities, and receivables
$ 80,000
$ 84,000
Inventories
120,000
66,000
Total current assets
$200,000
$150,000
Current liabilities
100,000
60,000
Working capital
$100,000
$ 90,000
Has the current position of Garrison Corporation improved? Explain.
153.
A company reports the following:
Sales $720,000
Average accounts receivable (net) 45,000
Determine the (a) accounts receivable turnover, and (b) number of days’ sales in receivables. Round your answer to
one decimal place.
154.
A company reports the following:
Sales $1,200,000
Average accounts receivable (net) 50,000
Determine the (a) accounts receivable turnover, and (b) number of days’ sales in receivables. Round your answer to
one decimal place.
155.
A company reports the following:
Cost of goods sold $610,000
Average inventory 80,000
Determine the (a) inventory turnover, and (b) number of days’ sales in inventory. Round your answer to one
decimal place.
156.
The following information was taken from Slater Company’s balance sheet:
Fixed assets (net)
$1,250,000
Long-term liabilities
500,000
Total liabilities
672,000
Total stockholders’ equity
1,680,000
Determine the company’s (a) ratio of fixed assets to long–term liabilities, and (b) ratio of liabilities to stockholders’
equity. Round your answer to one decimal place.
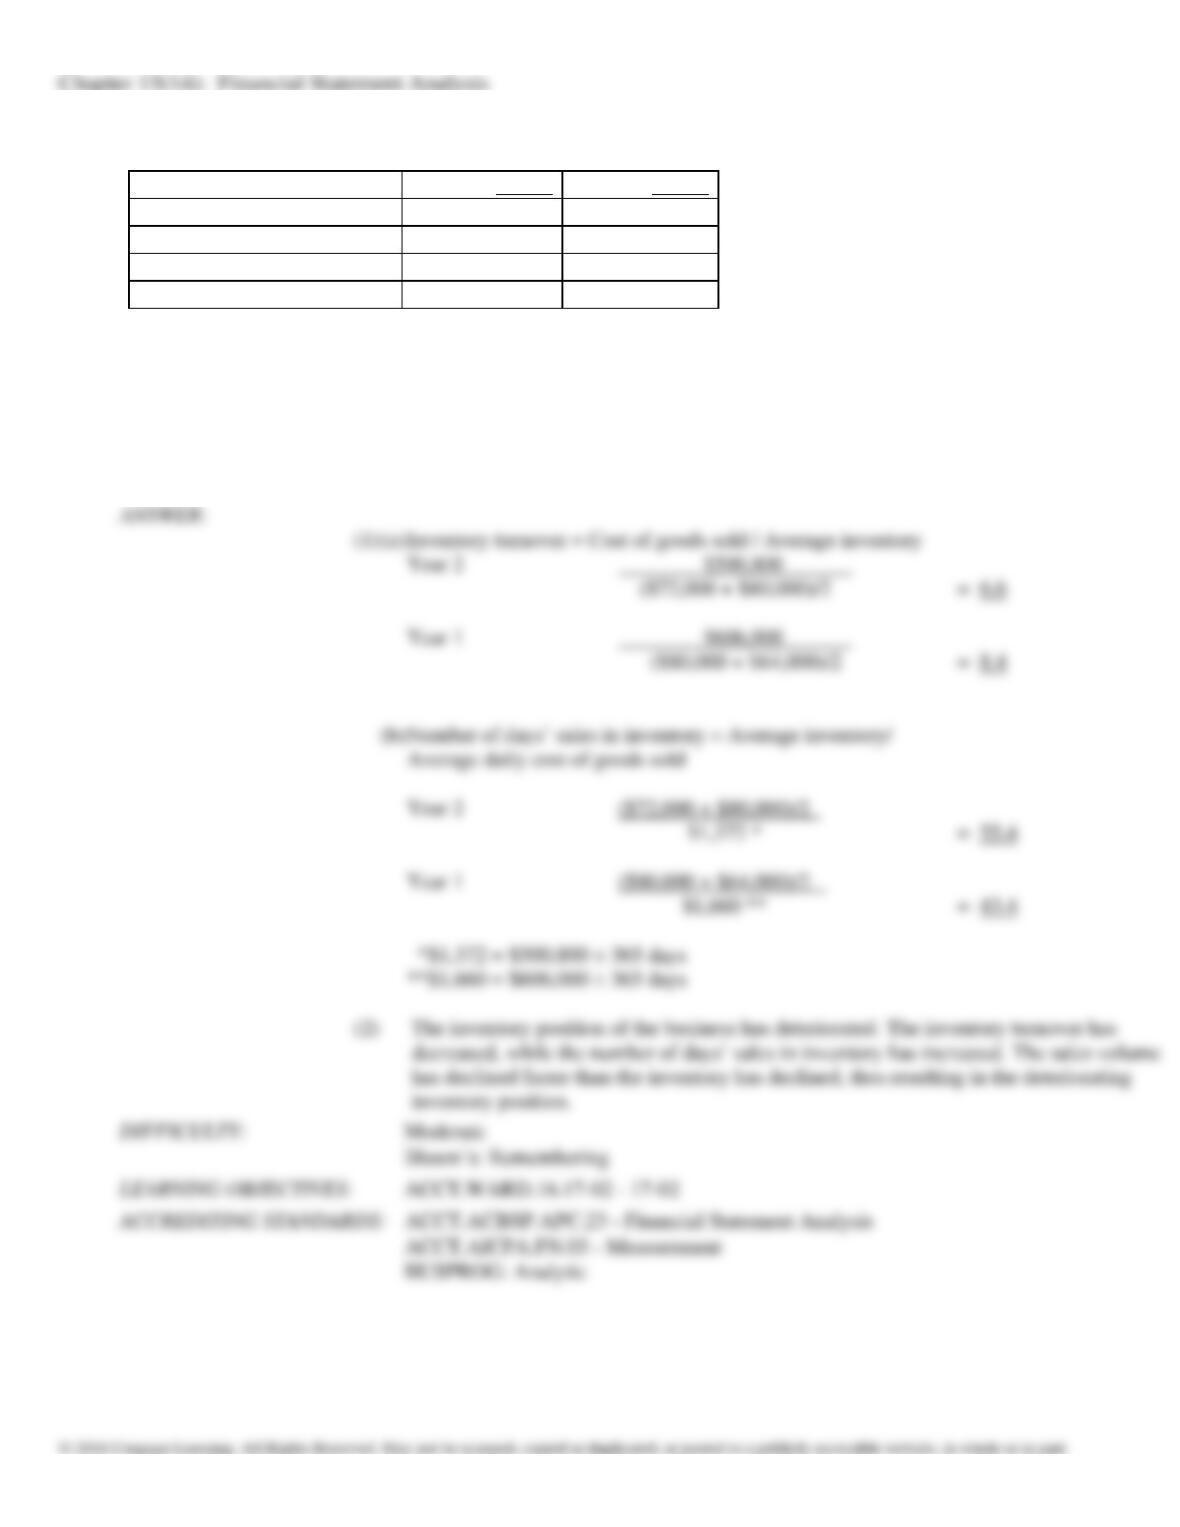
157.
The following data are available for Martin Solutions, Inc.
Year 2
Year 1
Sales
$1,139,600
$1,192,320
Beginning inventory
80,000
64,000
Cost of goods sold
500,800
606,000
Ending inventory
72,000
80,000
(1)
Determine for each year:
(a)
The inventory turnover
(b)
The number of days’ sales in inventory (Round intermediate calculation to the
nearest
whole number and your final answer to one decimal place).
(2)
What conclusions can be drawn from these data concerning the inventories?
158.
A company reports the following:
Income before income tax $600,000
Interest expense 150,000
Determine the number of times interest charges are earned. Round your answer to one decimal place.
159.
The following data are taken from the balance sheet at the end of the current year.
Cash
$154,000
Accounts receivable
210,000
Inventory
240,000
Prepaid expenses
15,000
Temporary investments
350,000
Property, plant, and equipment
375,000
Accounts payable
245,000
Accrued liabilities
4,000
Income tax payable
10,000
Notes payable, short-term
85,000
Determine the (a) working capital, (b) current ratio, and (c) quick ratio. Round ratios to the nearest tenth.
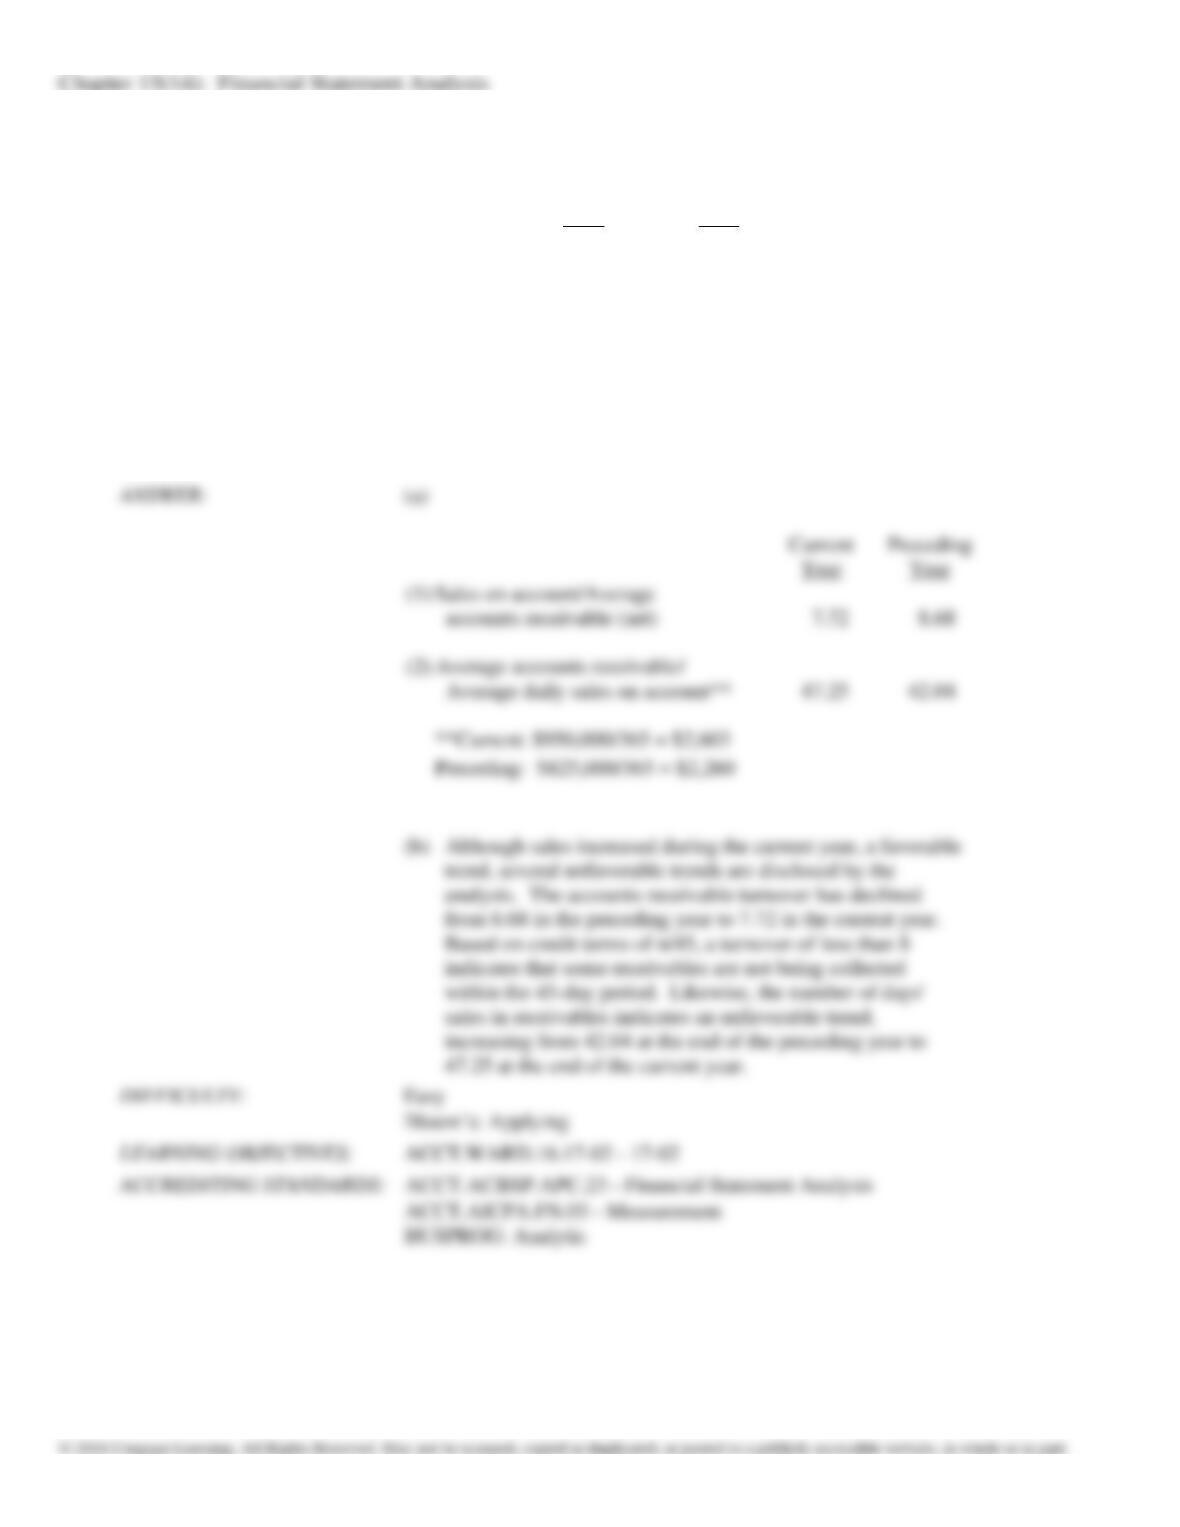
160.
The following data are taken from the financial statements:
Current
Preceding
Year
Year
Average accounts receivable (net)
$123,000
$ 95,000
Accounts receivable (net), end of year
129,012
87,516
Sales on account
950,000
825,000
(a)
Assuming that credit terms on all sales are n/45, determine for each year (1) the accounts receivable
turnover and (2) the number of days’ sales in receivables.
Round intermediate calculations to whole numbers and final answers to two decimal places.
(b)
Comment on any significant trends revealed by the data.
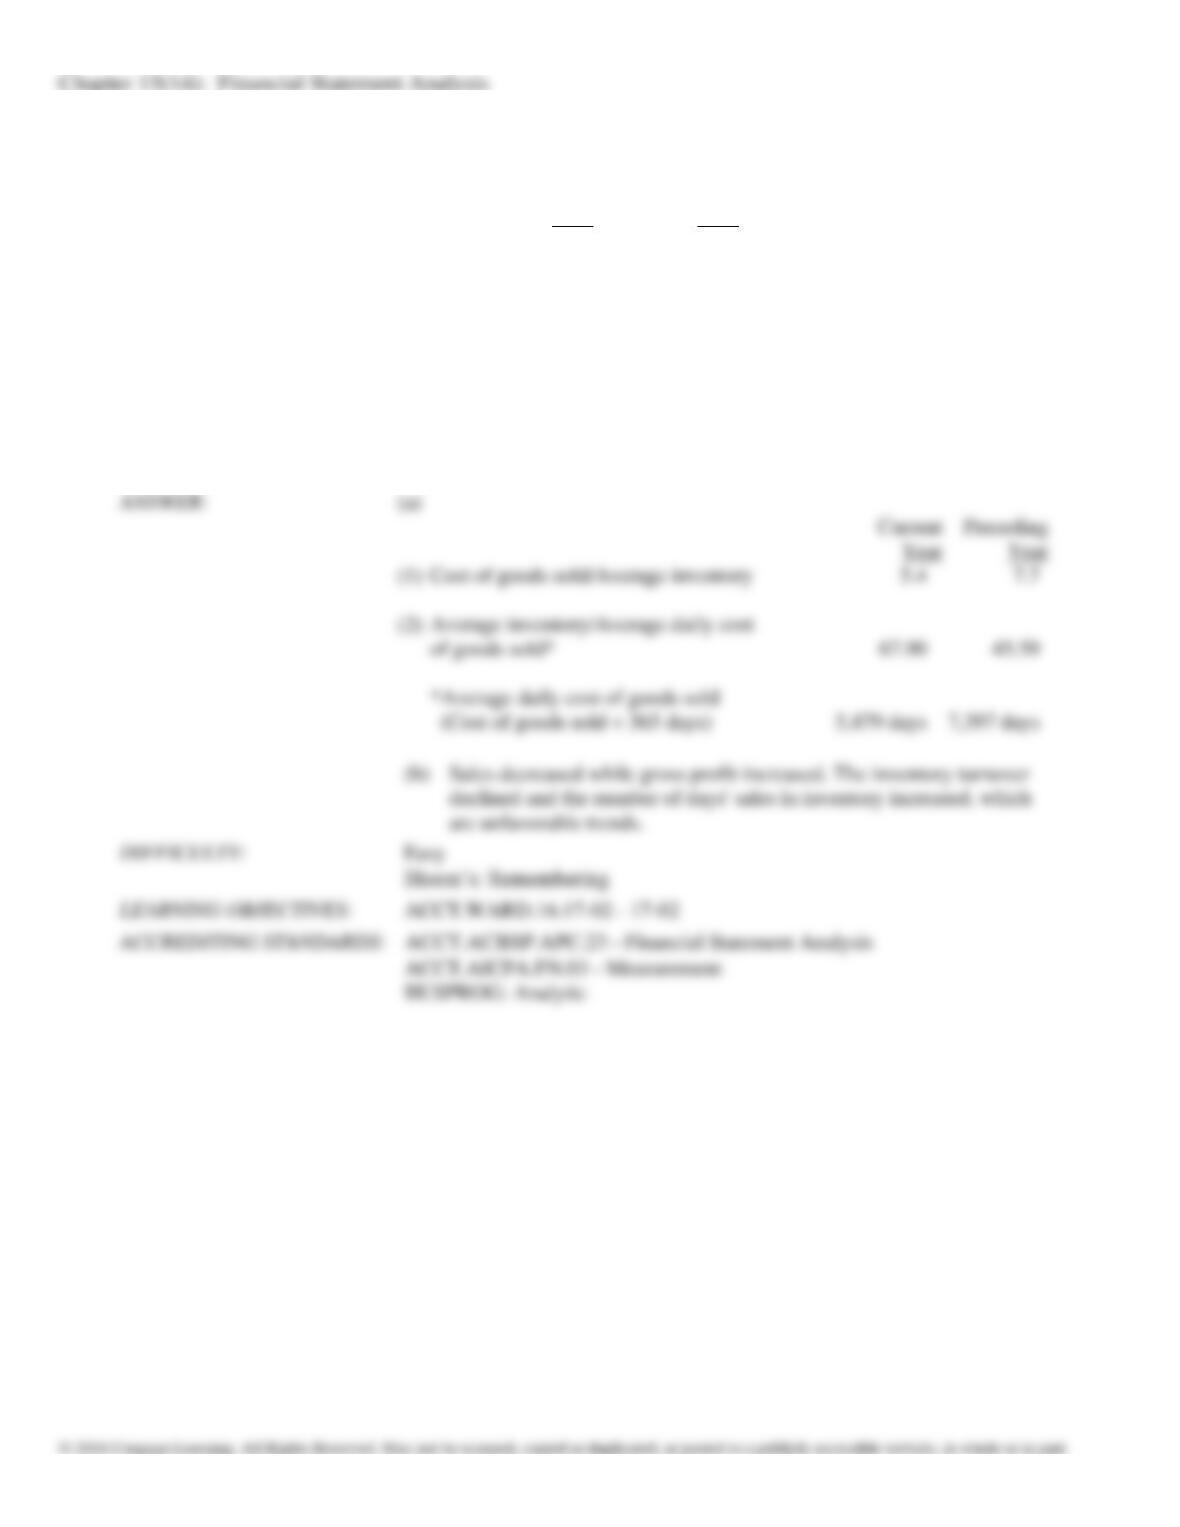
161.
The following data are taken from the financial statements:
Current
Preceding
Year
Year
Sales
$3,600,000
$4,000,000
Cost of goods sold
2,000,000
2,700,000
Average inventory
372,000
352,000
Inventory, end of year
372,000
347,000
(a)
(b)
Determine for each year (1) the inventory turnover, round answer to one decimal place.
(2) the number of days’ sales in inventory. Round intermediate calculations to two
decimal
places and the final answer to whole number.
Comment on the favorable and unfavorable trends revealed by the data.
162.
The balance sheet for Seuss Company at the end of the current fiscal year indicated the following:
Bonds payable, 10% (20-year term)
$5,000,000
Preferred 10% stock, $100 par
1,000,000
Common stock, $10 par
2,000,000
Income before income tax was $1,500,000 and income taxes were $200,000 for the current year. Cash dividends
paid on common stock during the current year totaled $150,000. The common stock sells for $70 per share at the
end of the year.
Determine each of the following:
(a)
Number of times interest charges are earned
(b)
Earnings per share on common stock
(c)
Price-earnings ratio
(d)
Dividends per share of common stock
(e)
Dividend yield
Round to one decimal place except earnings per share and dividends per share, which should be rounded to two
decimal places.
163.
Define solvency and profitability. How are they alike?
164.
A company reports the following:
Sales $2,400,000
Average total assets 1,500,000
Determine the ratio of sales to assets. Round your answer to one decimal place.
165.
A company reports the following:
Sales $2,520,000
Average total assets 1,400,000
Determine the ratio of sales to assets. Round your answer to one decimal place.
166.
A company reports the following income statement and balance sheet information for the current year:
Net income
$ 180,000
Interest expense
20,000
Average total assets
2,000,000
Determine the rate earned on total assets. Round your answer to one decimal place.
167.
A company reports the following:
Net income
$150,000
Preferred dividends
$10,000
Shares of common stock outstanding
20,000
Market price per share of common stock
$35
Calculate the company’s earnings per share on common stock.
168.
A company reports the following:
Net income
$ 350,000
Preferred dividends
50,000
Average stockholders’ equity
1,000,000
Average common stockholders’ equity
800,000
Determine the (a) rate earned on stockholders’ equity, and (b) rate earned on common stockholders’ equity. Round
to one decimal place.