155. A company reports the following:
Cost of goods sold
$610,000
Average inventory
$80,000
Determine the (a) inventory turnover, and (b) number of days’ sales in inventory. Round your answer to one decimal place.
156. The following information was taken from Slater Company’s balance sheet:
Fixed assets (net)
$1,250,000
Long-term liabilities
$500,000
Total liabilities
$672,000
Total stockholders’ equity
$1,680,000
Determine the company’s (a) Ratio of fixed assets to long-term liabilities, and (b) ratio of liabilities to stockholders’ equity. Round your answer to
one decimal place.
(a)
Ratio of fixed assets to long-term liabilities = Fixed assets / Long-term liabilities
Ratio of fixed assets to long-term liabilities = 2.5
(b)
Ratio of liabilities to total stockholders’ equity = Total liabilities / Total stockholders’ equity
Ratio of liabilities to total stockholders’ equity = $672,000 / $1,680,000
Inventory turnover = $610,000 / $80,000
Inventory turnover = 7.6
Number of days’ sales in inventory = $80,000 / ($610,000 / 365)
Number of days’ sales in inventory = 47.9 days
157. A company reports the following:
Income before income tax
$600,000
Interest expense
$150,000
158. A company reports the following:
Net sales
$2,400,000
Average total assets
$1,500,000
159. A company reports the following:
Net sales
$2,520,000
Average total assets
$1,400,000
Determine the ratio of net sales to total assets. Round your answer to one decimal place.
160. A company reports the following income statement and balance sheet information for the current year:
Net income
$ 180,000
Interest expense
$ 20,000
Average total assets
$ 2,000,000
Determine the rate earned on total assets. Round your answer to one decimal place.
161. A company reports the following:
Net income
$350,000
Preferred dividends
$50,000
Average stockholders’ equity
$1,000,000
Average common stockholders’ equity
$800,000
Determine the (a) rate earned on stockholders’ equity, and (b) rate earned on common stockholders’ equity. Round your answer to one decimal
place.
Rate earned on stockholders’ equity = Net income / Average stockholders’ equity
Rate earned on stockholders’ equity = $350,000 / $1,000,000
Rate earned on stockholders’ equity = 35.0%
Rate earned on common stockholders’ equity = (Net income – preferred dividends) /
Average common stockholders’ equity
Rate earned on common stockholders’ equity = ($350,000 – $50,000) / $800,000
Rate earned on common stockholders’ equity = 37.5%
162. A company reports the following:
Net income
$150,000
Preferred dividends
$ 10,000
Shares of common stock outstanding
20,000
Market price per share of common stock
$35.00
Determine the company’s earnings per share on common stock.
163. A company reports the following:
Net income
$270,000
Preferred dividends
$ 10,000
Shares of common stock outstanding
20,000
Market price per share of common stock
$36.40
Determine the company’s price-earnings ratio. Round your answer to one decimal place.
164. Why would you compare or not compare Coca-Cola and Pepsi-Cola (PepsiCo) as companies to each
other?
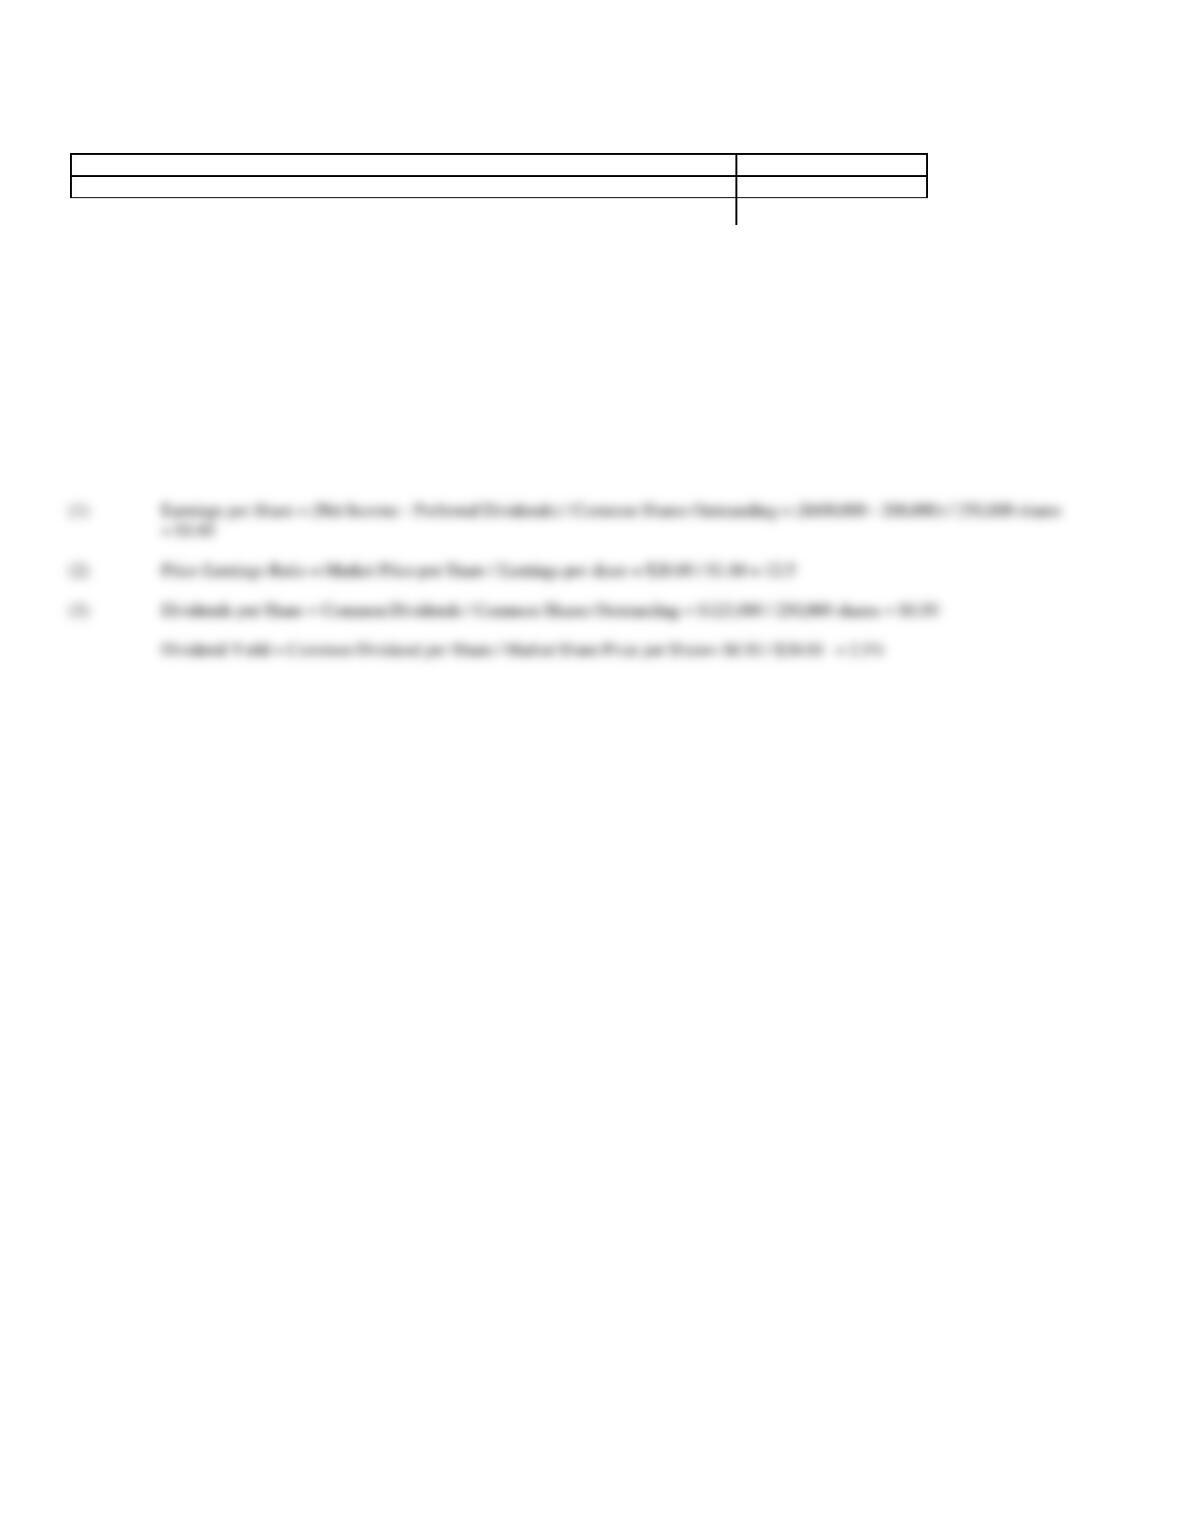
Earnings per share on common stock = (Net income – preferred dividends) / shares of common stock outstanding.
Earnings per share = ($150,000 – $10,000) / 20,000
Earnings per share = $7.00
165. Revenue and expense data for Young Technologies are as follows:
2012
2011
Sales
$500,000
$440,000
Cost of goods sold
325,000
242,000
Selling expense
70,000
79,200
Administrative expenses
75,000
70,400
Income tax expense
10,500
16,400
Required:
(1)
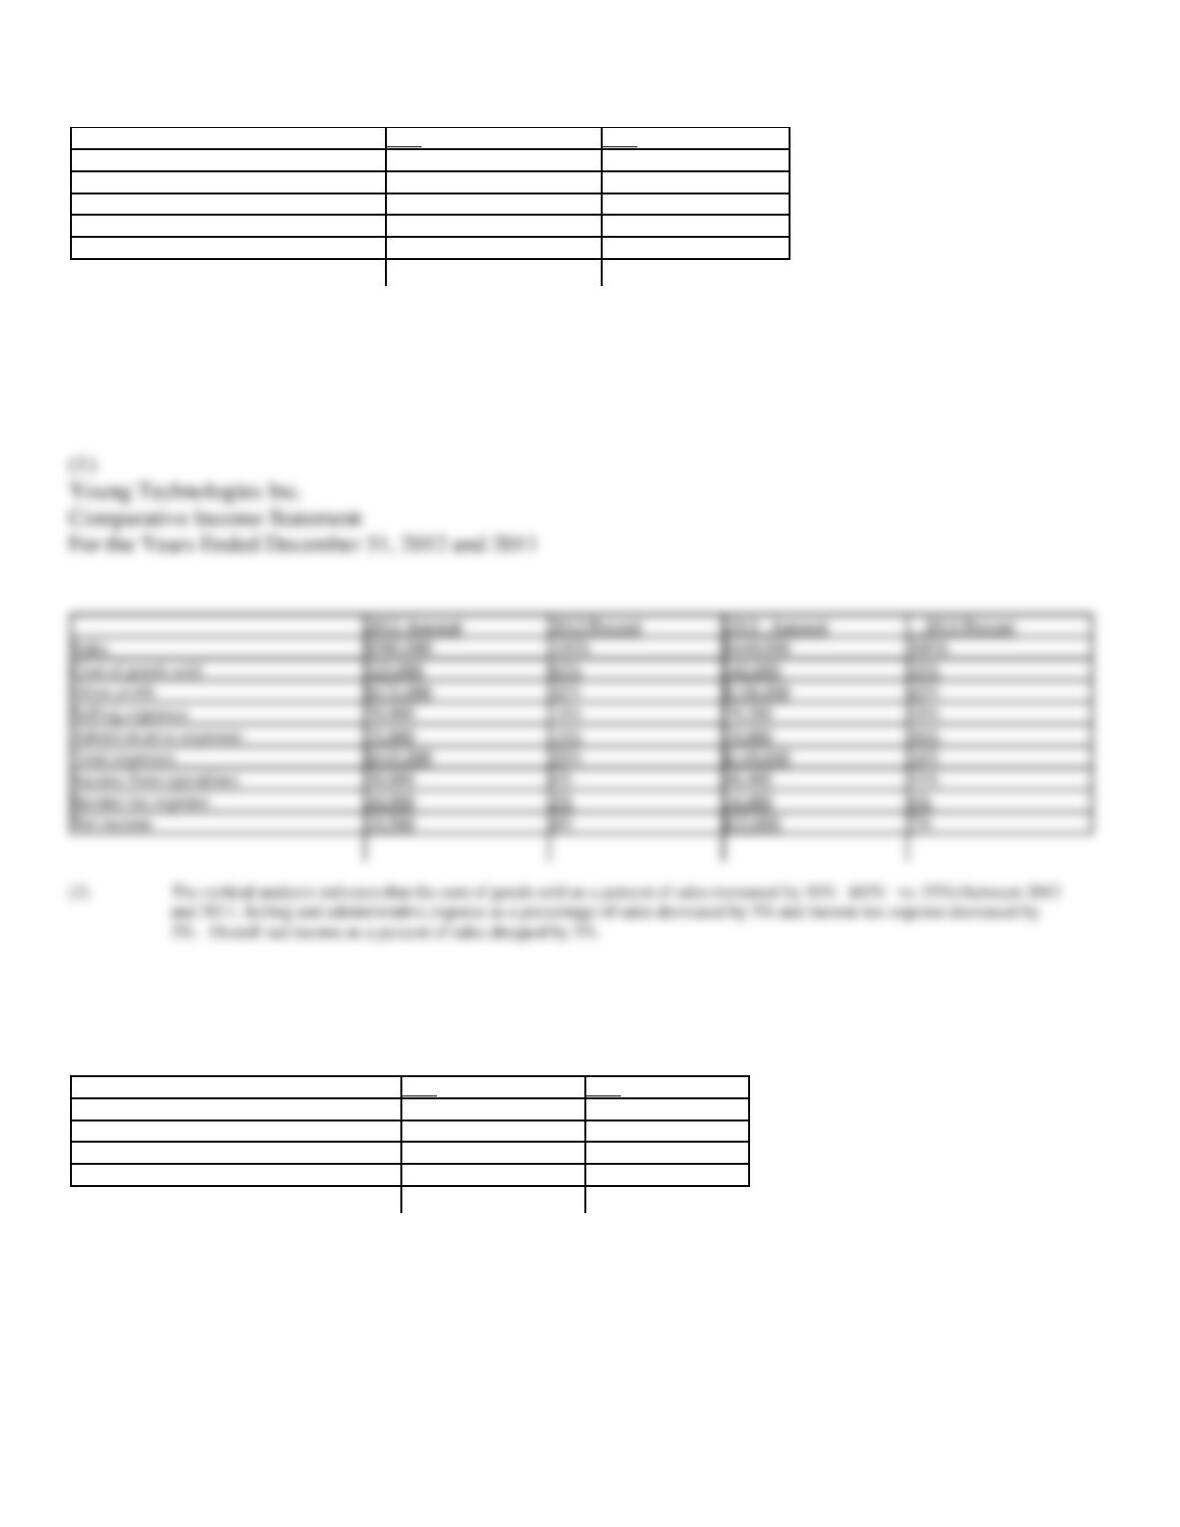
Prepare an income statement in comparative form, stating each item for both 2012 and 2011 as a percent of sales.
Round to the nearest decimal place..
(2)
Comment on the significant changes disclosed by the comparative income statement.
166. The following data were extracted from the income statement of Maine Solutions, Inc.
2012
2011
Sales
$1,139,600
$1,192,320
Beginning inventories
80,000
64,000
Cost of goods sold
500,800
606,000
Ending inventories
72,000
80,000
Required:
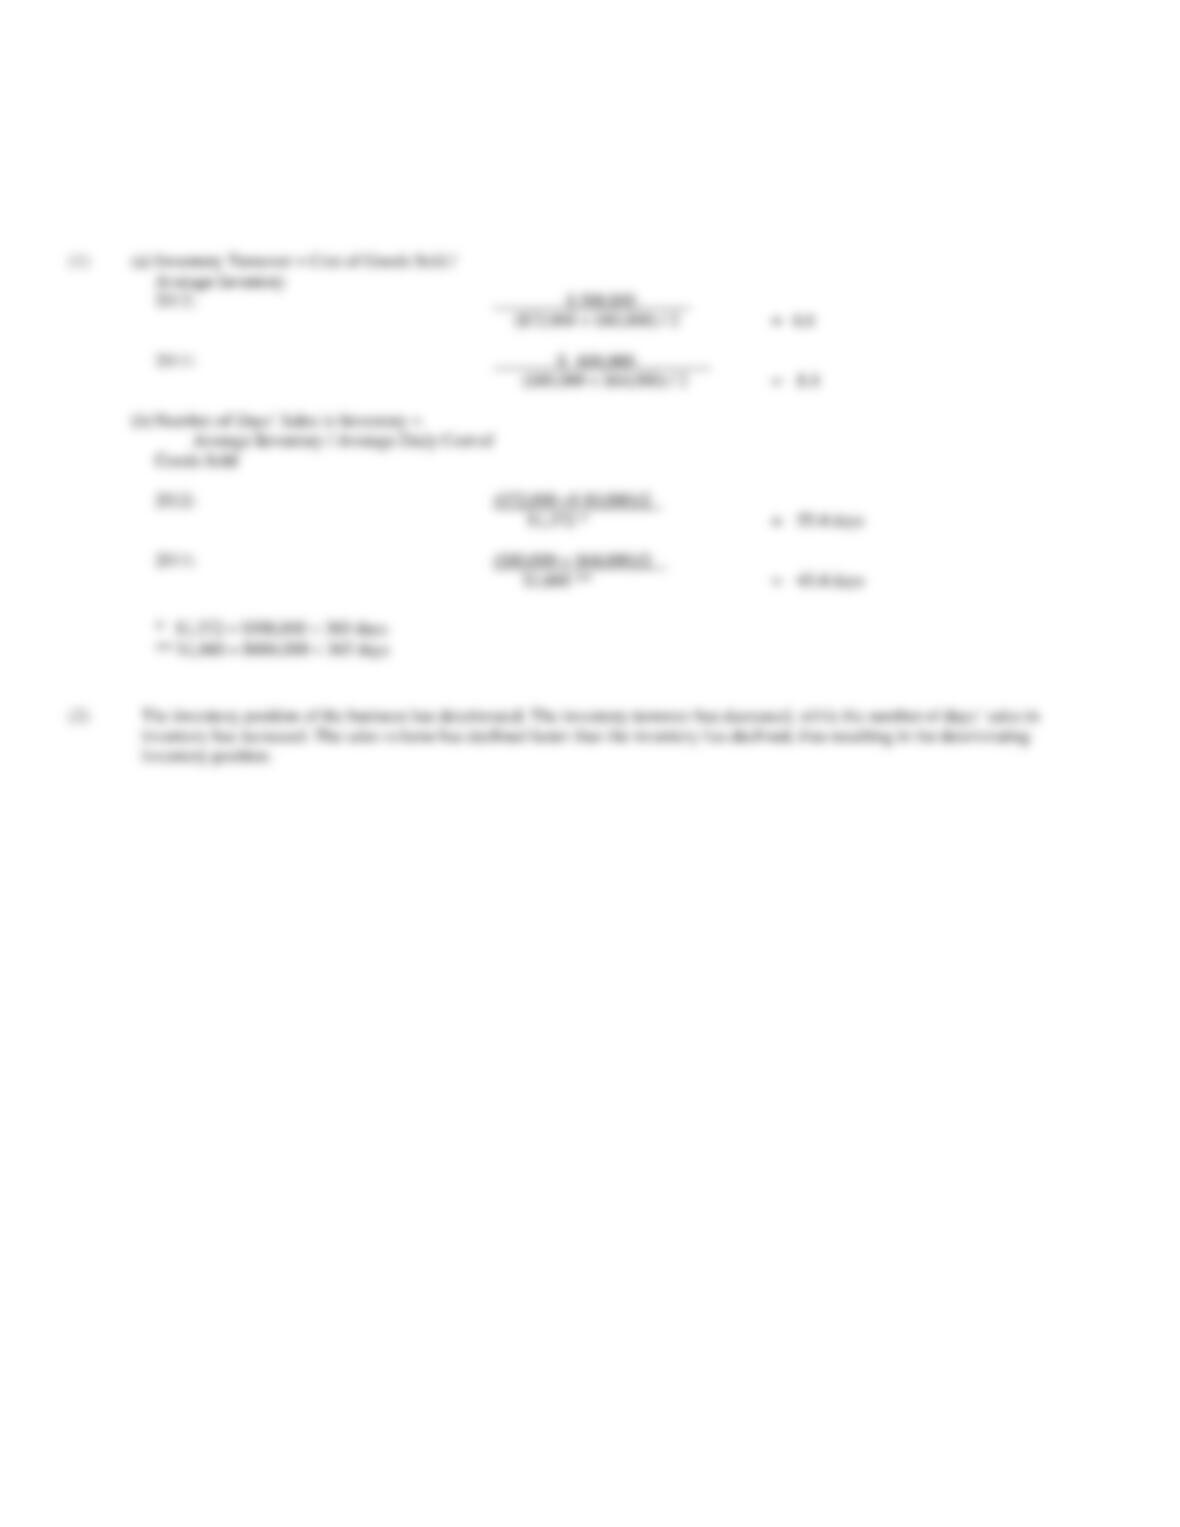
(1)
Determine for each year:
a.
The inventory turnover; and
b.
The number of days’ sales in inventory. Round intermediate
calculation to the nearest whole number and your final answer to one
decimal place.
2012 Amount
2012 Percent
2011 Amount
2011 Percent
Sales
$500,000
100%
$440,000
100%
Cost of goods sold
325,000
65%
242,000
55%
Gross profit
$175,000
$198,000
Selling expenses
70,000
14%
79,200
18%
Administrative expenses
75,000
15%
70,400
16%
Total expenses
$145,000
$149,600
Income from operations
30,000
48,400
11%
Net income
19,500
4%
$32,000
7%
(2)
What conclusions can be drawn from these
data concerning the inventories?
167. The following selected data were taken from the financial statements of the Berrol Group for December
31, 2012, 2011, and 2010:
Dec. 31, 2012
Dec.31, 2011
Dec. 31, 2010
Total assets
$3,000,000
$2,700,000
$2,400,000
Notes payable (10% interest)
1,000,000
1,000,000
1,000,000
Common stock
400,000
400,000
400,000
Preferred $6 stock, $100 par (no change
during year)
200,000
200,000
200,000
Retained earnings
1,126,000
896,000
600,000
The 2012 net income was $242,000 and the 2011 net income was $308,000. No dividends on common stock were declared between 2010 and 2012.
Required:
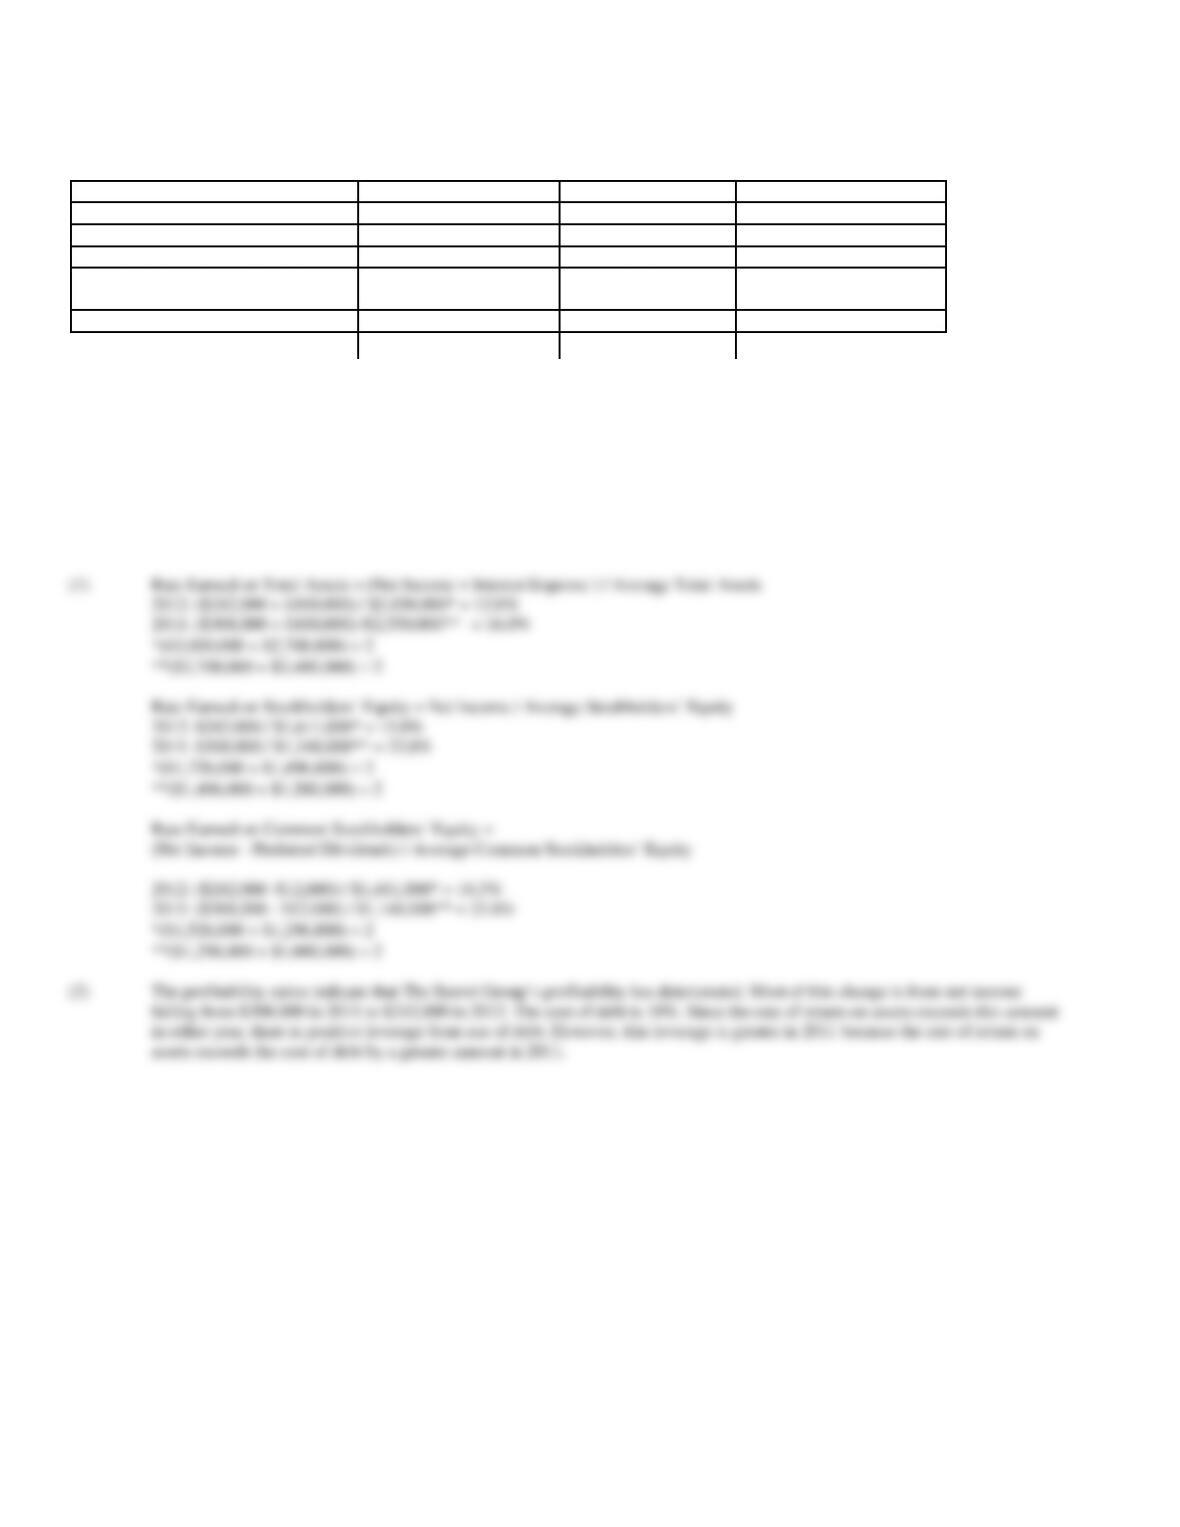
(1) Determine the rate earned on total assets, the rate earned on stockholders’ equity, and the rate earned on common stockholders’ equity for the
years 2012 and 2011. Round to one decimal place.
(2) What conclusion can be drawn from these data as to the company’s profitability?
(1)
Rate Earned on Total Assets = (Net Income + Interest Expense ) / Average Total Assets
2012: ($242,000 + $100,000) / $2,850,000* = 12.0%
2011: ($308,000 + $100,000) /$2,550,000** = 16.0%
*($3,000,000 + $2,700,000) 2
**($2,700,000 + $2,400,000) 2
Rate Earned on Stockholders’ Equity = Net Income / Average Stockholders’ Equity
2012: $242,000 / $1,611,000* = 15.0%
2011: $308,000 / $1,348,000** = 22.8%
*($1,726,000 + $1,496,000) 2
**($1,496,000 + $1,200,000) 2
Rate Earned on Common Stockholders’ Equity =
(Net Income – Preferred Dividends) / Average Common Stockholders’ Equity
2012: ($242,000 -$12,000) / $1,411,000* = 16.3%
2011: ($308,000 – $12,000) / $1,148,000** = 25.8%
*($1,526,000 + $1,296,000) 2
**($1,296,000 + $1,000,000) 2
168. The balance sheet for Borglum Company at the end of the current fiscal year indicated the following:
Bonds payable, 10% (issued in 2000, due in 2020)
$5,000,000
Preferred 10% stock, $100 par
1,000,000
Common stock, $10 par
2,000,000
Income before income tax was $1,500,000 and income taxes were $200,000, for the current year. Cash dividends paid on common stock during the
current year totaled $150,000. The common stock was selling for $70 per share at the end of the year.
Required:
Determine each of the following:
(1)
Number of times interest charges are earned;
(2)
Earnings per share on common stock;
(3)
Price-earnings ratio;
(4)
Dividends per share of common stock; and
(5)
Dividend yield.
Round to one decimal place except earnings per share and dividends per share, which should be rounded to two decimal places.
(1)
Number of Times Interest Charges Are Earned =
(Income Before Tax + Interest Expense) / Interest Expense
($1,500,000 + $500,000) / $500,000 = 4.0 times
($1,300,000 – $100,000) / 200,000 shares = $6.00
(3)
Price-Earnings Ratio = Market Price per Share / Earnings per Share
$70.00 / $6.00 = 11.7
(4)
Dividends per Share of Common Stock =
Common Dividends / Common Shares Outstanding
$150,000 / 200,000 shares = $0.75
(5)
Dividend Yield = Common Dividend per Share / Share Price
$0.75 / $70.00 = 1.1%
169. The following information was taken from the financial statement of Fox Resources for December 31 of
the current fiscal year:
Common stock, $20 par value (no change during the year)
$5,000,000
Preferred 10% stock, $40 par (no change during the year)
2,000,000
The net income was $600,000 and the declared dividends on the common stock were $125,000 for the current year. The market price of the common
stock is $20 per share.
Required:
Calculate for the common stock:
(1) earnings per share
(2) the price-earnings ratio
(3) the dividends per share and the dividend yield.
Round to one decimal place except earnings per share, which should be rounded to two decimal places.
(2)
Price-Earnings Ratio = Market Price per Share / Earnings per share = $20.00 / $1.60 = 12.5
Dividend Yield = Common Dividend per Share / Market Share Price per Share= $0.50 / $20.00 = 2.5%
170. Bradenton Company reports the following for 2012:
Income from continuing operations before income tax
$500,000
Extraordinary property loss from hurricane
$60,000*
Loss from discontinued operations
$90,000*
Weighted average number of shares outstanding
40,000
Applicable tax rate
40%
* Net of any tax effect
Required:
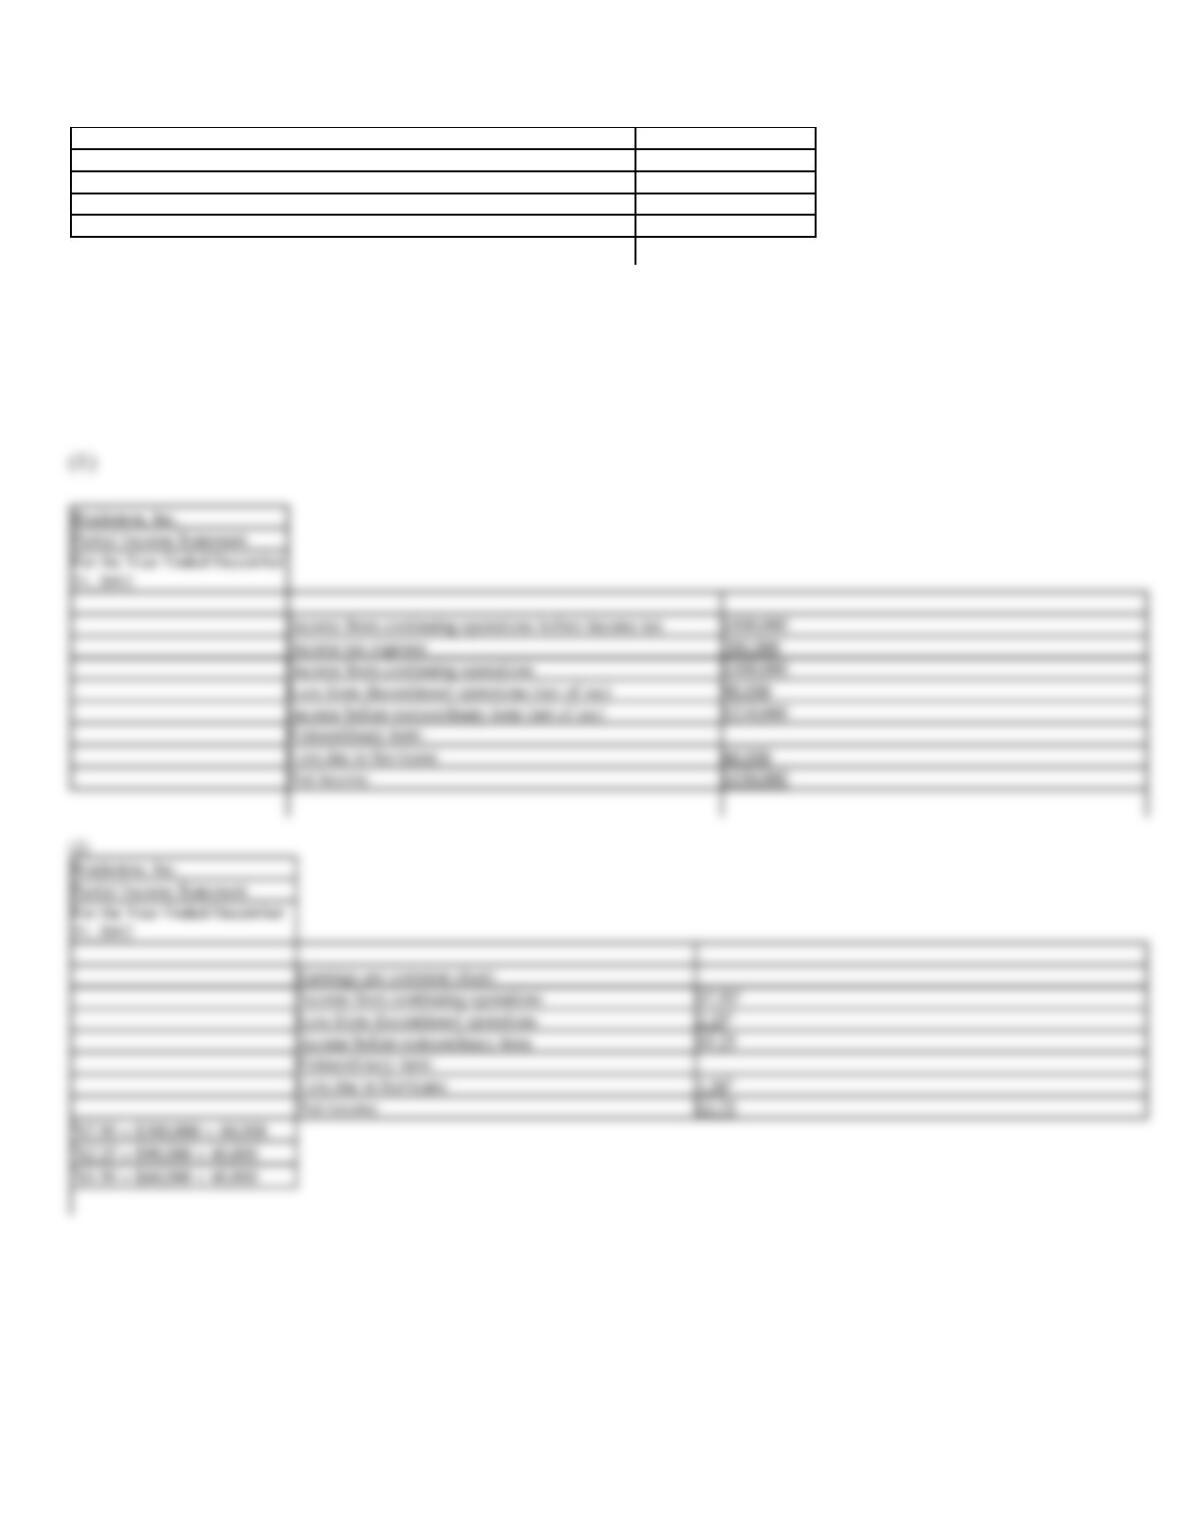
(1)
Prepare a partial income statement for Bradenton Company beginning with income from continuing operations before
income tax.
(2)
Calculate the earnings per common share for Bradenton, including per-share amount for unusual items.
Bradenton, Inc.
Partial Income Statement
For the Year Ended December
31, 2012
Income from continuing operations before income tax
$500,000
Income tax expense
200,000
Income from continuing operations
$300,000
Loss from discontinued operations (net of tax)
90,000
Income before extraordinary item (net of tax)
$210,000
Extraordinary item:
Loss due to hurricane
60,000
Net income
$150,000
Bradenton, Inc.
Partial Income Statement
For the Year Ended December
Earnings per common share:
Income from continuing operations
Loss from discontinued operations
Income before extraordinary item
$5.25
Extraordinary item:
Loss due to hurricane
Net income
$3.75
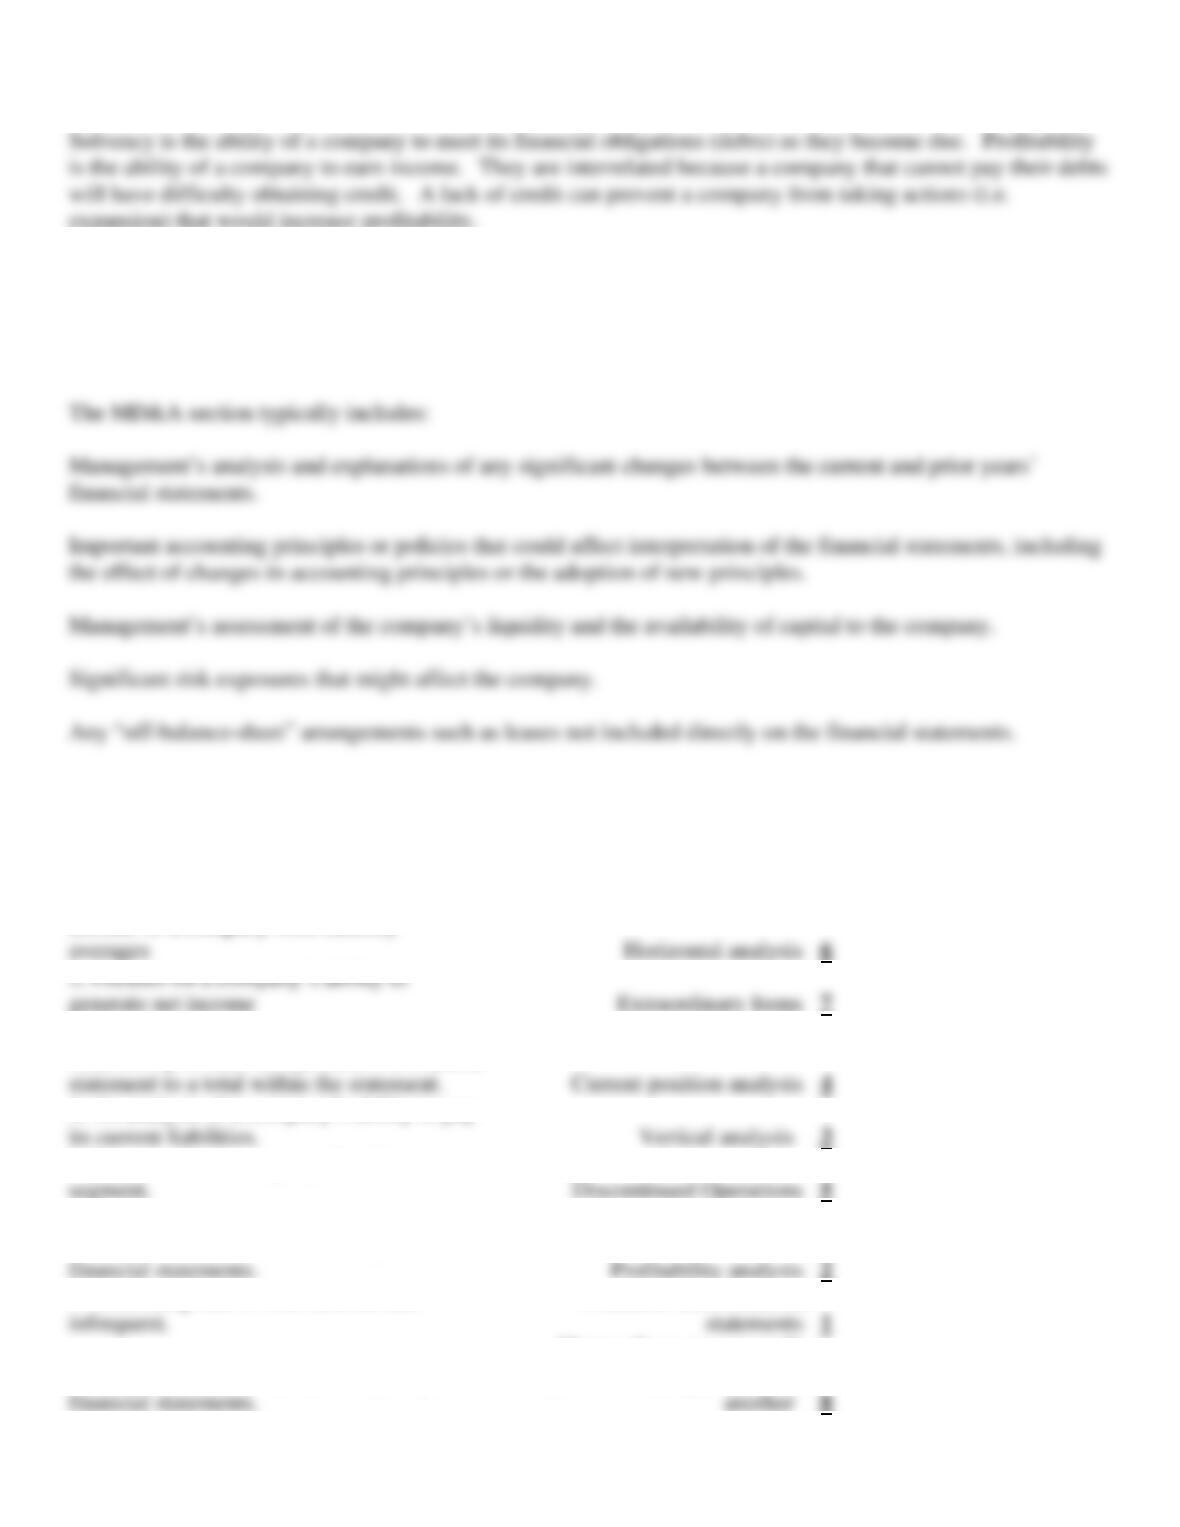
171. Define solvency and profitability. How are they alike?
172. What information is generally included in the Management Discussion and Analysis (MD&A) section of a
corporate annual report?
173. Match each item with its definition.
1. Useful for comparing one company to
another or a company with industry
2. Focuses on a company’s ability to
3. The percentage analysis of the
relationship of each component in a financial
4. An analysis of a company’s ability to pay
5. Occurs when a company abandons a
6. A percentage analysis of increases and
decreases in related items in comparative
7. Something that is both unusual and
Common-sized financial
8. This requires a restatement of prior period
Change from one generally
accepted accounting principle to
174. Comparative information taken from the Koda Company financial statements is shown below:
2012 _
2011
(a)
Notes receivable
$ 10,000
$ -0-
(b)
Accounts receivable
106,200
90,000
(c)
Retained earnings
30,000
(40,000)
(d)
Sales
654,000
600,000
(e)
Operating expenses
160,000
200,000
(f)
Income taxes payable
28,000
20,000
Instructions
Using horizontal analysis, show the percentage change from 2011 to 2012 with 2011 as the base year.
175. The following items were taken from the financial statements of Stanton, Inc., over a three-year period:
Item
2012
2011
2010
Net Sales
$360,000
$335,000
$300,000
Cost of Goods Sold
225,000
205,000
190,000
Gross Profit
$135,000
$130,000
$110,000
Compute the following for each of the above time periods.
a.
The amount and percentage change from 2011 to 2012.
b.
The amount and percentage change from 2010 to 2011.
Round percentage to one decimal place.
Item
(a) 2012
(b) 2011
$
Percent
Percent_
Net Sales
25,000
7.5
35,000
11.7
Cost of Goods Sold
20,000
9.8
15,000
7.9
Gross Profit
5,000
3.8
20,000
18.2
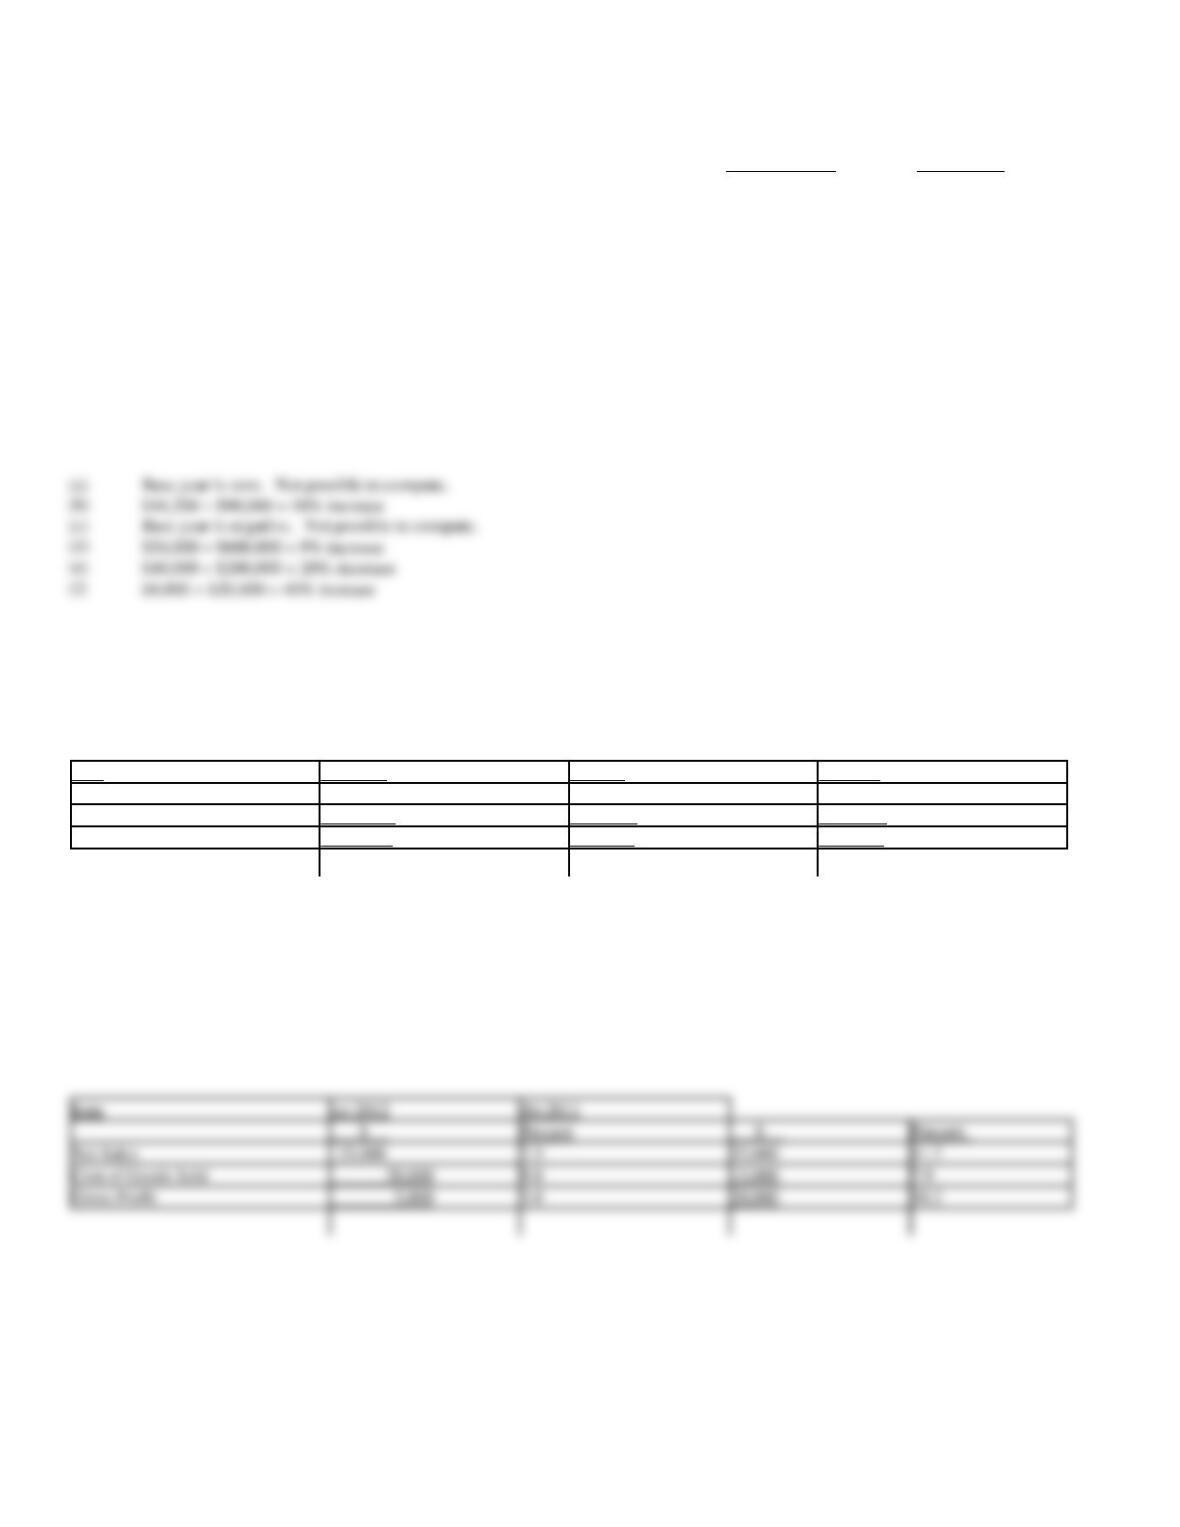
(a)
Base year is zero. Not possible to compute.
$16,200 $90,000 = 18% increase
(c)
Base year is negative. Not possible to compute.
$54,000 $600,000 = 9% increase
$40,000 $200,000 = 20% decrease