Chapter 15: Inference for Regression – Quiz A Name_________________________
Use the following for questions 1 – 7:
A sales manager was interested in determining if there is a relationship between college
GPA and sales performance among salespeople hired within the last year. A sample of
recently hired salespeople was selected and college GPA and the number of units sold
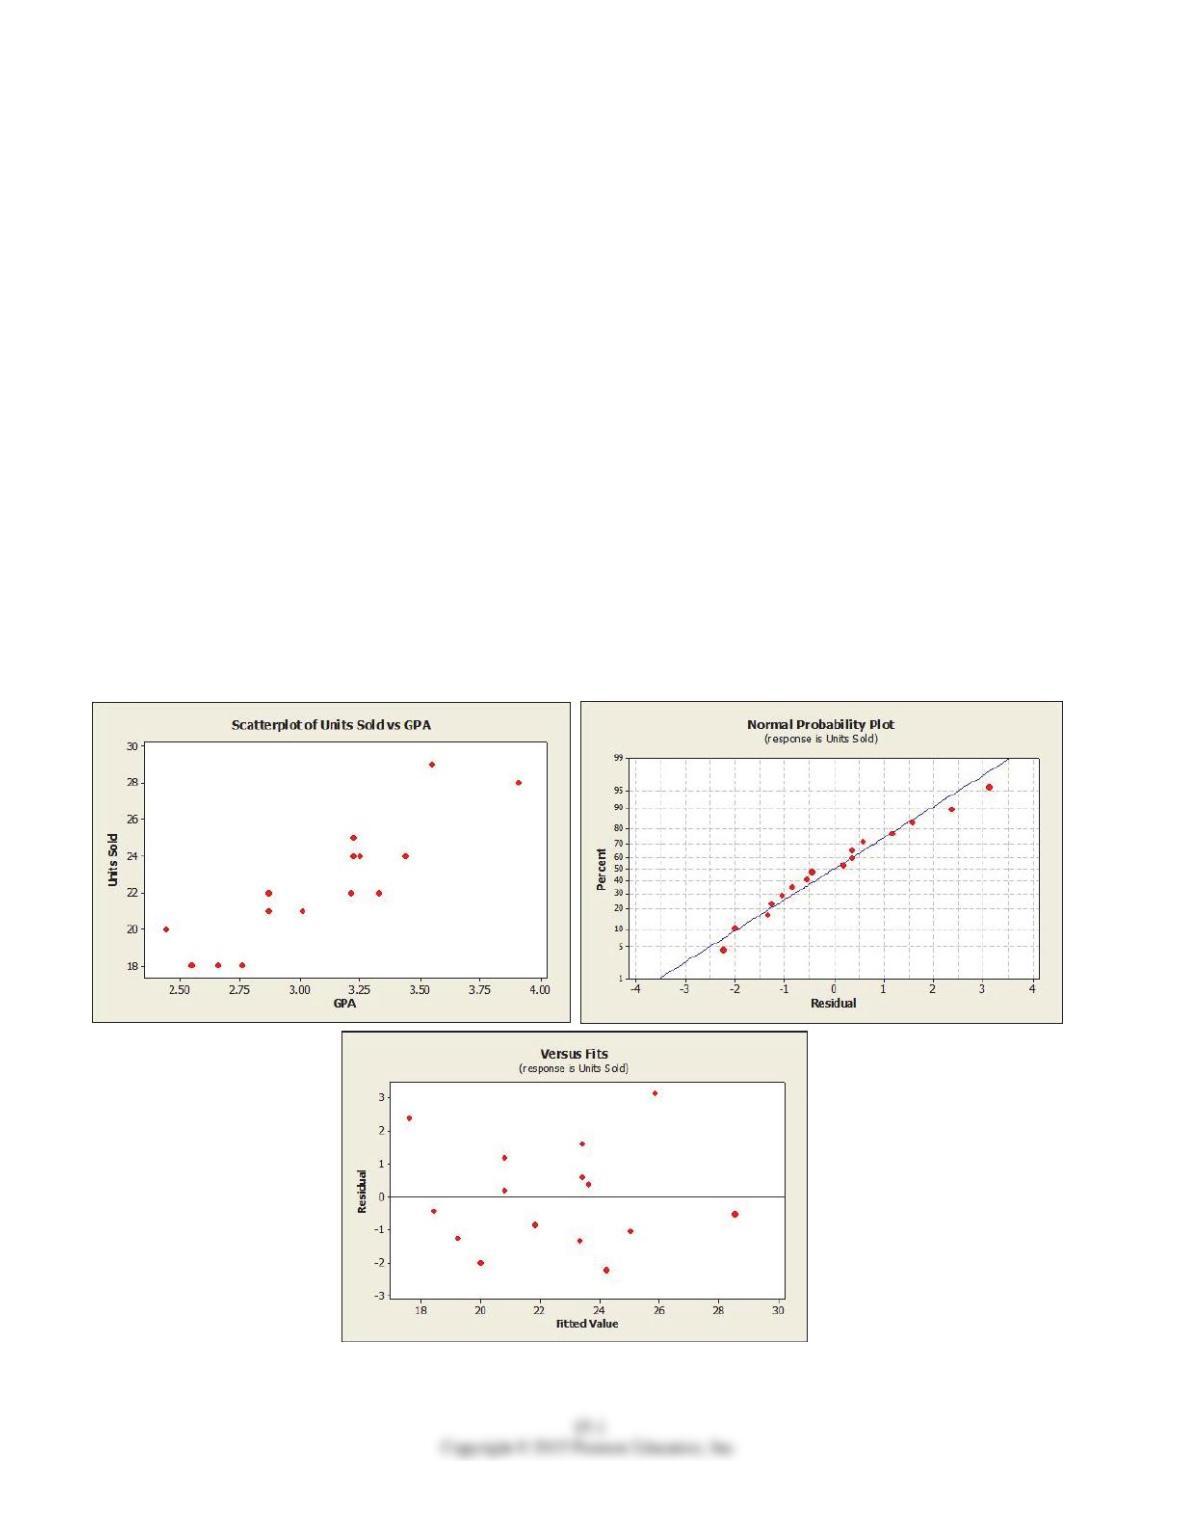
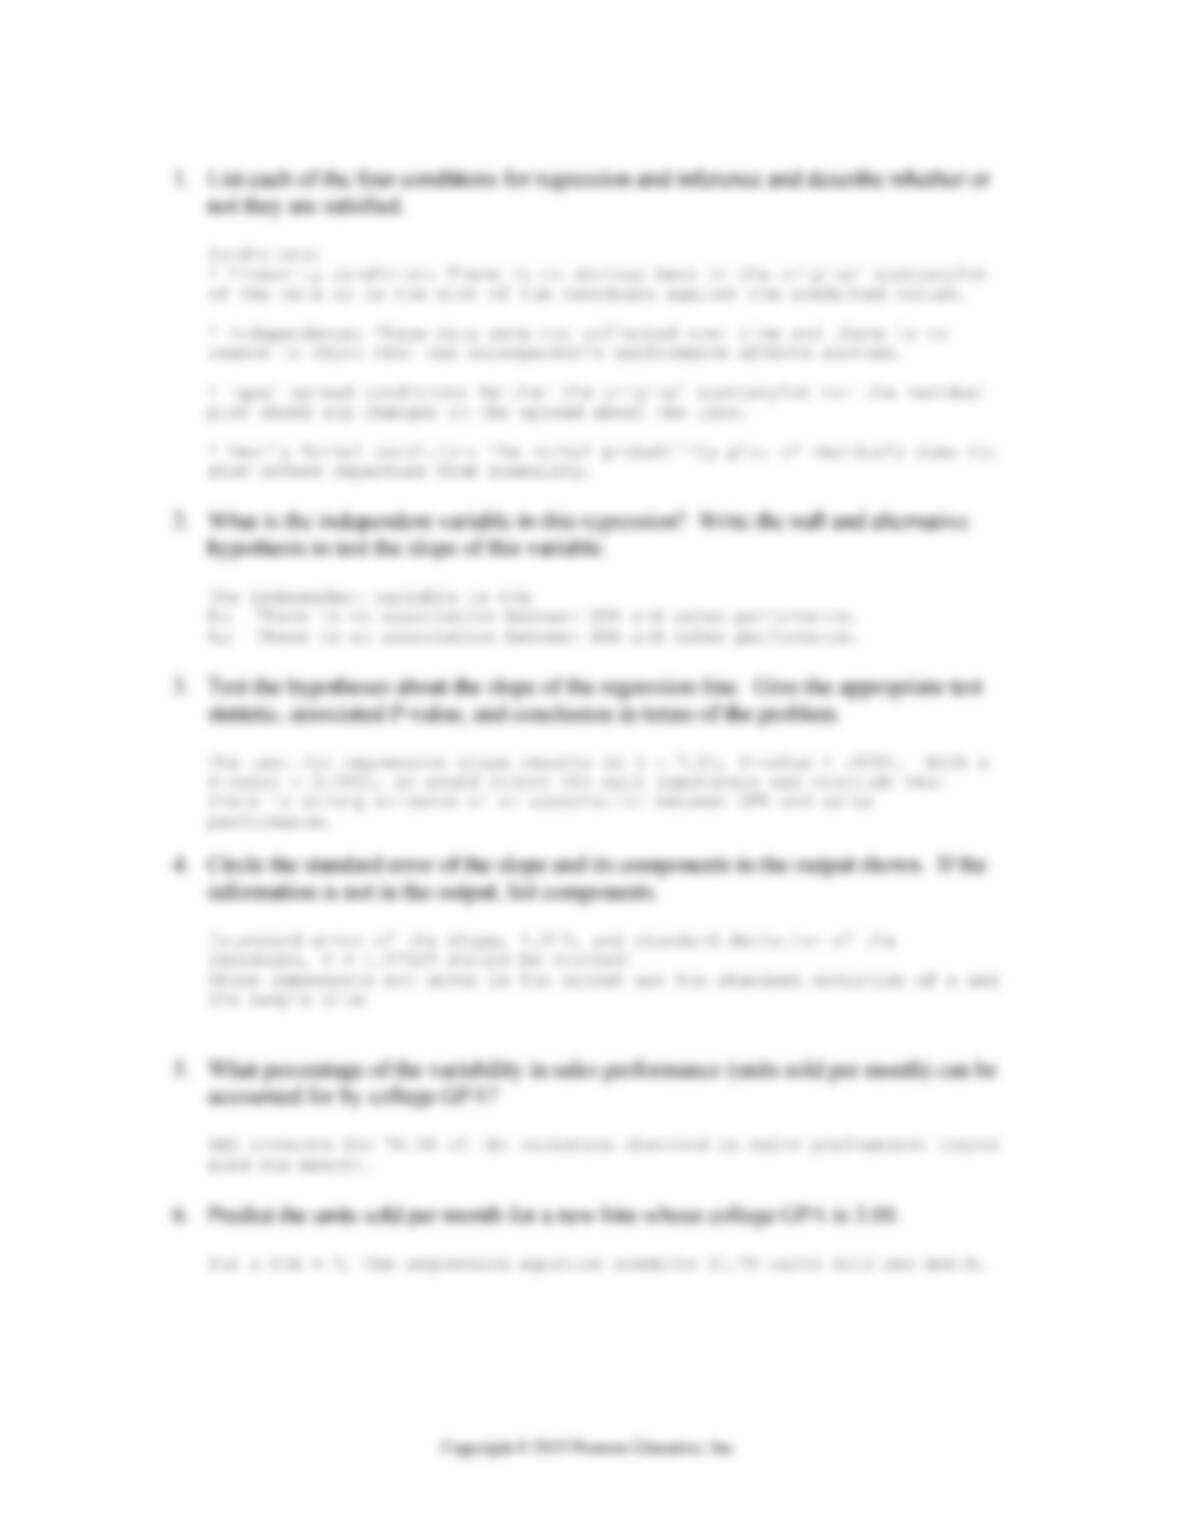
last month recorded. Below are the scatterplot, regression results, and residual plots for
these data.
The regression equation is
Units Sold = – 0.48 + 7.42 GPA
Predictor Coef SE Coef T P
Constant -0.484 3.256 -0.15 0.884
GPA 7.423 1.044 7.11 0.000
S = 1.57429 R-Sq = 78.3% R-Sq(adj) = 76.8%
Analysis of Variance
Source DF SS MS F P
Regression 1 125.30 125.30 50.56 0.000
Residual Error 14 34.70 2.48
Total 15 160.00

15-2 Chapter 15 Inference for Regression
15.2.3 Check the assumptions and conditions for regression inference.
1. List each of the four conditions for regression and inference and describe whether or
not they are satisfied.
15.1.2 Conduct inference on the slope of a regression equation.
2. What is the independent variable in this regression? Write the null and alternative
hypothesis to test the slope of this variable.
15.1.2 Conduct inference on the slope of a regression equation.
3. Test the hypotheses about the slope of the regression line. Give the appropriate test
statistic, associated P-value, and conclusion in terms of the problem.
15.1.1 Use regression equations to make predictions and calculate residuals and standard
errors.
4. Circle the standard error of the slope and its components in the output shown. If the
information is not in the output, list components.
15.1.5 Interpret technology outputs.
5. What percentage of the variability in sales performance (units sold per month) can be
accounted for by college GPA?
15.1.1 Use regression equations to make predictions and calculate residuals and standard
errors.
6. Predict the units sold per month for a new hire whose college GPA is 3.00.
15.4.4 Create, interpret, and apply confidence and prediction intervals.
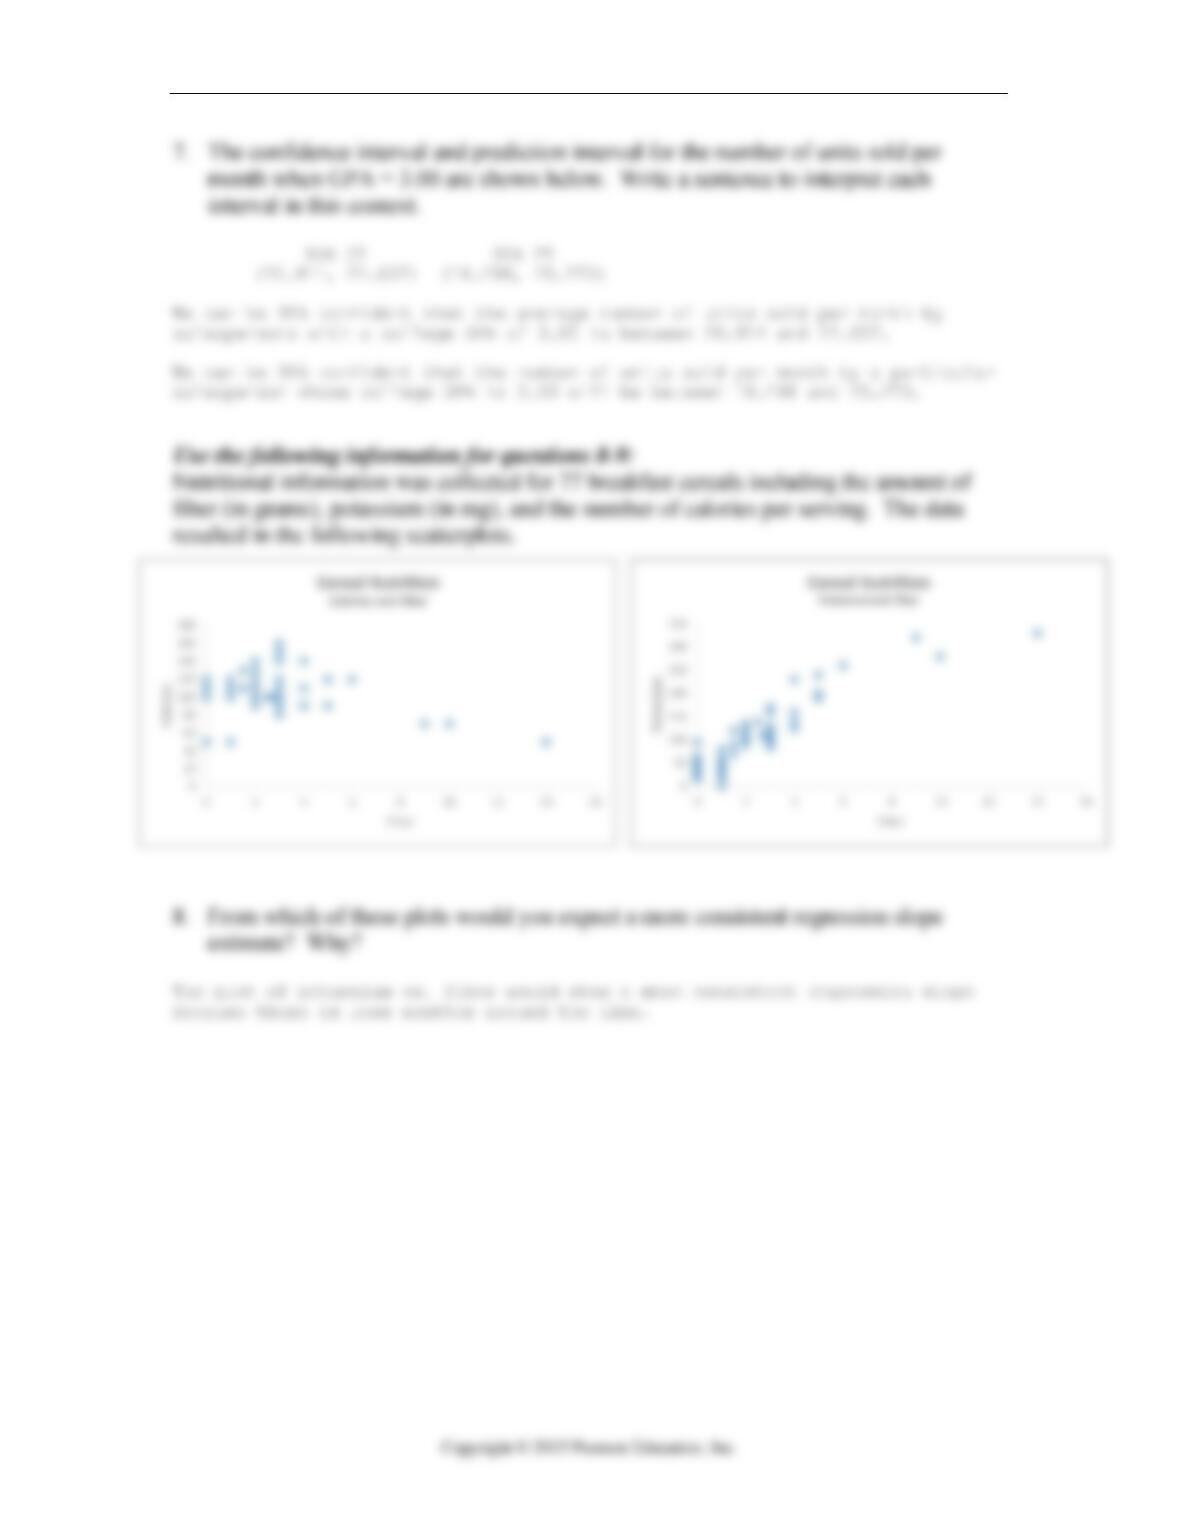
7. The confidence interval and prediction interval for the number of units sold per
month when GPA = 3.00 are shown below. Write a sentence to interpret each
interval in this context.
95% CI 95% PI
(20.914, 22.657) (18.298, 25.273)
Quiz A 15-3
Use the following information for questions 8-9:
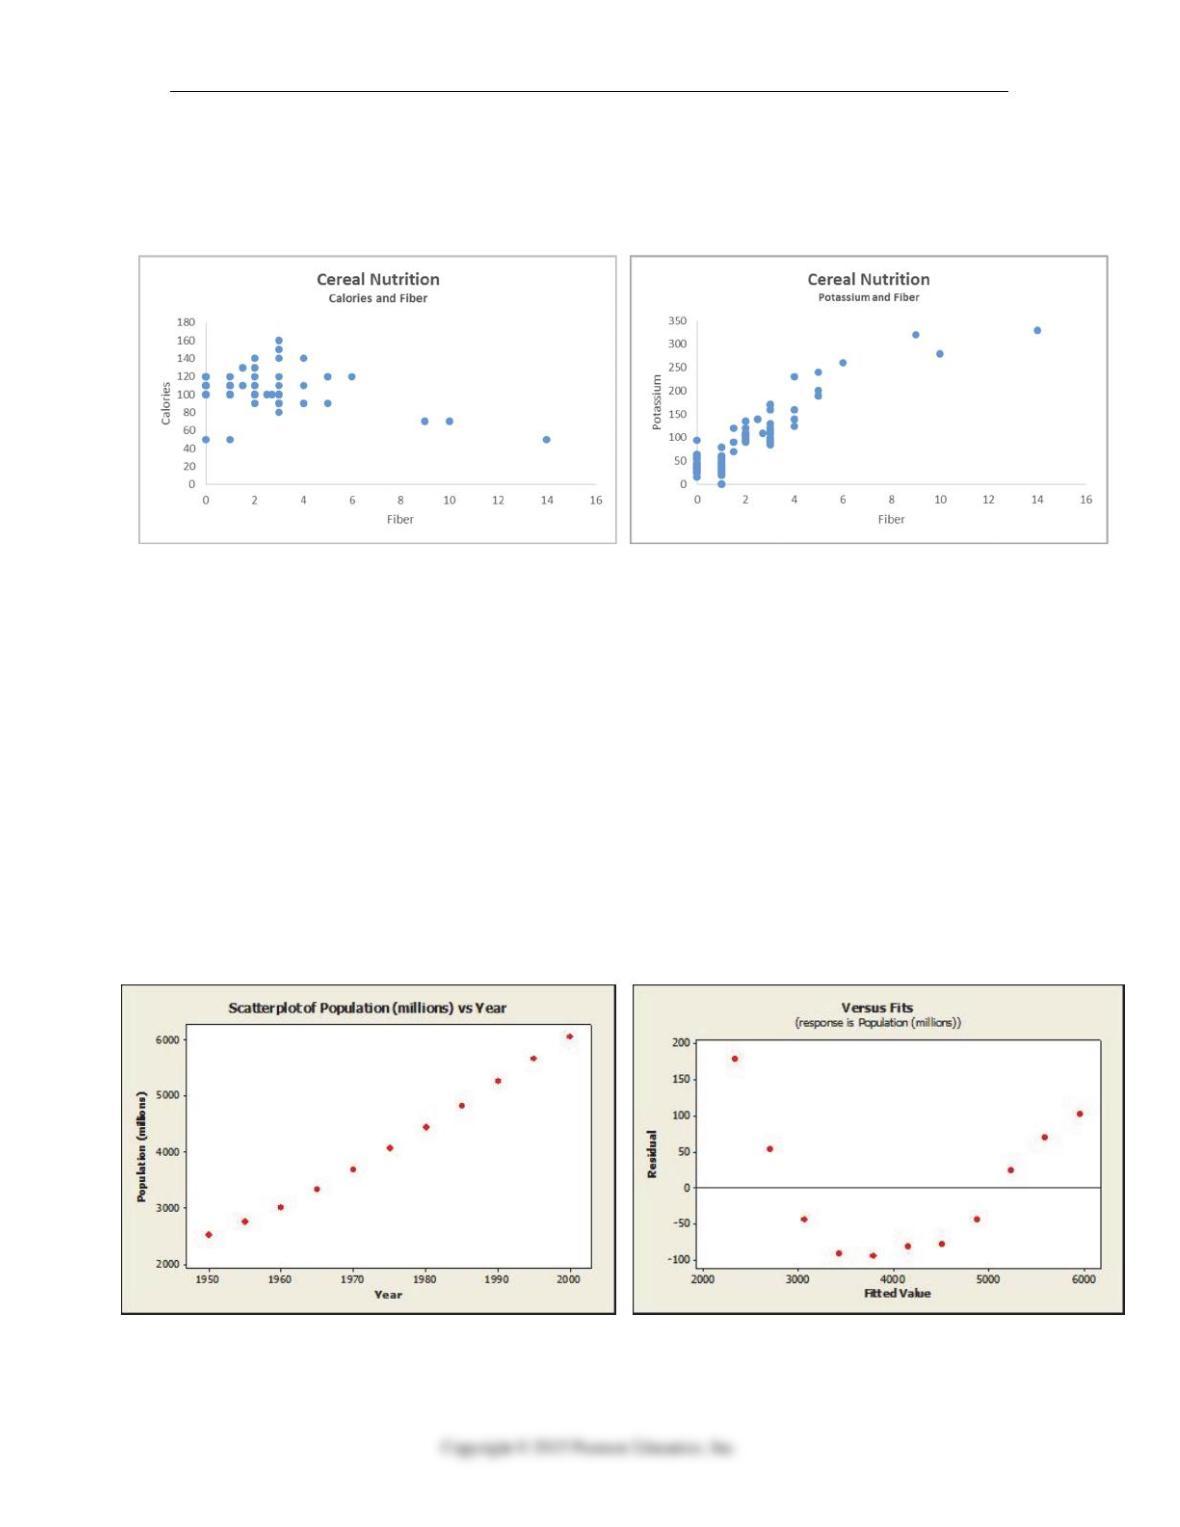
Nutritional information was collected for 77 breakfast cereals including the amount of
fiber (in grams), potassium (in mg), and the number of calories per serving. The data
resulted in the following scatterplots.
15.1.1 Check the assumptions and conditions for regression inference.
8. From which of these plots would you expect a more consistent regression slope
estimate? Why?
15.3. Check the assumptions and conditions for regression inference.
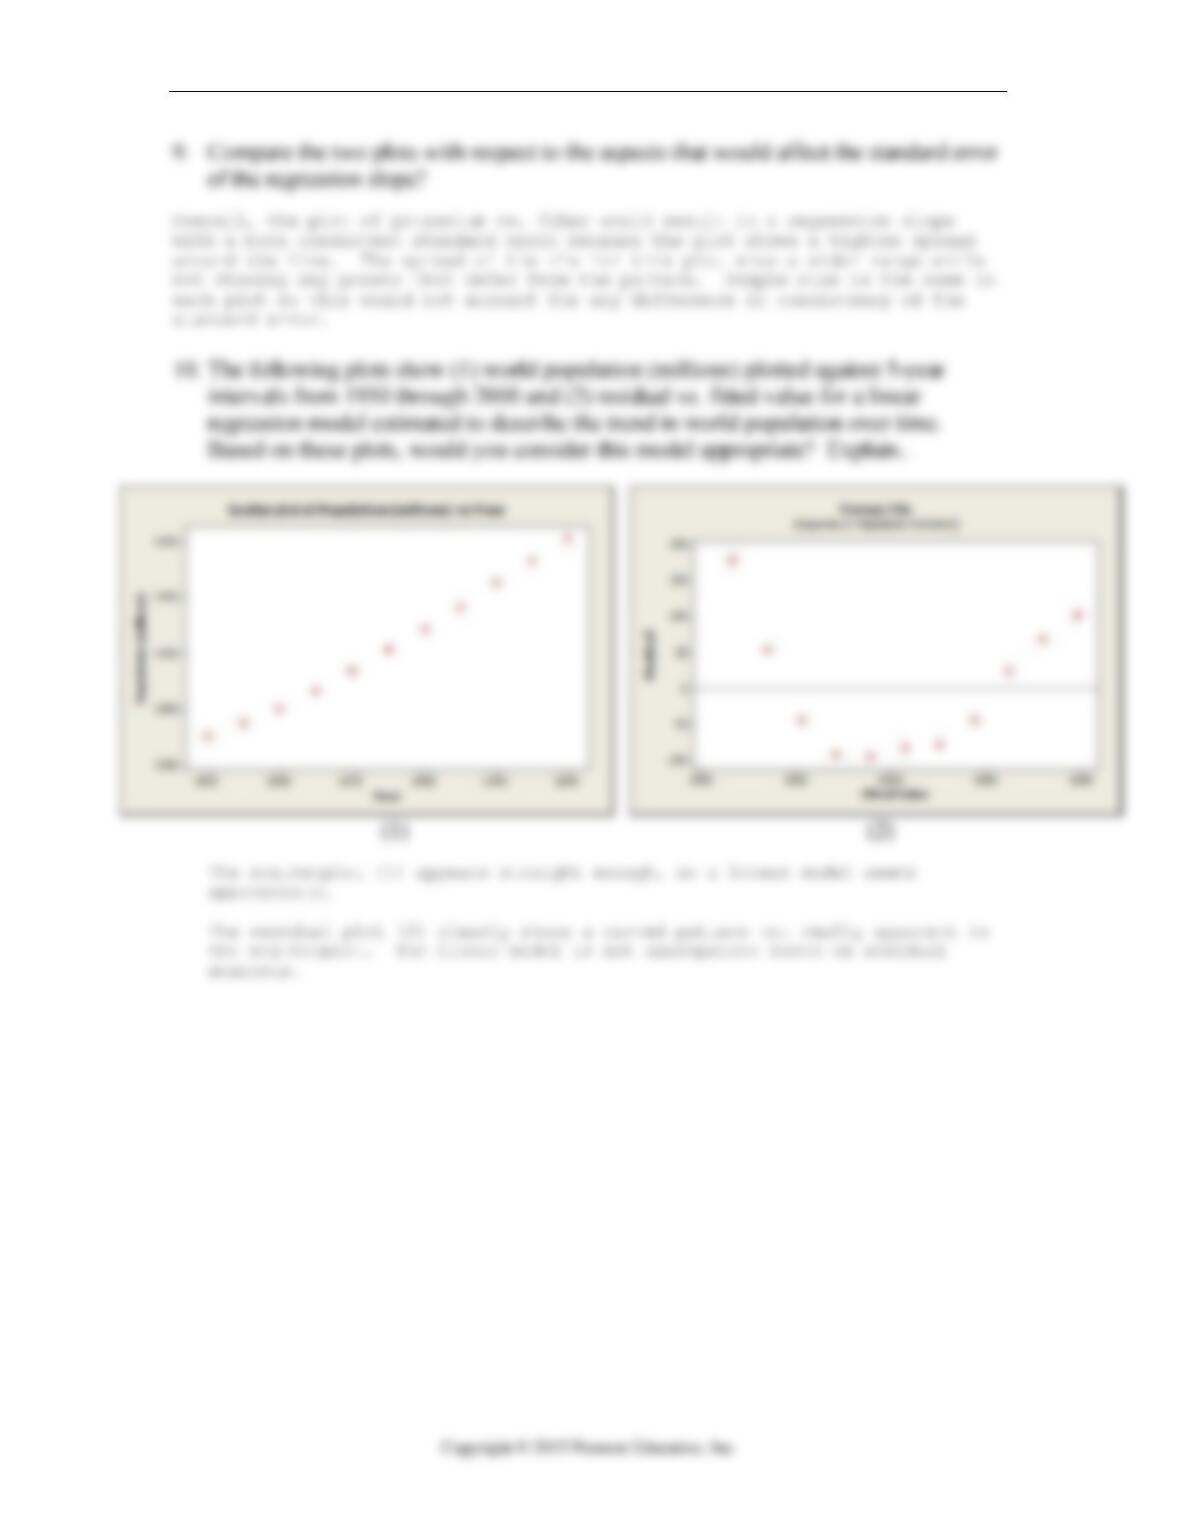
9. Compare the two plots with respect to the aspects that would affect the standard error
of the regression slope?
15.2.3 Check the assumptions and conditions for regression inference.
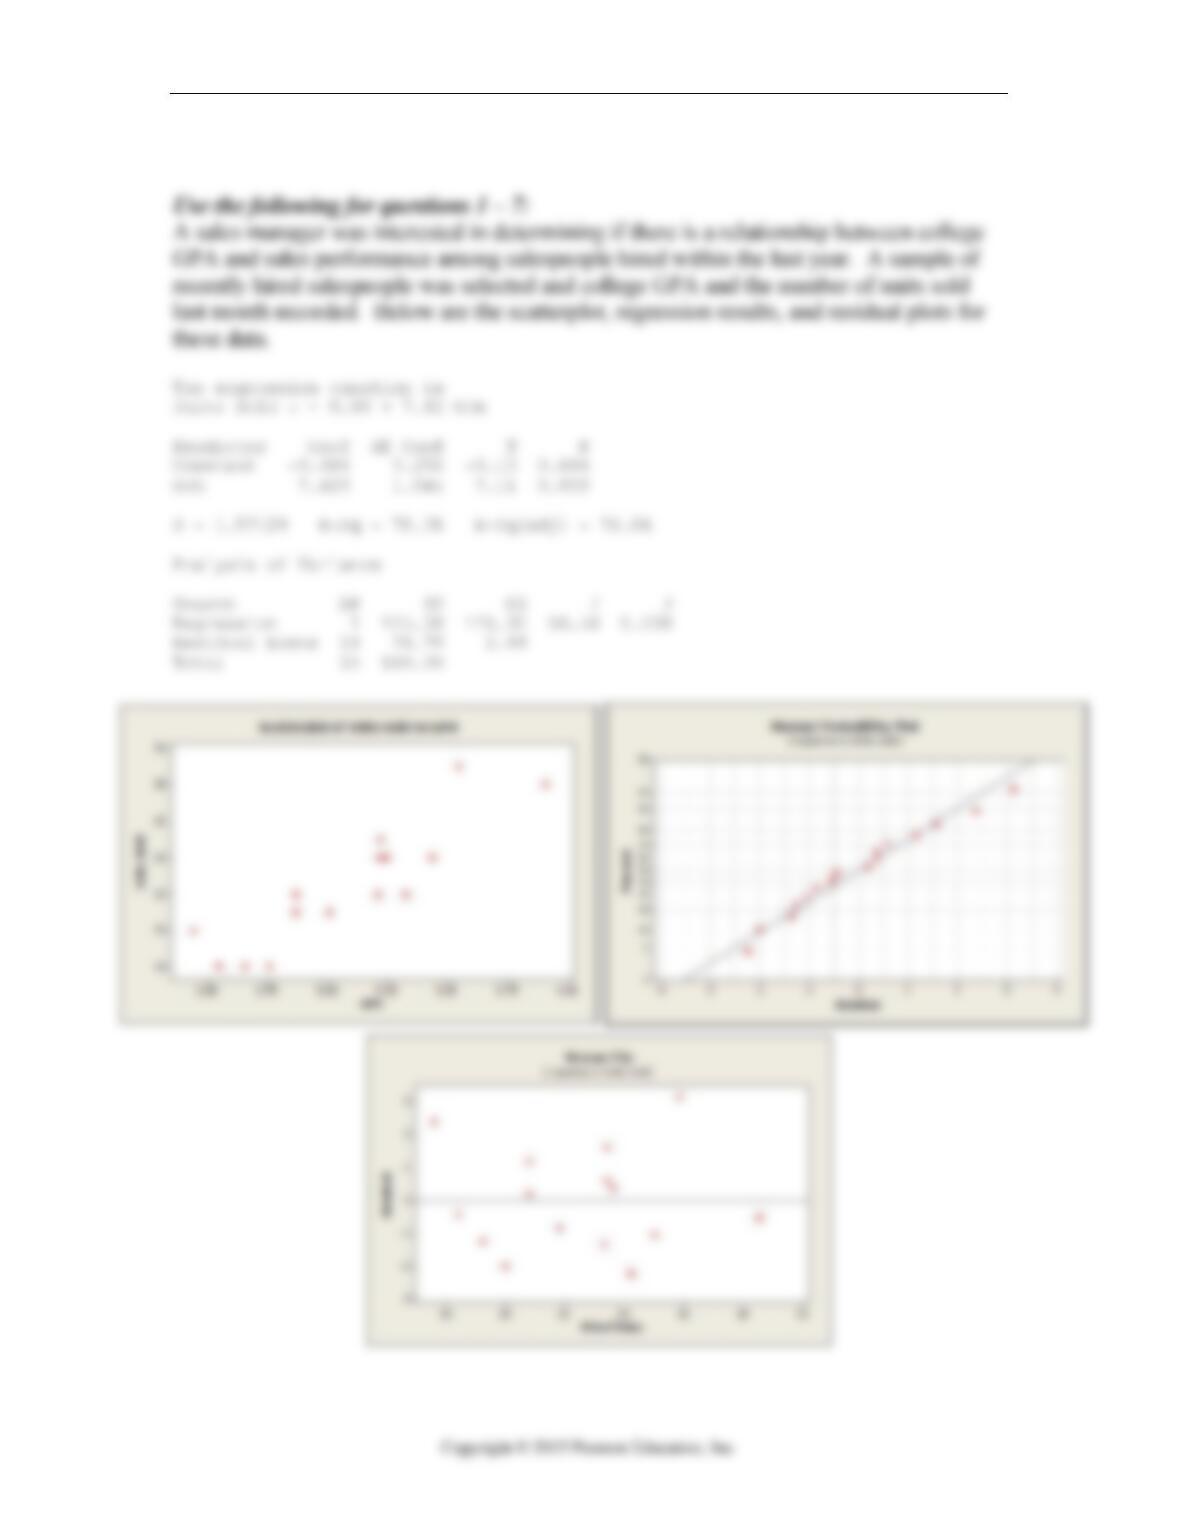
10. The following plots show (1) world population (millions) plotted against 5-year
intervals from 1950 through 2000 and (2) residual vs. fitted value for a linear
regression model estimated to describe the trend in world population over time.
Based on these plots, would you consider this model appropriate? Explain.
.
(1) (2)
15-4 Chapter 15 Inference for Regression
Chapter 15: Inference for Regression – Quiz A – Key
Quiz A 15-5
15-6
Chapter 15 Inference for Regression
Quiz A 15-7
15-8 Chapter 15 Inference for Regression
Chapter 15: Inference for Regression – Quiz B Name_________________________
Use the following for questions 1 – 7:
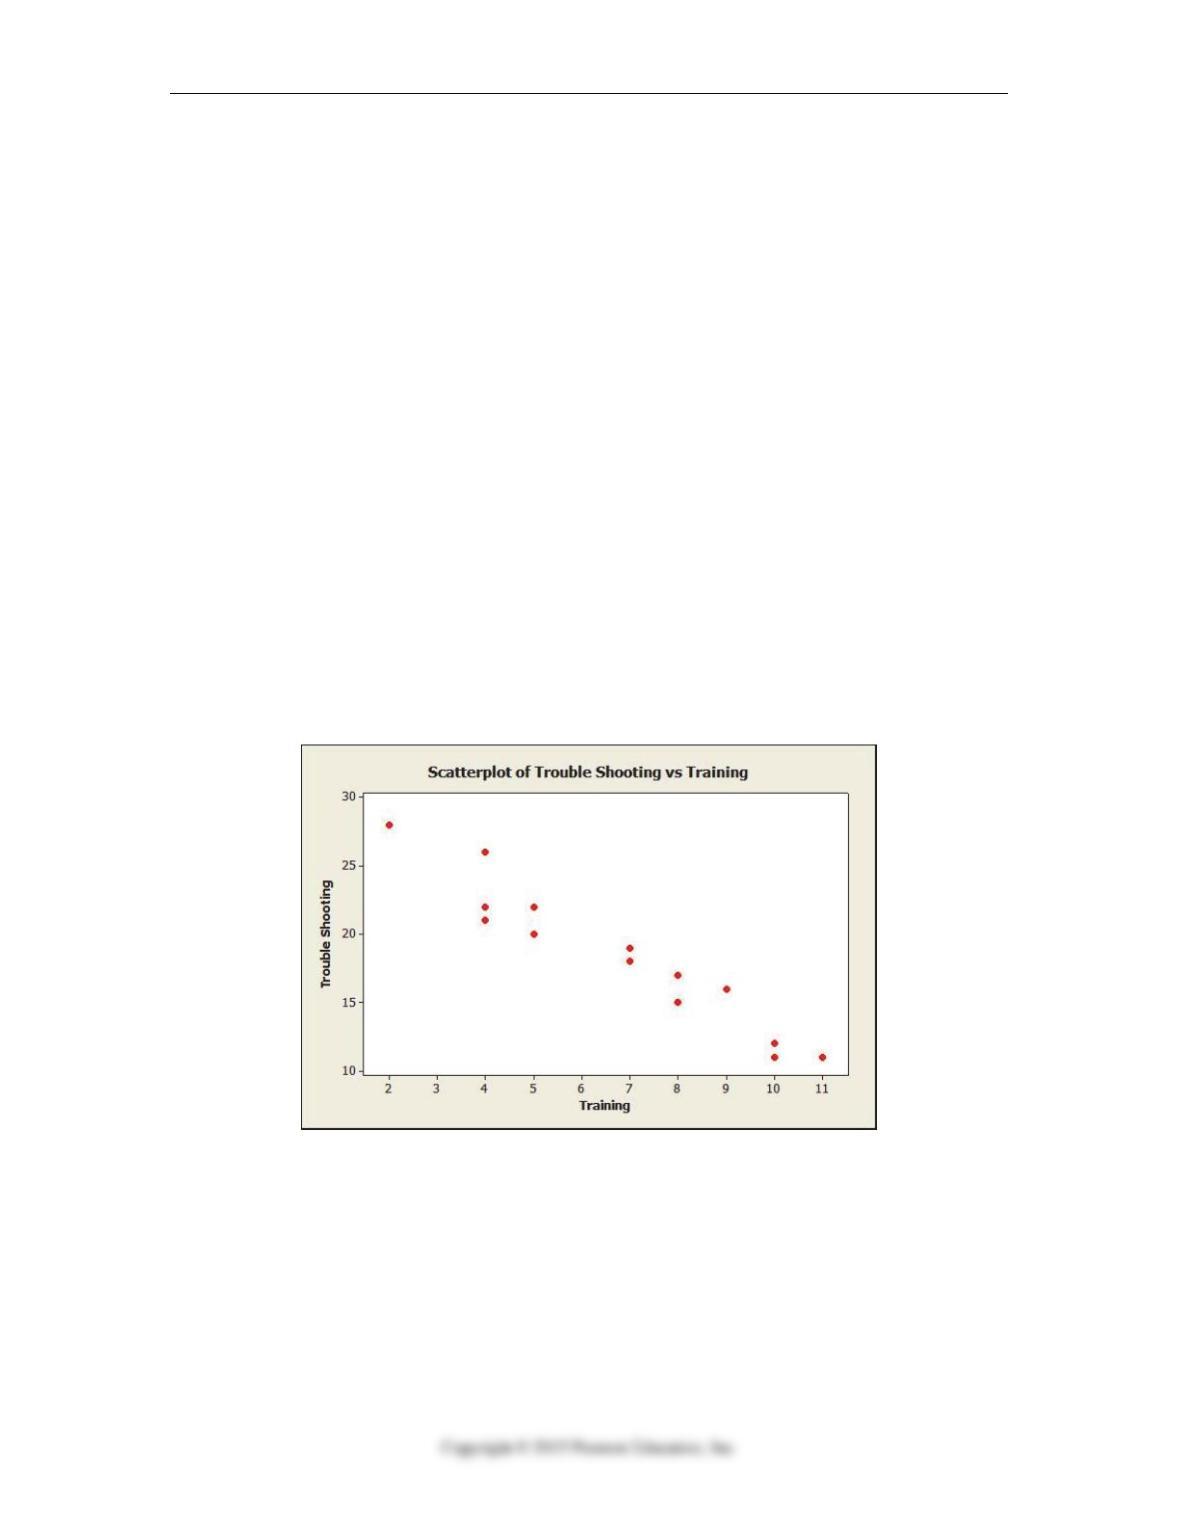
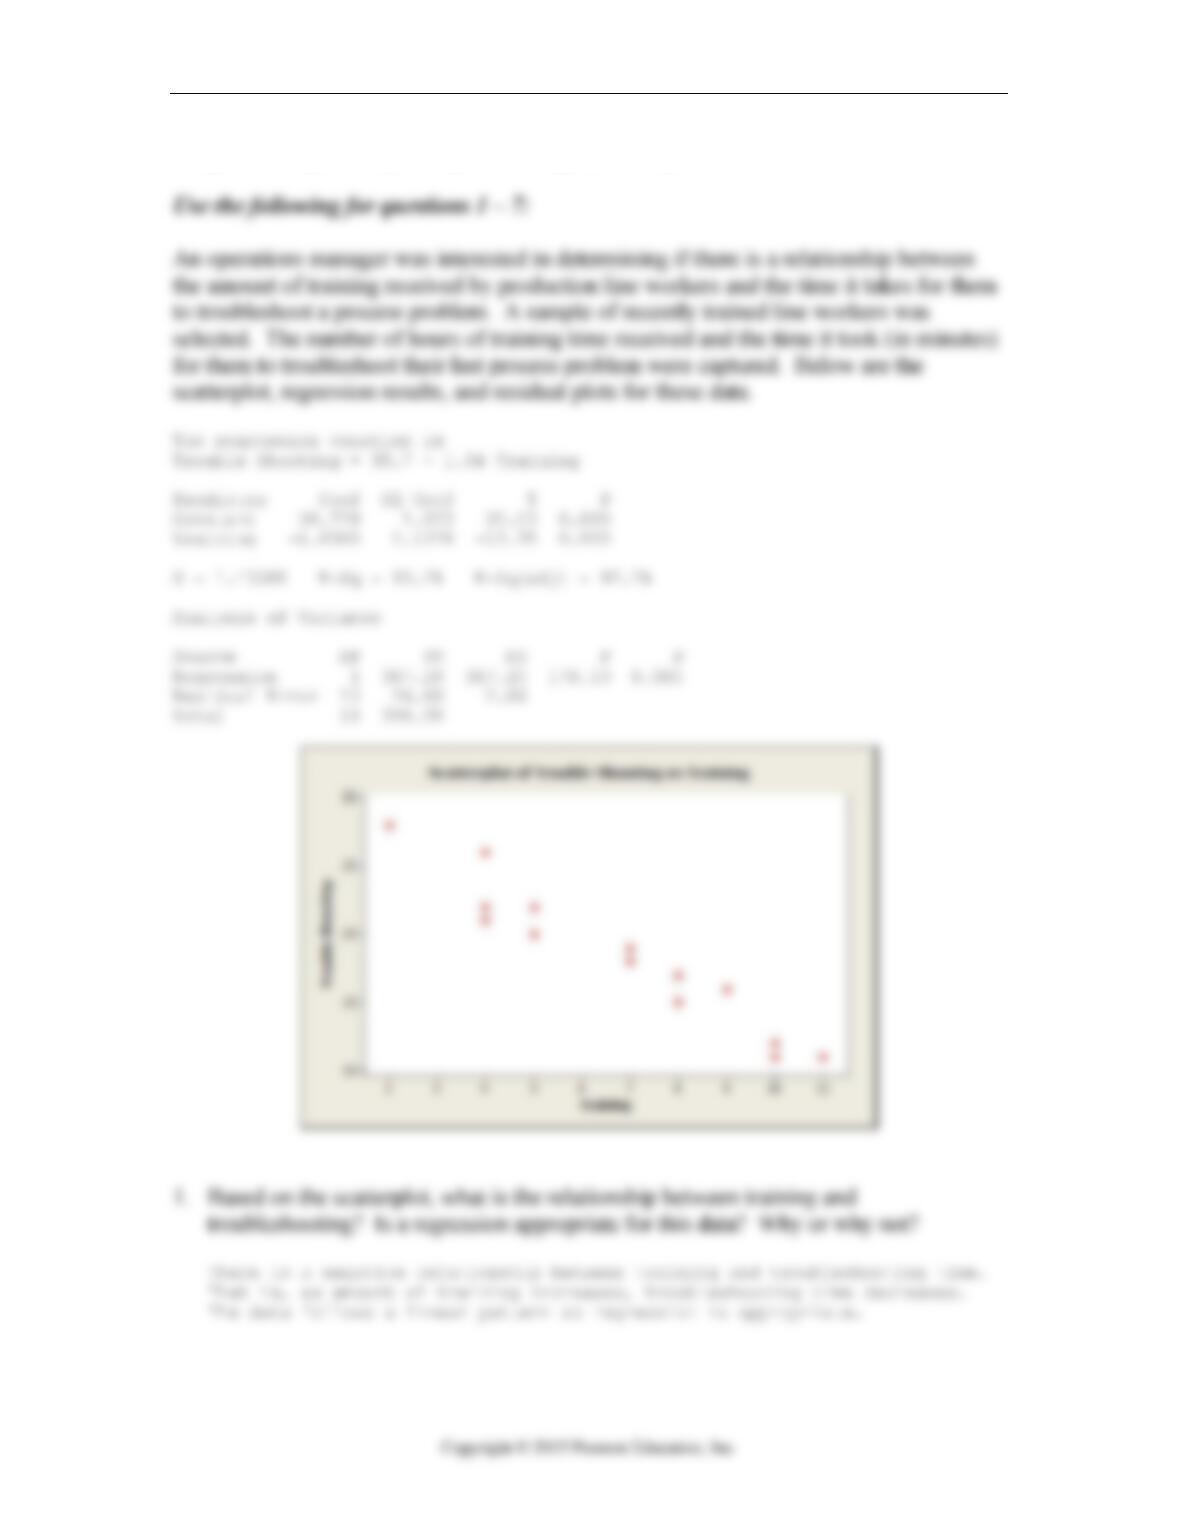
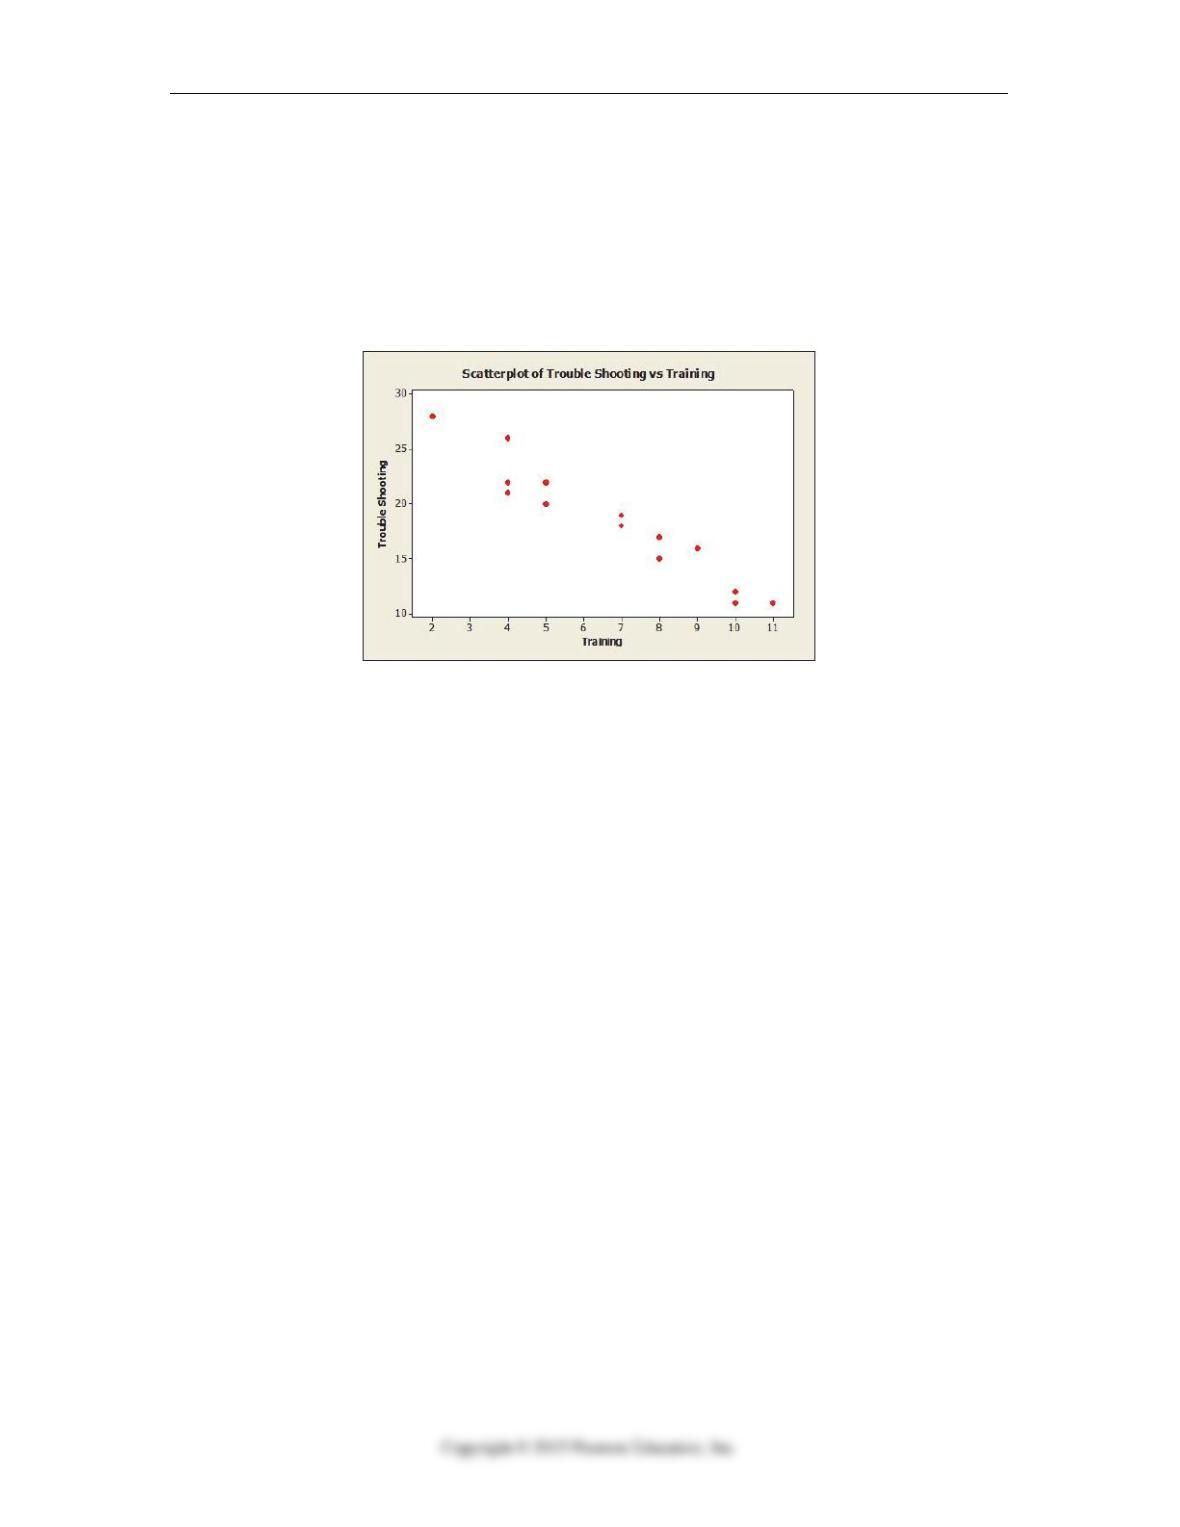
An operations manager was interested in determining if there is a relationship between
the amount of training received by production line workers and the time it takes for them
to troubleshoot a process problem. A sample of recently trained line workers was
selected. The number of hours of training time received and the time it took (in minutes)
for them to troubleshoot their last process problem were captured. Below are the
scatterplot, regression results, and residual plots for these data.
The regression equation is
Trouble Shooting = 30.7 – 1.84 Training
Predictor Coef SE Coef T P
Constant 30.729 1.023 30.03 0.000
Training -1.8360 0.1376 -13.35 0.000
S = 1.43588 R-Sq = 93.2% R-Sq(adj) = 92.7%
Analysis of Variance
Source DF SS MS F P
Regression 1 367.20 367.20 178.10 0.000
Residual Error 13 26.80 2.06
Total 14 394.00
15.2.3 Check the assumptions and conditions for regression inference.
1. Based on the scatterplot, what is the relationship between training and
troubleshooting? Is a regression appropriate for this data? Why or why not?
Quiz B 15-9
15.1.5 Interpret technology outputs.
2. From the output, write the equation of the regression equation that can be used to
predict troubleshooting time.
15.1.2 Conduct inference on the slope of a regression equation.
3. Is there a significant relationship between time it takes to troubleshoot the process
(minutes) and training received (use α = .05)? Give the appropriate test statistic,
associated P-value, and conclusion.
15.1.5 Interpret technology outputs.
4. Write a sentence to interpret the coefficient of training in the regression equation.
15.1.1 Use regression equations to make predictions and calculate residuals and standard
errors.
5. Predict the troubleshooting time for a line worker who received 8 hours of training.
15.4.4 Create, interpret, and apply confidence and prediction intervals.
6. The 95% confidence interval for troubleshooting time with 8 hours of training is
(15.180, 16.903). Interpret this interval with respect to the estimated troubleshooting
time.
15.1.1 Use regression equations to make predictions and calculate residuals and standard
errors.
7. According to the data, a worker who received 8 hours of training had a
troubleshooting time of 15 minutes. What is the value of the residual for this worker?
Explain what the residual means.
15.1.3 Check the assumptions and conditions for regression inference.
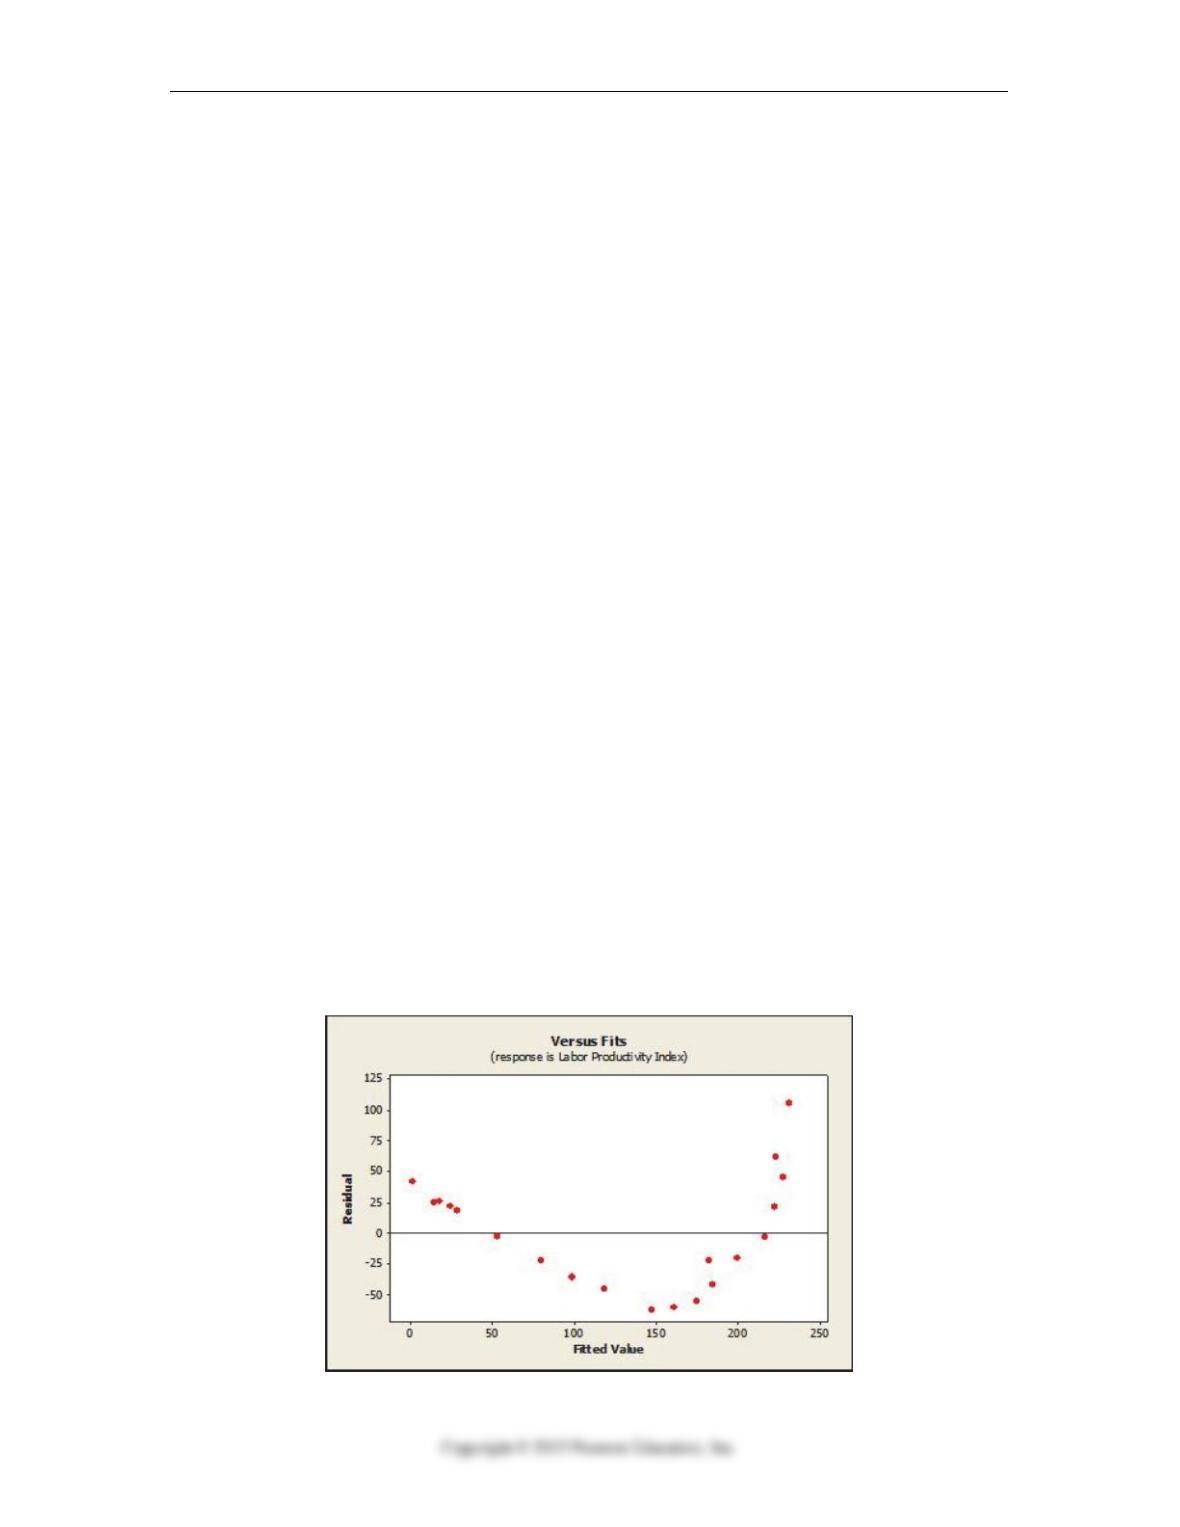
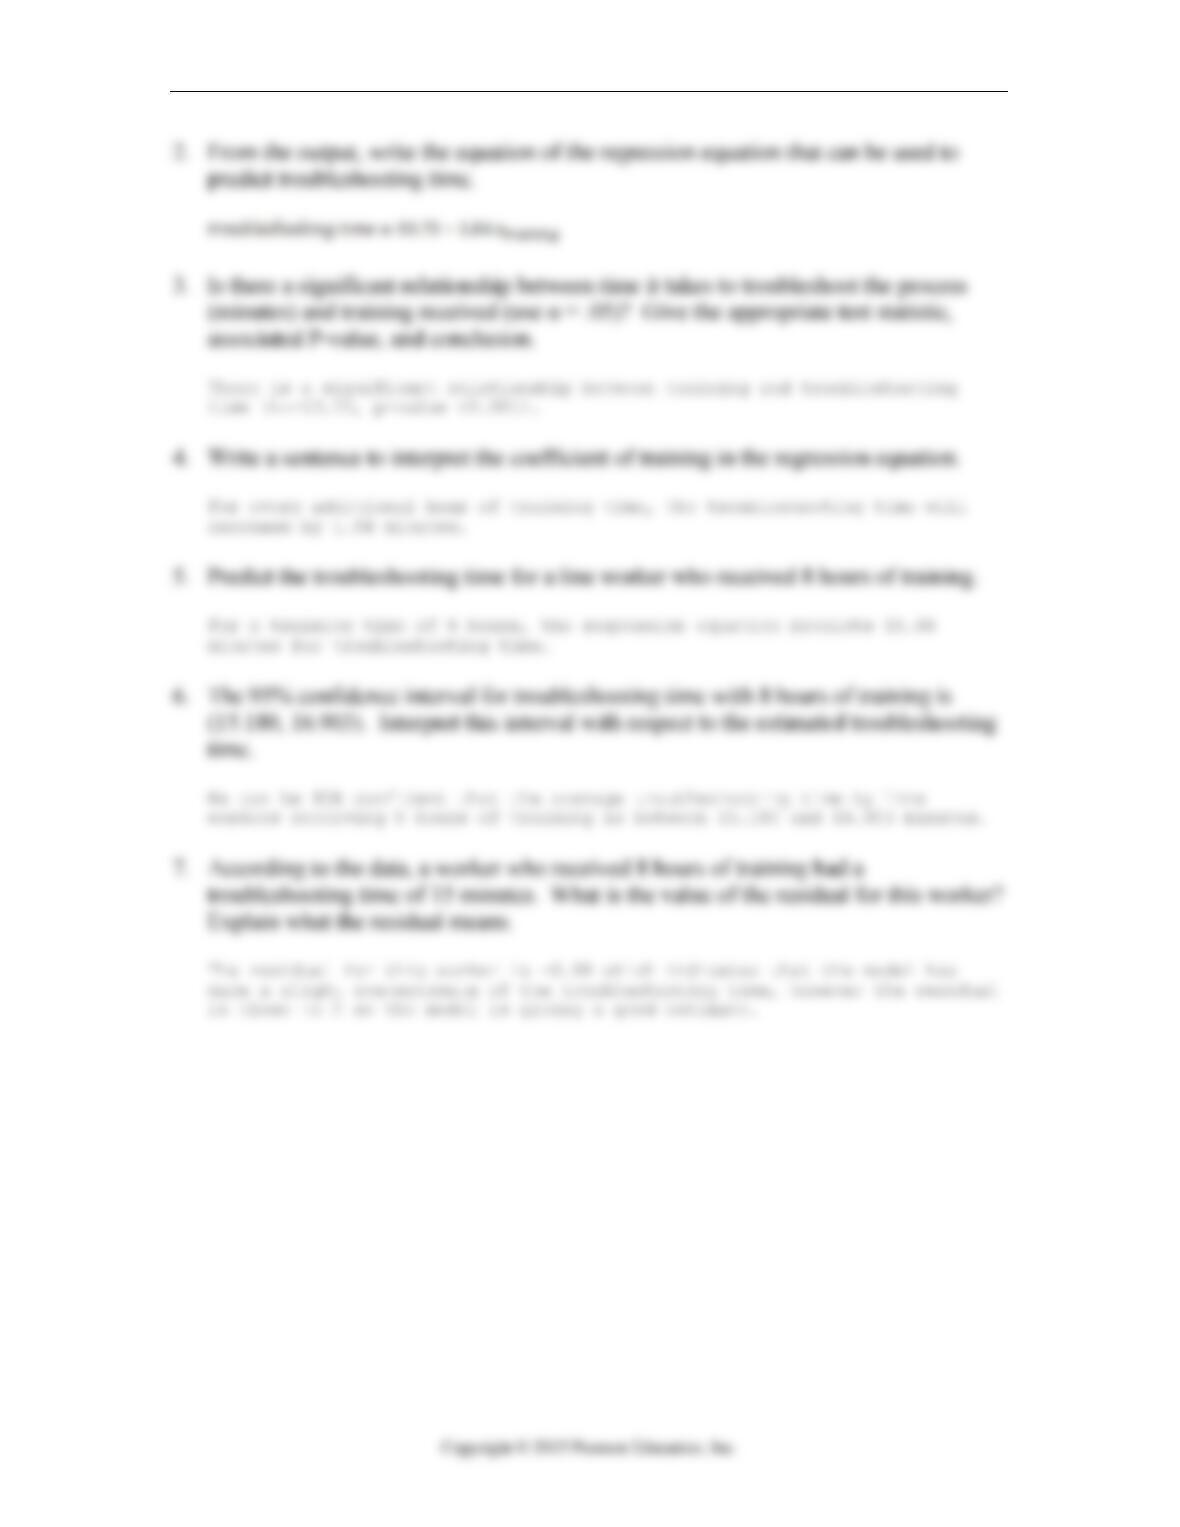
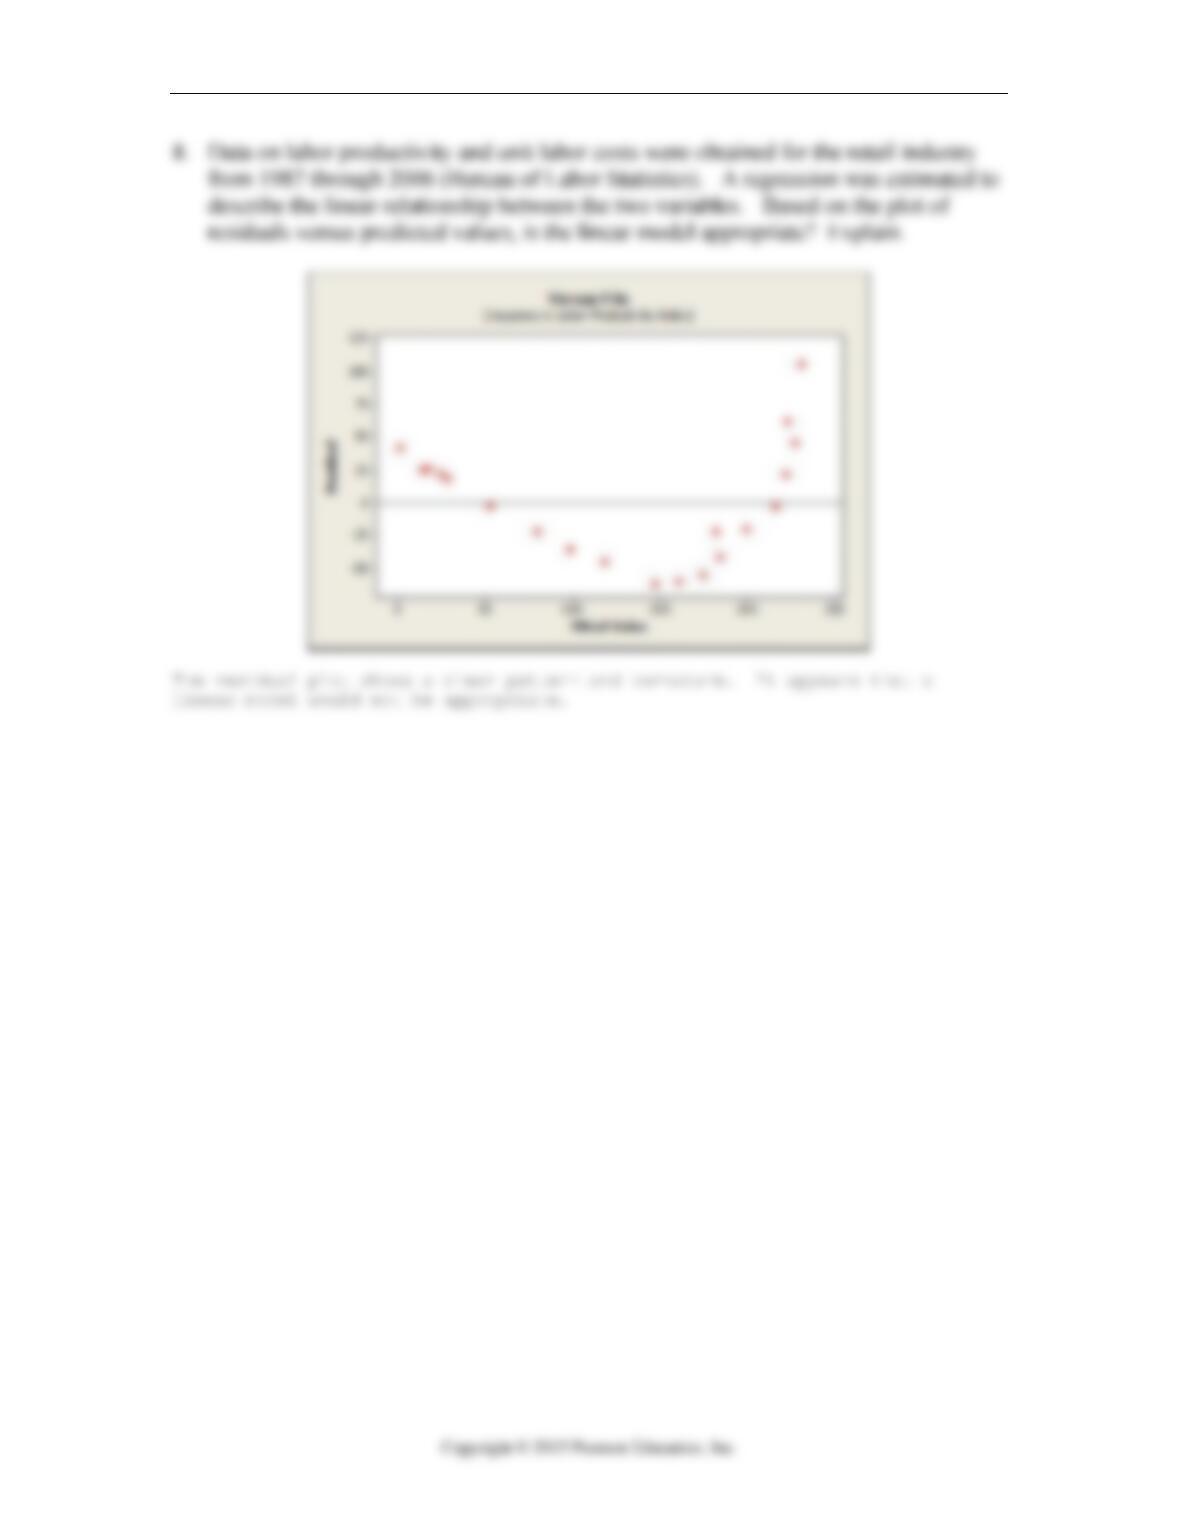
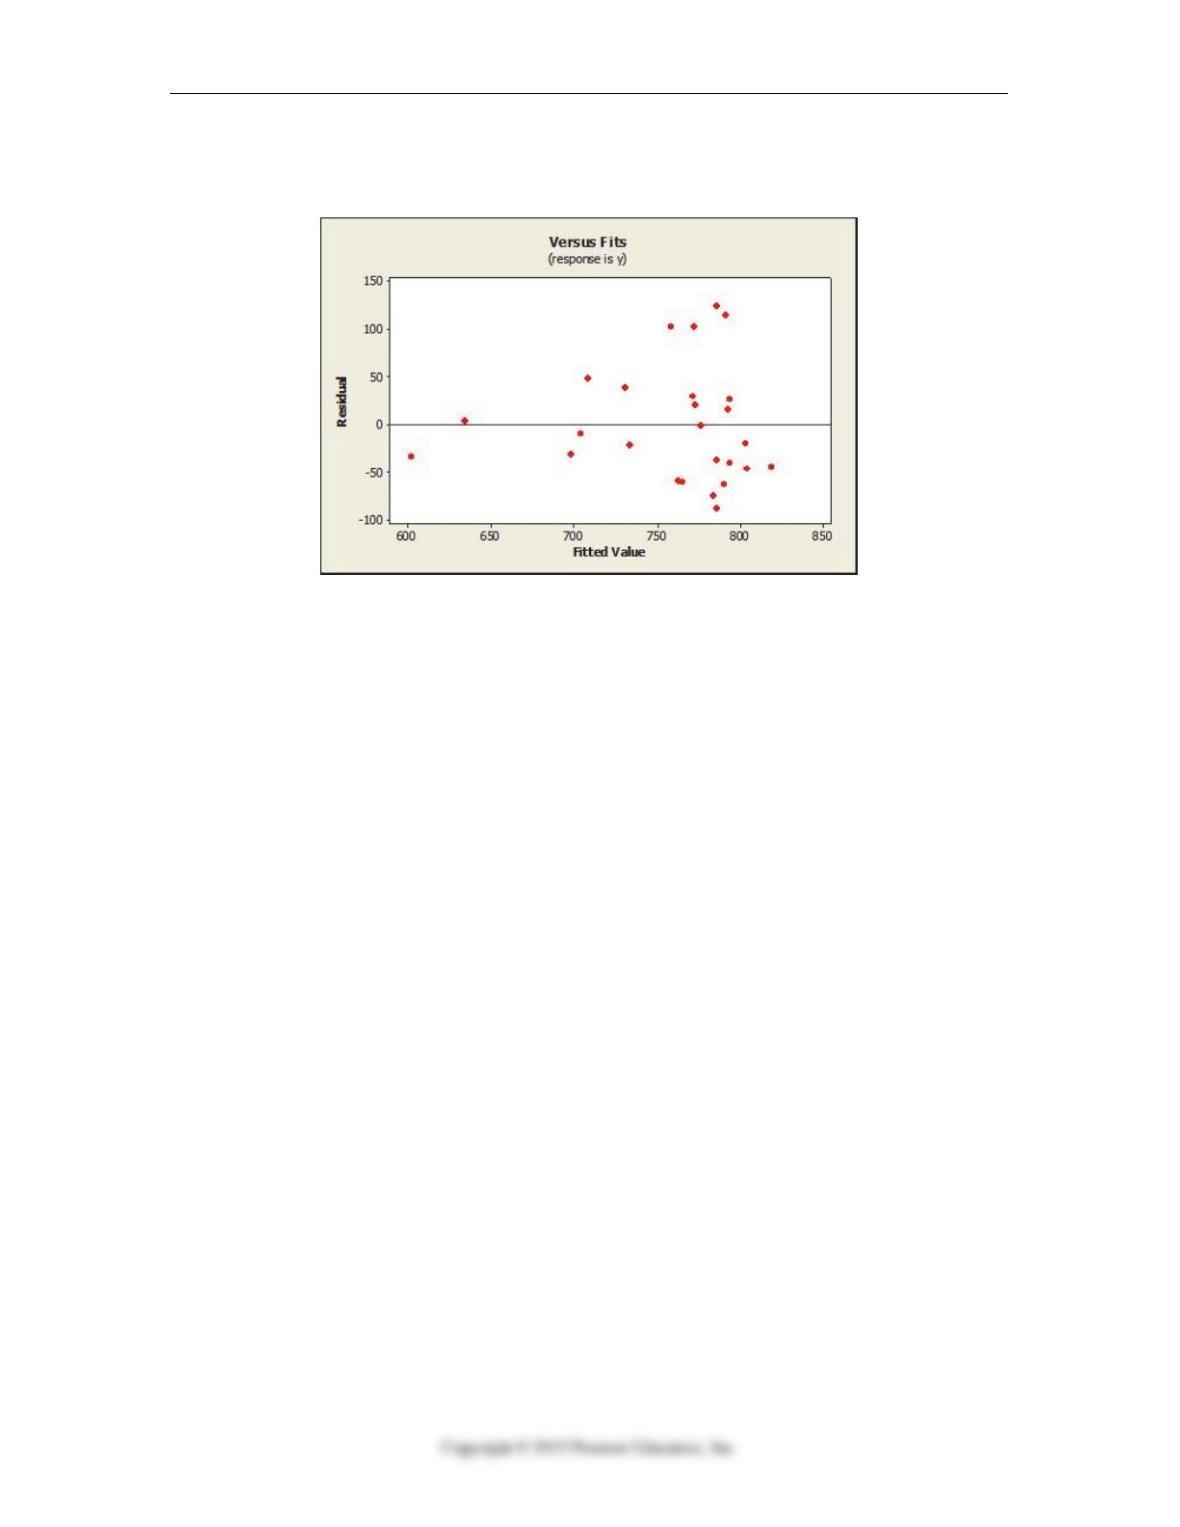
8. Data on labor productivity and unit labor costs were obtained for the retail industry
from 1987 through 2006 (Bureau of Labor Statistics). A regression was estimated to
describe the linear relationship between the two variables. Based on the plot of
residuals versus predicted values, is the linear model appropriate? Explain.
15-10 Chapter 15 Inference for Regression
Chapter 15: Inference for Regression – Quiz B – Key
Quiz B 15-11
15-12
Chapter 15 Inference for Regression

Quiz C 15-13
Chapter 15: Inference for Regression Name:__________________
Quiz C – Multiple Choice
15.1.2 Conduct inference on the slope of a regression equation.
1. A sales manager was interested in determining if there is a relationship between
college GPA and sales performance (number of units sold) among salespeople hired
within the last year. The correct null hypothesis is
A. There is no relationship between GPA and sales performance.
B. There is a relationship between GPA and sales performance.
C. β1 = 0
D. Both A and C.
E. None of these
15.1.5 Interpret technology outputs.
2. A sales manager claims that there is a relationship between college GPA and sales
performance (number of units sold) among salespeople hired within the last year.
Use the regression results are shown below and set α = .05 to test his claim.
Predictor Coef SE Coef T P
Constant -0.484 3.256 -0.15 0.884
GPA 7.423 1.044 7.11 0.000
A. reject the null hypothesis and conclude that there is no significant relationship
between GPA and sales performance
B. fail to reject the null hypothesis and conclude that there is no significant
relationship between GPA and sales performance
C. reject the null hypothesis and conclude that there is a significant relationship
between GPA and sales performance
D. fail to reject the null hypothesis and conclude that there is a significant
relationship between GPA and sales performance
E. None of these
15.1.5 Interpret technology outputs.
3. A sales manager was interested in determining if there is a relationship between
college GPA and sales performance (number of units sold) among salespeople hired
within the last year. From the regression results shown below, identify the residual
standard deviation.
Predictor Coef SE Coef T P
Constant -0.484 3.256 -0.15 0.884
GPA 7.423 1.044 7.11 0.000
S = 1.57429 R-Sq = 78.3% R-Sq(adj) = 76.8%
A. 3.256.
B. 1.044.
C. 1.574.
D. 34.70.
E. None of the above.

15-14 Chapter 15 Inference for Regression
15.3.1 Interpret technology outputs.
4. Which of the following does NOT affect the standard error of the regression slope?
A. Spread around the line: se
B. Spread of x values: sx
C. Sample size: n
D. Critical value: t*
E. All of these affect the standard error.
15.4.4 Create, interpret, and apply confidence and prediction intervals.
5. The number of hours of training time received by employees and the time it took (in
minutes) for them to trouble shoot their last process problem was estimated using a
regression equation. The 95% prediction interval for trouble shooting time with 8
hours of training was determined to be 12.822 to 19.261. The correct interpretation is
A. We can be 95% confident that the trouble shooting time by a particular line
worker who received 8 hours of training will be between 12.822 and 19.261
minutes.
B. We can be 95% confident that the average trouble shooting time by line workers
receiving 8 hours of training is between 12.822 and 19.261 minutes.
C. The troubleshooting time by a line worker who received 8 hours of training will
be between 12.822 and 19.261 minutes 95% of the time.
D. 95% of the time the average troubleshooting time is between 12.822 and 19.261
minutes.
E. We can be 95% confident that troubleshooting times will be between 12.822 and
19.261 minutes.
Quiz C 15-15
15.2.3 Check the assumptions and conditions for regression inference.
6. According to the plot of residuals versus fitted values below, which of the following
is true?
A. equal spread condition is satisfied
B. equal spread condition is not satisfied
C. nearly normal condition is not satisfied
D. linearity condition is not satisfied
E. quantitative variables condition is not satisfied
15.1.2 Conduct inference on the slope of a regression equation.
7. As the carbon content in steel increases, its ductility tends to decrease. A researcher
at a steel company measures carbon content and ductility for a sample of 15 types of
steel. Use the following regression results to find the 95% confidence interval for the
slope of the regression equation.
Predictor Coef SE Coef T P
Constant 7.671 1.507 5.09 0.000
Carbon Content -3.296 1.097 -3.01 0.010
A. -5.456 to -1.136
B. -4.393 to -2.199
C. 6.164 to 9.178
D. -5.666 to -0.926
E. 2.581 to 12.761
15-16
Chapter 15 Inference for Regression
15.1.2 Conduct inference on the slope of a regression equation.
8. A researcher gathers data on the length of essays (number of lines) and the SAT
scores received for a sample of students enrolled at his university. Based on his
regression results, the 95% confidence interval for the slope of the regression
equation is -0.88 to 1.34. At α = 0.05, we can say
A. There is a statistically significant association between length of essays and SAT
score.
B. The correlation between length of essays and SAT score is significant.
C. The slope of the regression equation is significantly different from zero.
D. The slope of the regression equation is not significantly different from zero.
E. The relationship between length of essays and SAT scores is significant and
negative.
15.1.1 Use regression equations to make predictions and calculate residuals and standard
errors.
9. Cars from an online service were examined to see how fuel efficiency (highway mpg)
relates to cost (in dollars). According to the regression equation, a used car that costs
$13,000 is predicted to get about 30.24 miles per gallon. According to the data, the
car got 35 miles per gallon. What is the value of the residual for this car?
A. -4.76
B. +1.16
C. +4.76
D. +65.24
15.1.1 Use regression equations to make predictions and calculate residuals and standard
errors.
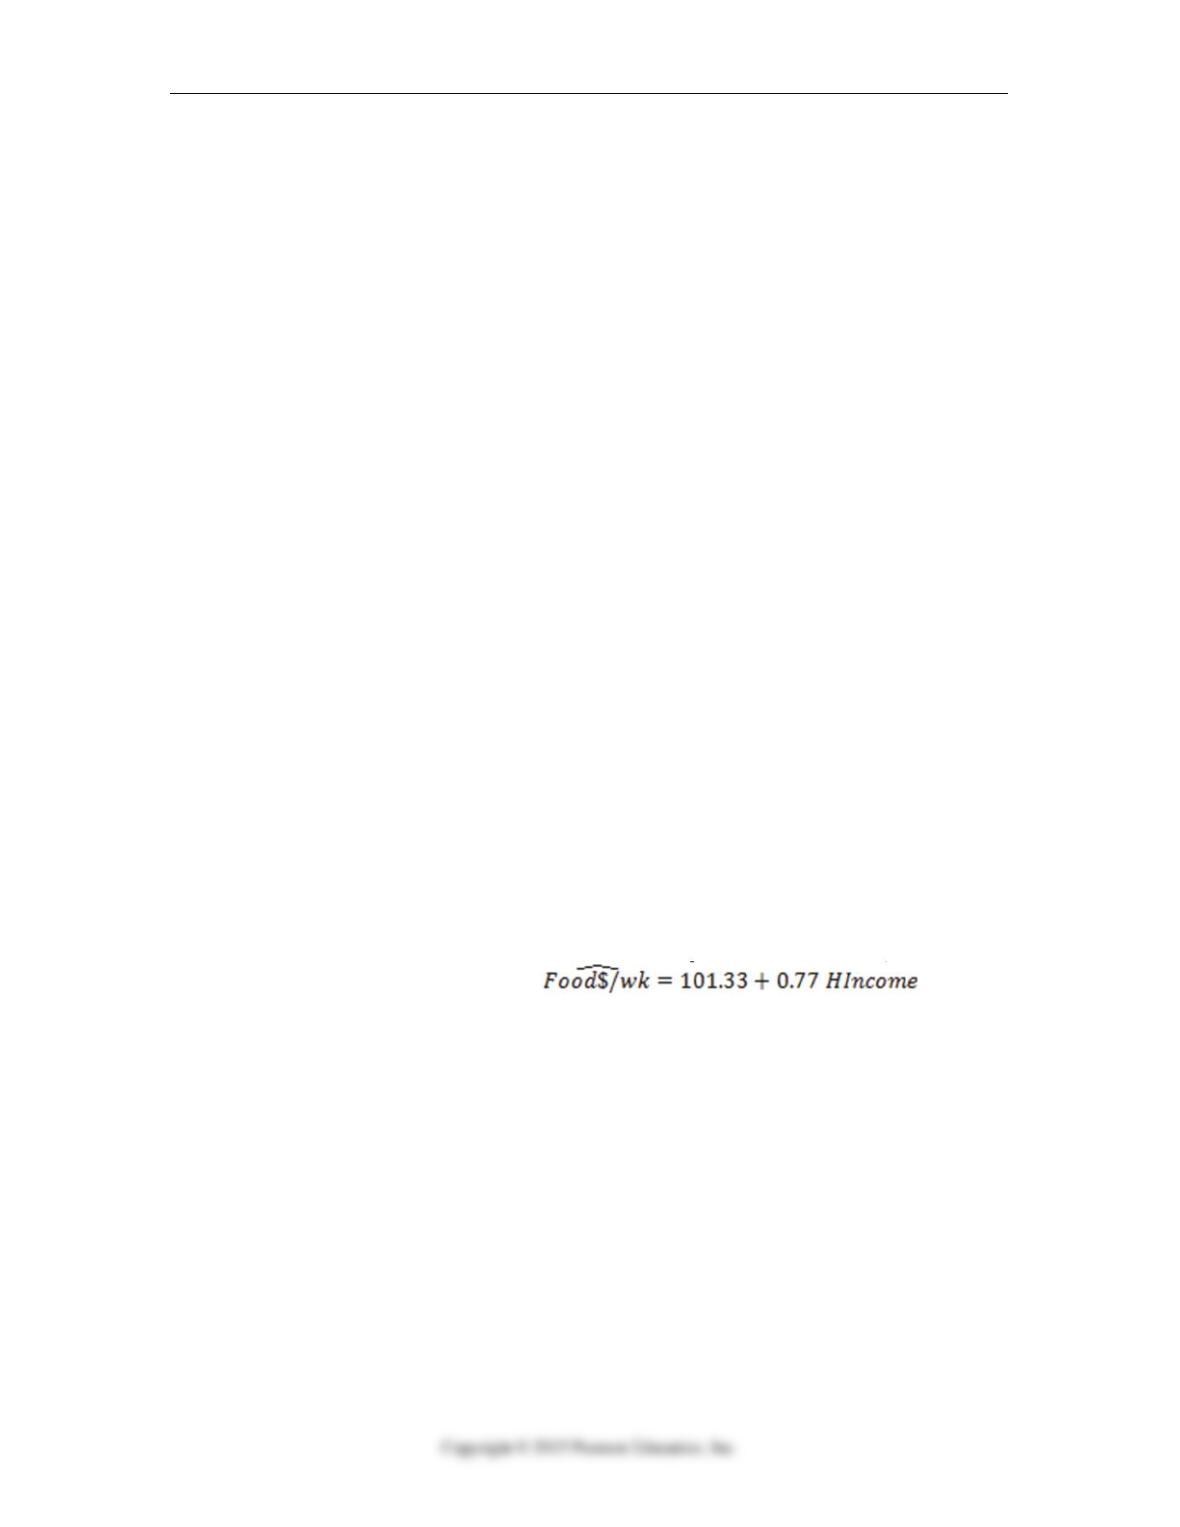
10. A researcher is interested in developing a model that can be used to distribute
assistance to low income families for food costs. She used data from a national social
survey to predict weekly amount spent on food using household income (in $1000).
The resulting regression equation is . How
much money would be needed to feed a family for a week whose household income
is $12,000?
A. $9341.33
B. $871.33
C. $193.73
D. $110.57
Quiz C 15-17
Chapter 15: Inference for Regression – Quiz C – Key
15-18 Chapter 15 Inference for Regression
Chapter 15: Inference for Regression Name:__________________
Quiz D – Multiple Choice
15.1.3 Check the assumptions and conditions for regression inference.
1. Based on the scatterplot of data of the number of hours of training time received by
production line workers and the time it took (in minutes) for them to trouble shoot
their last process problem shown, we can say that
A. The slope of the regression line fit to these data will be positive.
B. The slope of the regression line fit to these data will be negative.
C. The linearity assumption is not satisfied.
D. The intercept of the regression line fit to these data will be negative.
E. The equal variance assumption is not satisfied.
15.1.2 Conduct inference on the slope of a regression equation.
2. A sample of 15 recently trained line workers was selected to determine if there is a
relationship between the number of hours of training time received by production line
workers and the time it took (in minutes) for them to trouble shoot their last process
problem were captured. Use the regression output for the independent variable
shown below to find the 95% confidence interval for the slope of the regression
equation.
Training -1.8360 0.1376 -13.35 0.000
A. -4 to 0.32
B. -1.9776 to -1.7224
C. -2.1332 to -1.5388
D. -3.611 to -0.069
E. Can’t be determined with the information given.

Quiz D 15-19
15.1.5 Interpret technology outputs.
3. A sample of recently trained line workers was selected to determine if there is a
relationship between the number of hours of training time received by production line
workers and the time it took (in minutes) for them to trouble shoot their last process
problem were captured. Using the regression output is shown below, what conclusion
should be made at α = .05?
The regression equation is
Trouble Shooting = 30.7 – 1.84 Training
Predictor Coef SE Coef T P
Constant 30.729 1.023 30.03 0.000
Training -1.8360 0.1376 -13.35 0.000
S = 1.43588 R-Sq = 93.2% R-Sq(adj) = 92.7%
A. reject the null hypothesis, there is a significant relationship between amount of
training received and troubleshooting time
B. do not reject the null hypothesis, , there is a significant relationship between
amount of training received and troubleshooting time
C. reject the null hypothesis, there is no significant relationship between amount of
training received and troubleshooting time
D. do not reject the null hypothesis, there is no significant relationship between
amount of training received and troubleshooting time
E. None of these.
15.2.3 Check the assumptions and conditions for regression inference.
4. When using a plot of residuals (y-axis) vs. fitted value of the dependent variable, a
plot with no pattern indicates that the:
A. nearly normal condition is satisfied
B. nearly normal condition is not satisfied
C. equal spread condition is satisfied
D. linearity condition is not satisfied
E. independence condition is not satisfied
15-20 Chapter 15 Inference for Regression
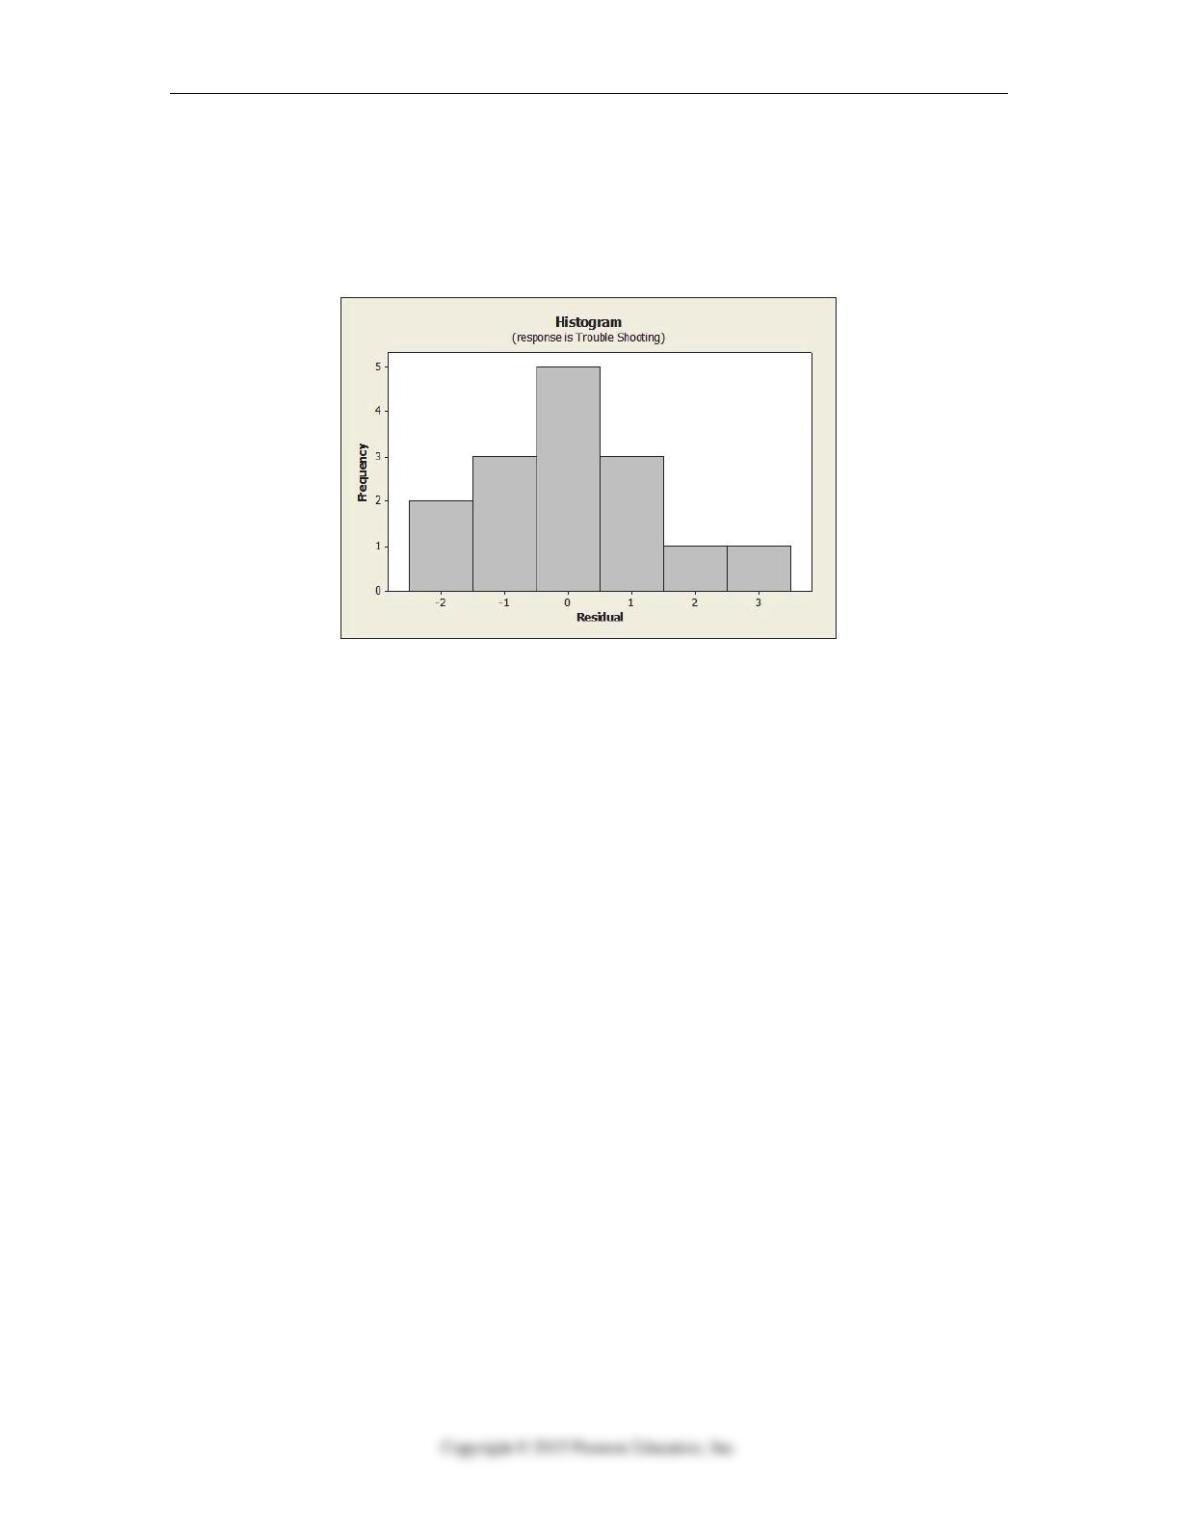
15.2.3 Check the assumptions and conditions for regression inference.
5. A regression equation was fit to the data showing the number of hours of training
time received by production line workers and the time it took (in minutes) for them to
trouble shoot their last process problem and the following histogram of residuals
obtained. Based on this histogram of the residuals, we can say that the:
A. nearly normal condition is satisfied.
B. nearly normal condition is not satisfied.
C. equal spread condition is satisfied.
D. linearity condition is not satisfied.
E. independence condition is not satisfied.
15.4.4 Create, interpret, and apply confidence and prediction intervals.
6. In a significant regression model determining if there is a relationship between
college GPA and sales performance (number of units sold in the previous month), the
95% confidence interval for the number of units sold when GPA = 3.00 was
determined to be 20.914 to 22.657. The correct interpretation is
A. We can be 95% confident that the number of units sold per month by a particular
salesperson with a college GPA of 3.00 is between 20.914 and 22.657 units.
B. We can be 95% confident that the average number of units sold per month by
salespersons with a college GPA of 3.00 is between 20.914 and 22.657 units.
C. The number of units sold per month by a salesperson with a college GPA of 3.00
will be between 20.914 and 22.657 units 95% of the time.
D. 95% of the time the average number of units sold per month will be between
20.914 and 22.657 units.
E. We can be 95% confident that each month between 20.914 and 22.657 units will
be sold.
Quiz D 15-21
15.3.5 Interpret technology outputs.
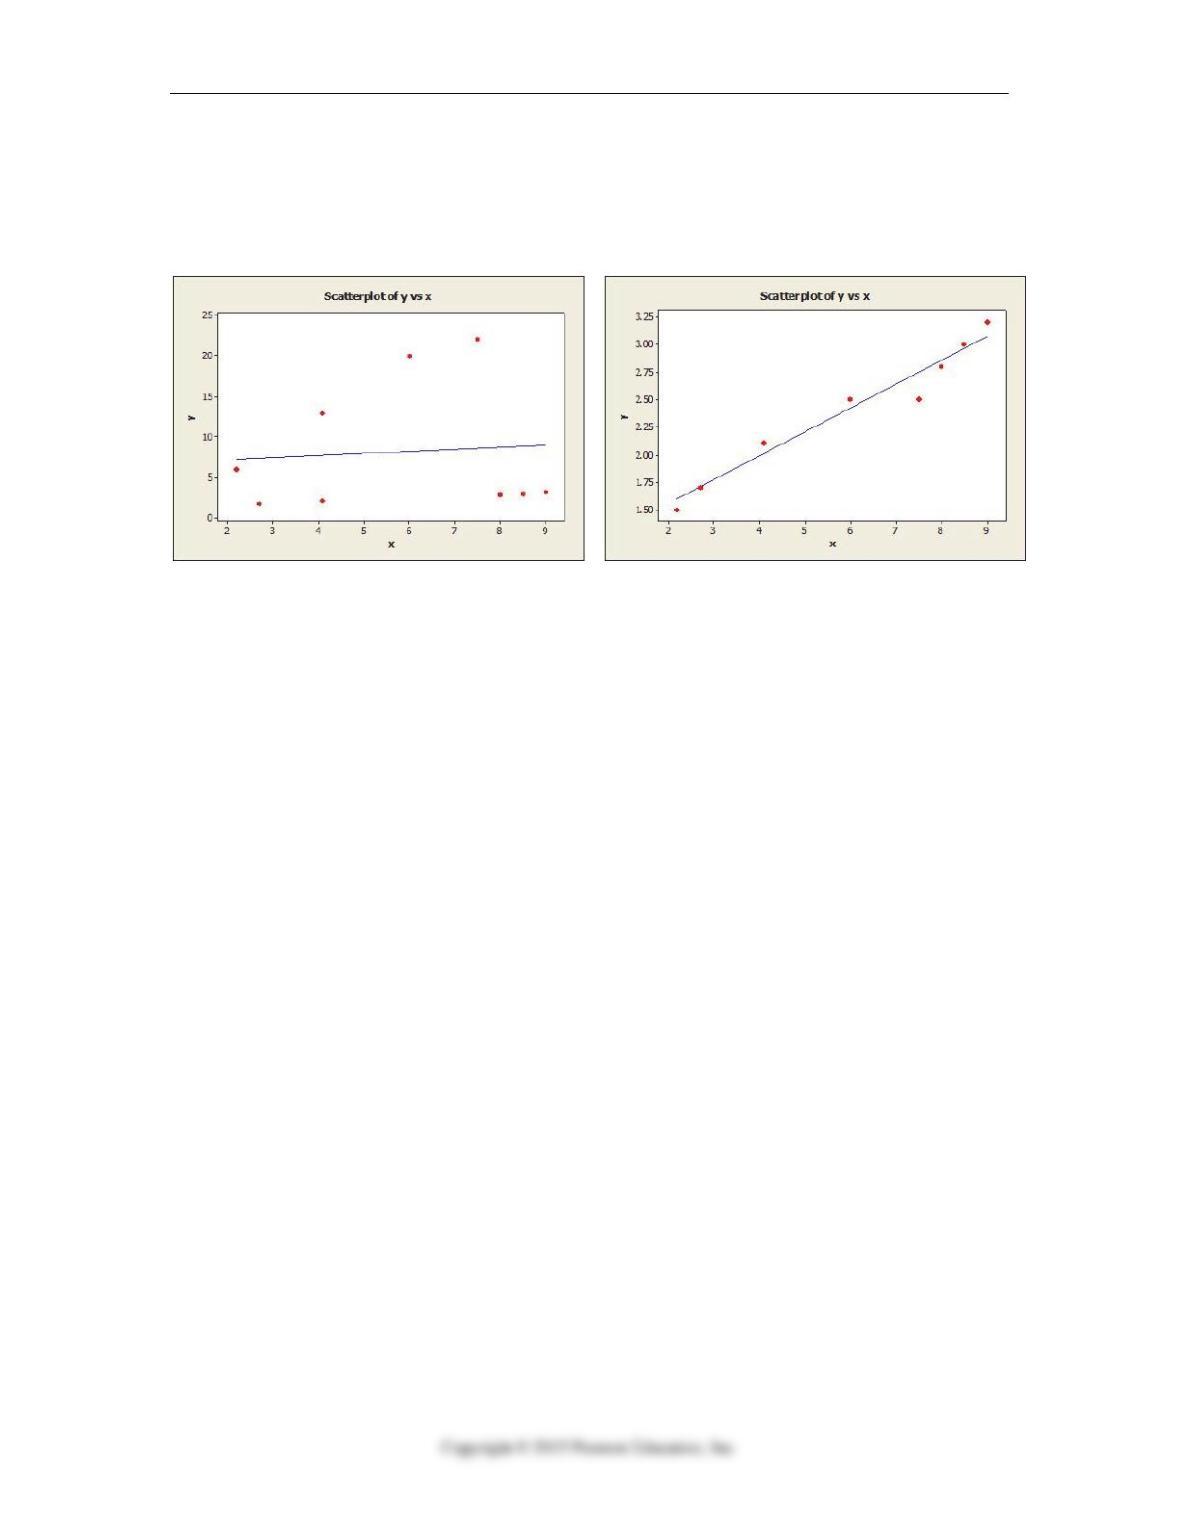
7. Consider Scatterplots 1 and 2 with fitted regression lines shown below. Which of the
following statements is true?
Scatterplot 1 Scatterplot 2
A. The standard error of the regression slope is smaller in scatterplot 1.
B. The relationship between x and y is stronger in scatterplot 1.
C. The standard error of the regression slope is smaller in scatterplot 2.
D. The estimated slope is negative in scatterplot 2.
E. The estimated intercept is negative in scatterplot 1.
15.1.5 Interpret technology outputs.
8. As the carbon content in steel increases, its ductility tends to decrease. A researcher
at a steel company measures carbon content and ductility for a sample of 15 types of
steel. According to the output provided below, the standard error of the regression
slope is
The regression equation is
Ductility = 7.67 – 3.30 Carbon Content
Predictor Coef SE Coef T P
Constant 7.671 1.507 5.09 0.000
Carbon Content -3.296 1.097 -3.01 0.010
S = 2.36317 R-Sq = 41.0% R-Sq(adj) = 36.5%
A. -3.296
B. +2.363
C. +1.097
D. +1.507
E. +5.090

15-22 Chapter 15 Inference for Regression
15.1.5 Interpret technology outputs.
9. As the carbon content in steel increases, its ductility tends to decrease. A researcher
at a steel company measures carbon content and ductility for a sample of 15 types of
steel. Based on these data he obtained the following regression results, which of the
following statements is NOT true?
The regression equation is
Ductility = 7.67 – 3.30 Carbon Content
Predictor Coef SE Coef T P
Constant 7.671 1.507 5.09 0.000
Carbon Content -3.296 1.097 -3.01 0.010
S = 2.36317 R-Sq = 41.0% R-Sq(adj) = 36.5%
A. The association between carbon content and ductility of steel is statistically
significant at α = 0.05.
B. The slope is significantly different from zero at α = 0.05.
C. The relationship between carbon content and ductility of steel is positive at α =
0.05.
D. There is 59% of the variance in ductility that is not explained by this model.
E. For one unit increase in carbon content, one can expect a 3.30 unit decrease in
ductility.
15.4.4 Create, interpret, and apply confidence and prediction intervals.
10. An estimated regression equation that was fit to estimate ductility in steel using its
carbon content was found to be significant at α = 0.05. The 95% prediction interval
for the ductility of steel with 0.5% carbon content was determined to be 0.45 to 11.59.
The correct interpretation is
A. We can be 95% confident that the ductility of a particular type of steel with 0.5%
carbon content is between 0.45 and 11.59.
B. We can be 95% confident that the average ductility of all steel with 0.5% carbon
content is between 0.45 and 11.59.
C. The ductility of steel with 0.5% carbon content will be between 45 and 11.59
most (95%) of the time.
D. 95% of the time the average ductility of steel with 0.5% carbon content will be
between 0.45 and 11.59.
E. We can be 95% confident that all steel with have ductility measurements between
0.45 and 11.59.
Quiz D 15-23
Chapter 15: Inference for Regression – Quiz D – Key