Chapter 15 – Financial Statement Analysis
175. The times interest earned for Year 2 is closest to:
176. The debt-to-equity ratio at the end of Year 2 is closest to:
Chapter 15 – Financial Statement Analysis
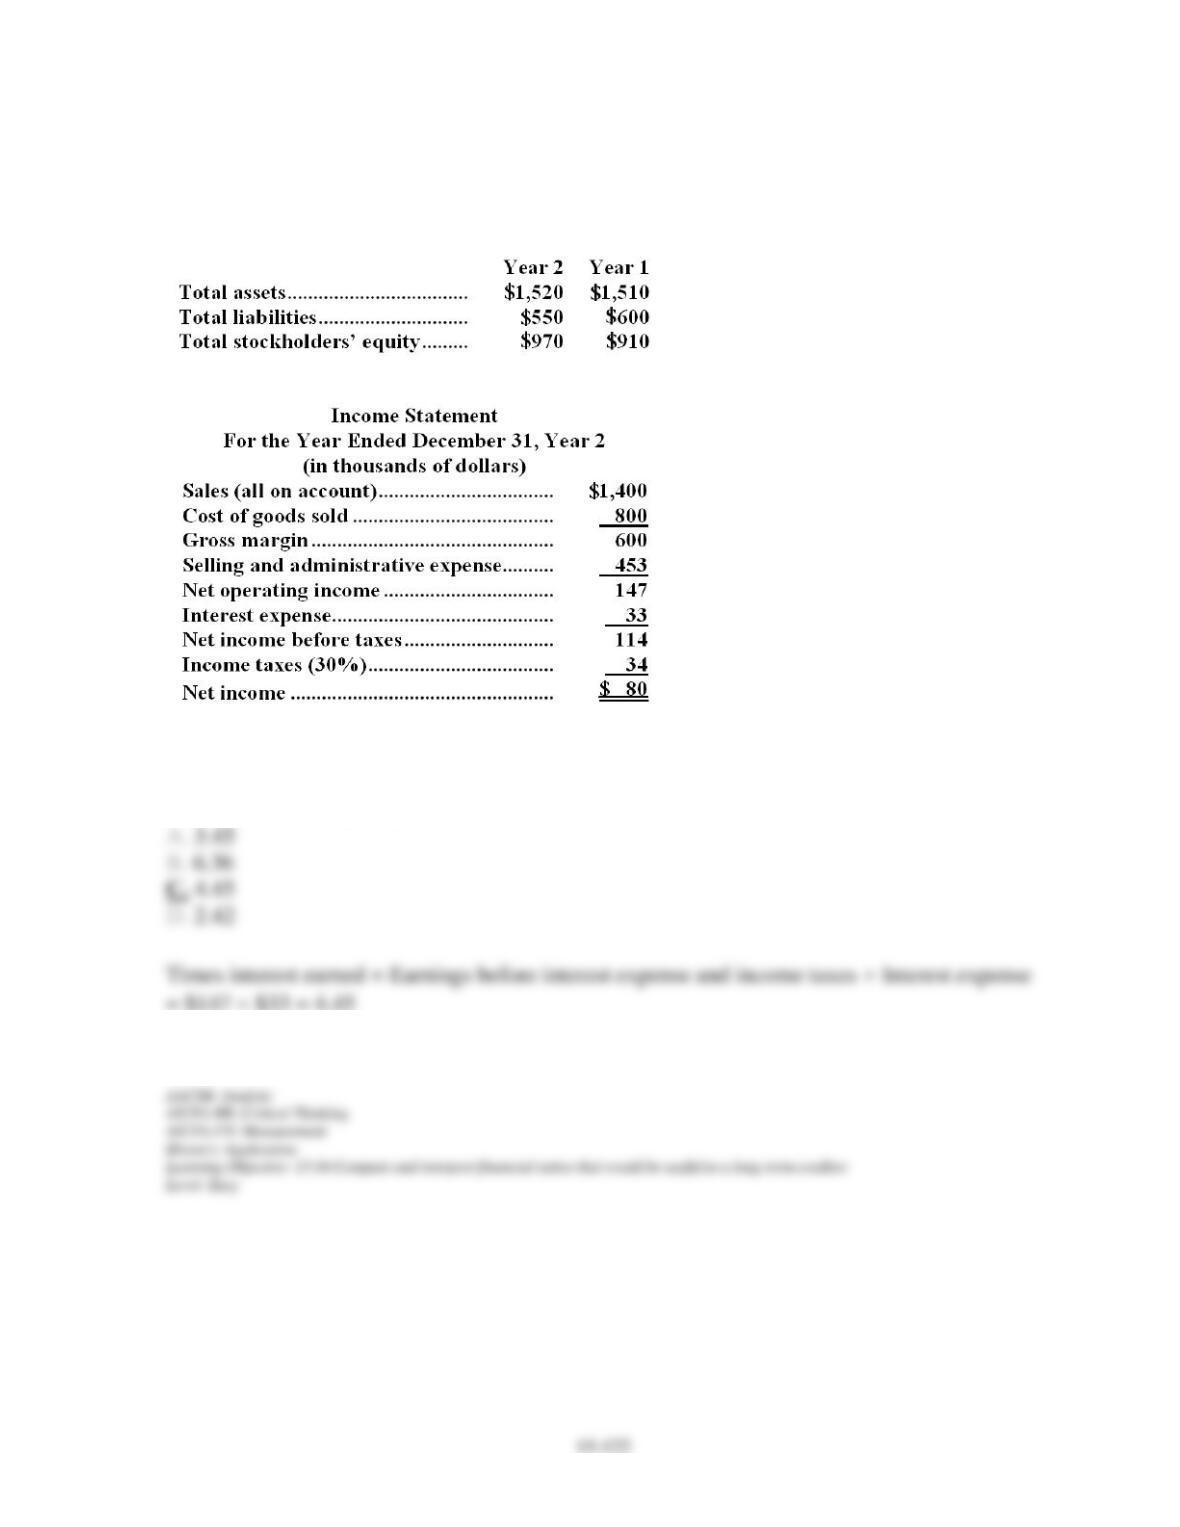
Data from Kempen Corporation’s most recent balance sheet and the company’s income
statement appear below:
177. The times interest earned for Year 2 is closest to:
Chapter 15 – Financial Statement Analysis
15-123
178. The debt-to-equity ratio at the end of Year 2 is closest to:
Essay Questions
Chapter 15 – Financial Statement Analysis
15-124
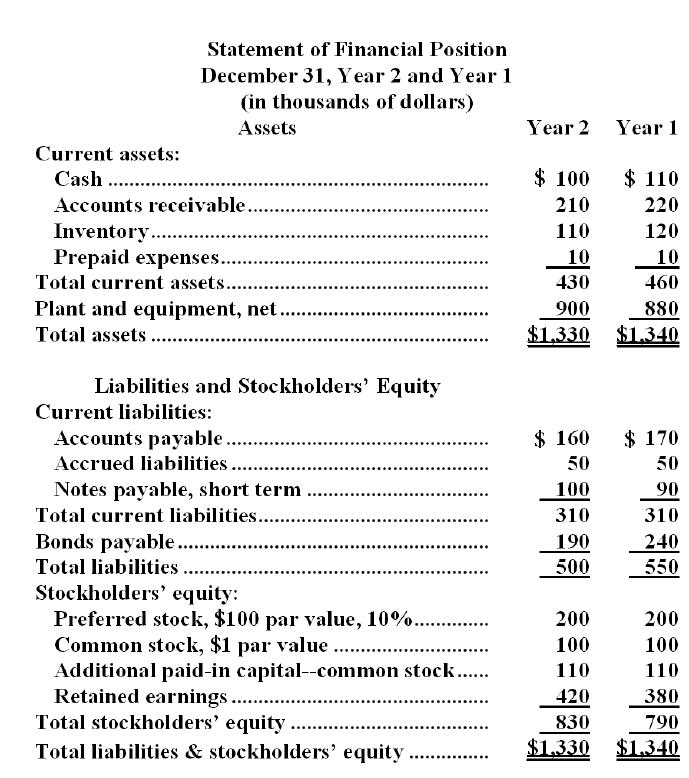
179. Lundberg Corporation’s most recent balance sheet and income statement appear below:
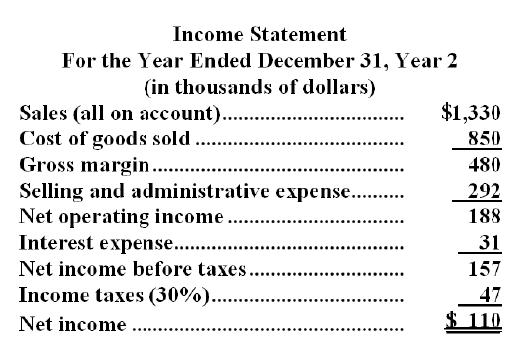
Chapter 15 – Financial Statement Analysis
15-125
Dividends on common stock during Year 2 totaled $50 thousand. Dividends on preferred
stock totaled $20 thousand. The market price of common stock at the end of Year 2 was $9.36
per share.
Required:
Compute the following for Year 2:
a. Gross margin percentage.
b. Earnings per share (of common stock).
c. Price-earnings ratio.
d. Dividend payout ratio.
e. Dividend yield ratio.
f. Return on total assets.
g. Return on common stockholders’ equity.
h. Book value per share.
i. Working capital.
j. Current ratio.
k. Acid-test ratio.
l. Accounts receivable turnover.
m. Average collection period.
n. Inventory turnover.
o. Average sale period.
p. Times interest earned.
q. Debt-to-equity ratio.
Chapter 15 – Financial Statement Analysis
15-126
Chapter 15 – Financial Statement Analysis
l. Accounts receivable turnover = Sales on account Average accounts receivable balance*
Chapter 15 – Financial Statement Analysis
15-128
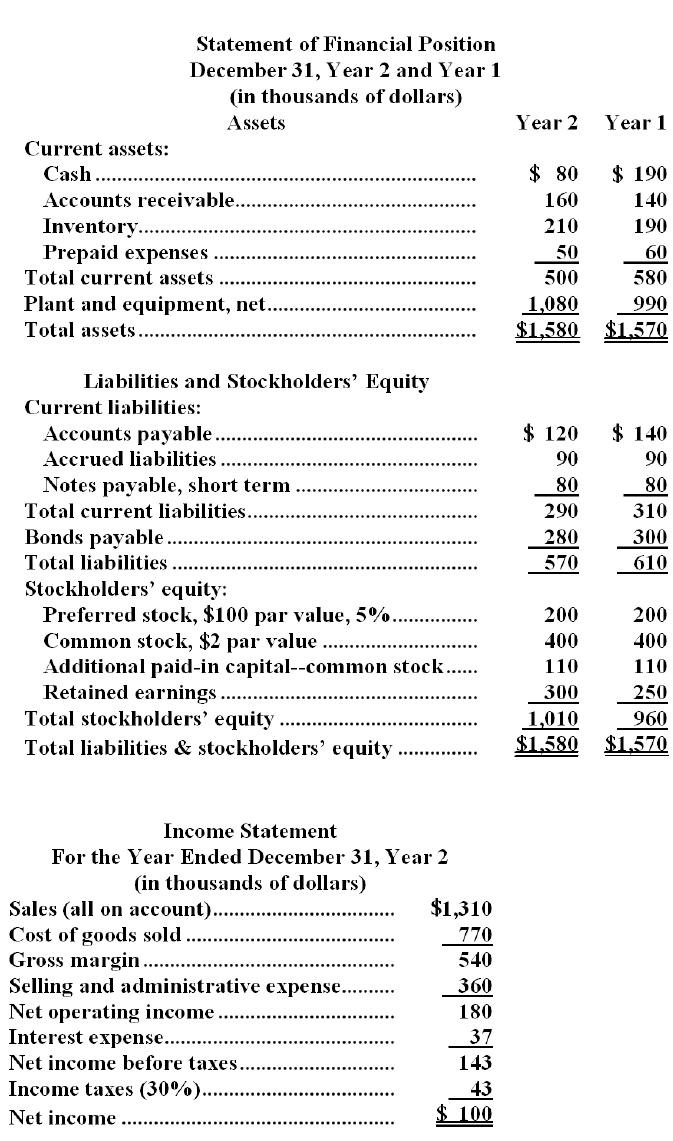
180. Guedea Corporation’s most recent balance sheet and income statement appear below:
Dividends on common stock during Year 2 totaled $40 thousand. Dividends on preferred
Chapter 15 – Financial Statement Analysis
15-129
stock totaled $10 thousand. The market price of common stock at the end of Year 2 was $5.22
per share.
Required:
Compute the following for Year 2:
a. Gross margin percentage.
b. Earnings per share (of common stock).
c. Price-earnings ratio.
d. Dividend payout ratio.
e. Dividend yield ratio.
f. Return on total assets.
g. Return on common stockholders’ equity.
h. Book value per share.
Chapter 15 – Financial Statement Analysis
Chapter 15 – Financial Statement Analysis
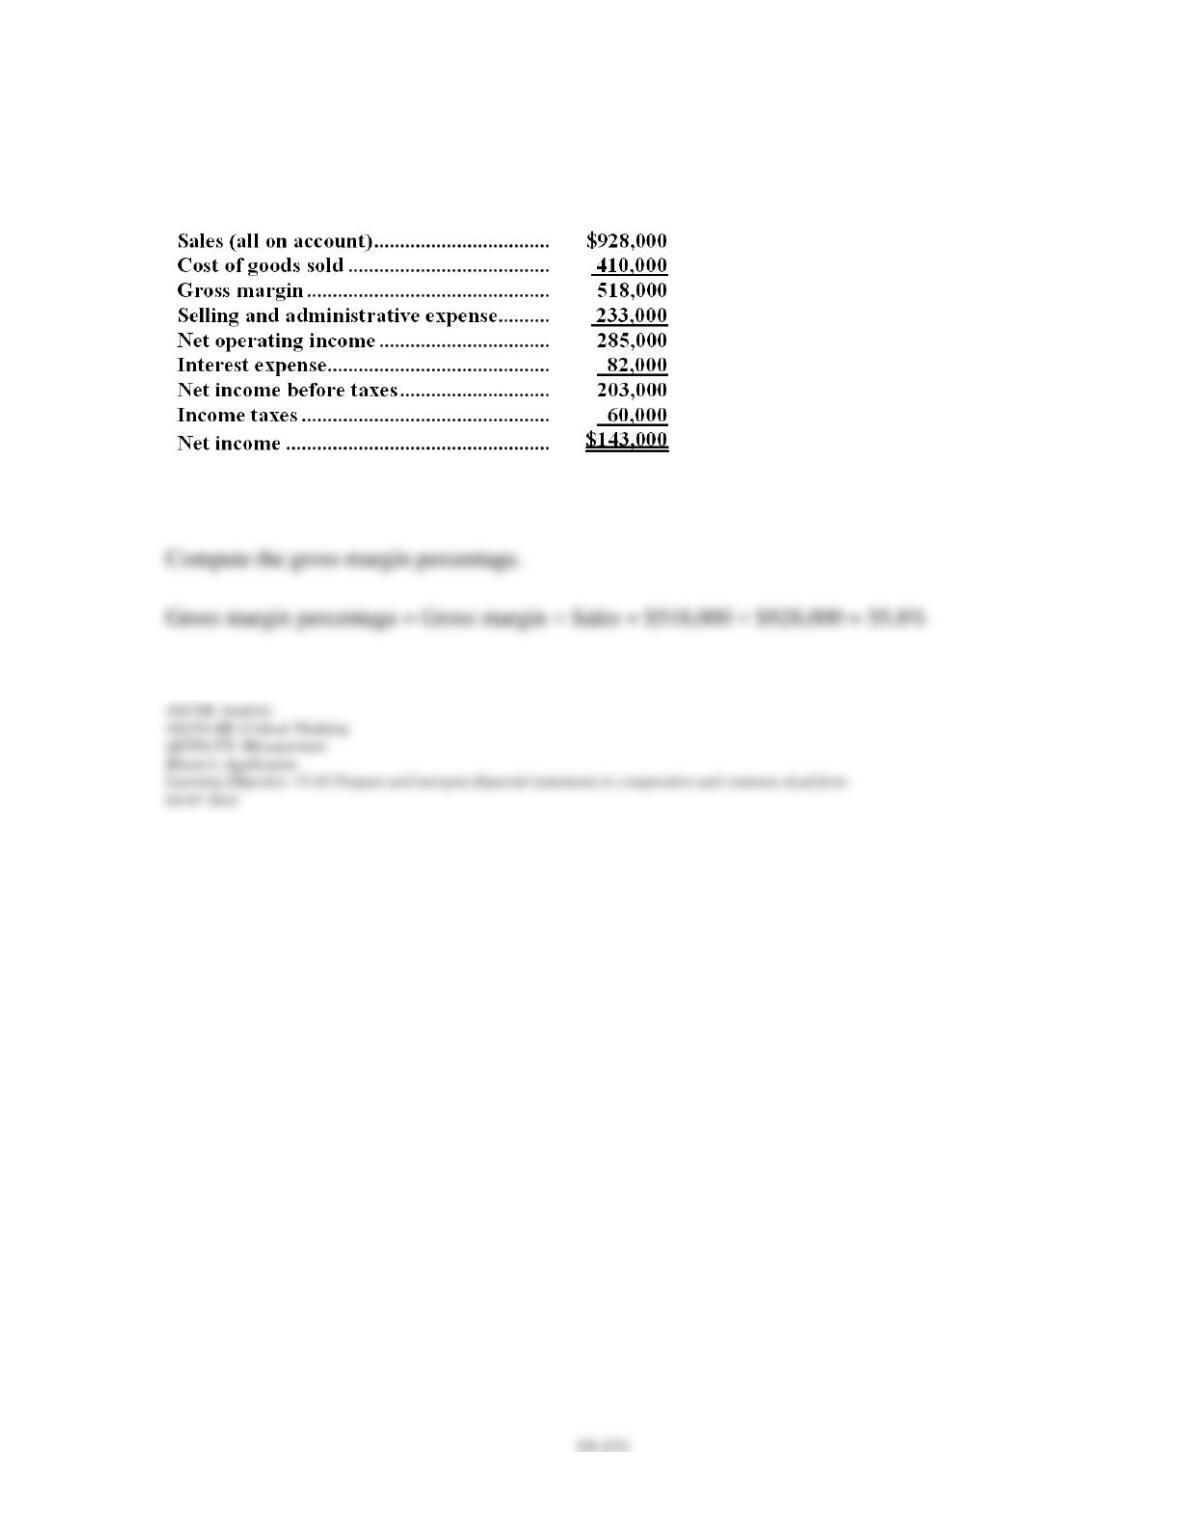
181. Tubergen Corporation’s most recent income statement appears below:
Required:
Chapter 15 – Financial Statement Analysis
15-132
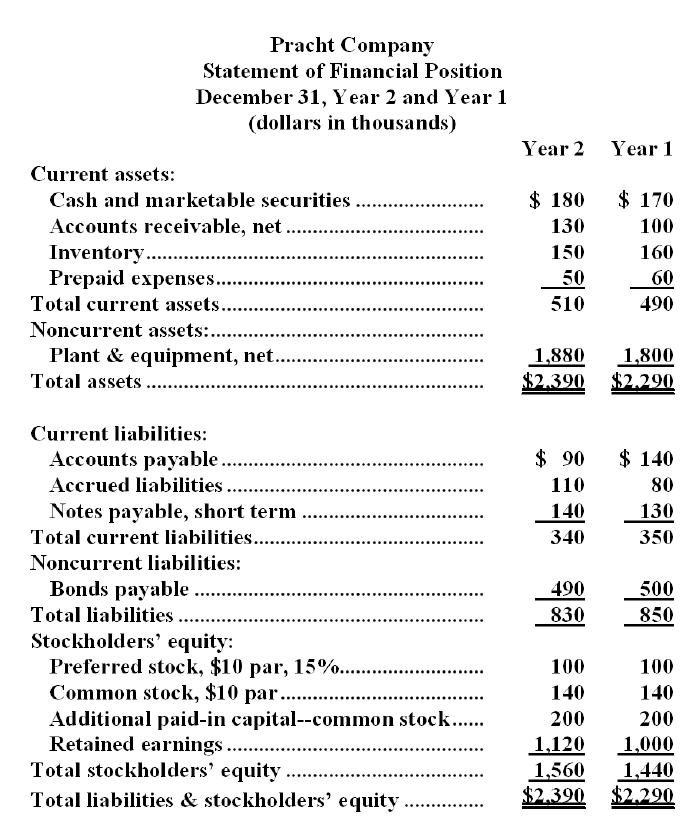
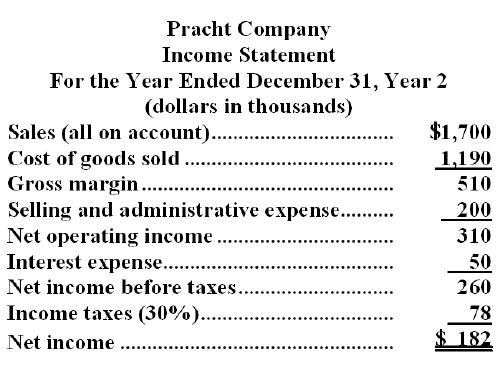
182. Financial statements for Pracht Company appear below:
Chapter 15 – Financial Statement Analysis
15-133
Dividends during Year 2 totaled $62 thousand, of which $15 thousand were preferred
dividends.
The market price of a share of common stock on December 31, Year 2 was $160.
Required:
Compute the following for Year 2:
a. Earnings per share of common stock.
b. Price-earnings ratio.
c. Dividend payout ratio.
d. Dividend yield ratio.
e. Return on total assets.
f. Return on common stockholders’ equity.
g. Book value per share.
h. Working capital.
i. Current ratio.
j. Acid-test ratio.
k. Accounts receivable turnover.
l. Average collection period.
m. Inventory turnover.
n. Average sale period.
o. Times interest earned.
p. Debt-to-equity ratio.
Chapter 15 – Financial Statement Analysis
15-134
Chapter 15 – Financial Statement Analysis
Chapter 15 – Financial Statement Analysis
15-136
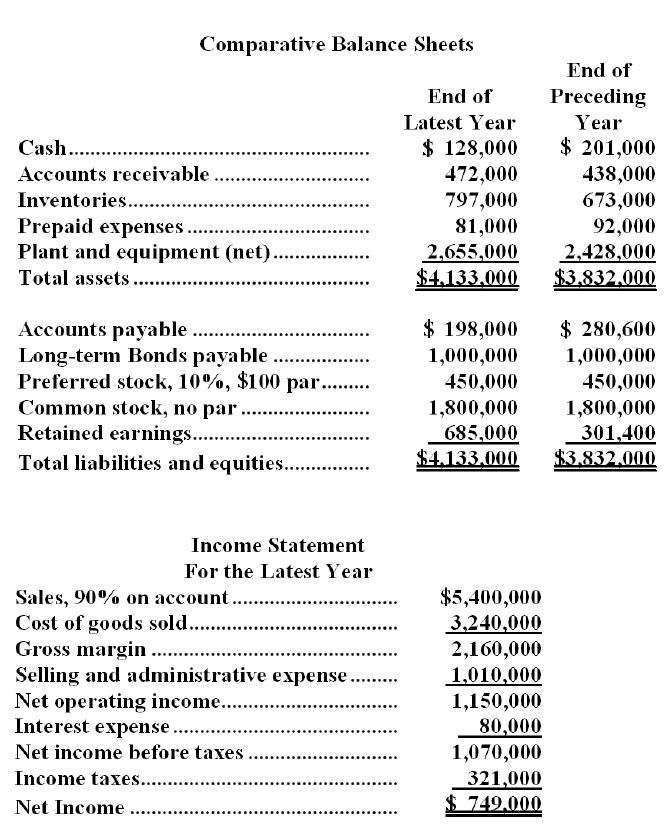
183. Condensed financial statements for Blackhurst Company appear below:
There were 72,000 shares of common stock outstanding throughout the year. Dividends on
common stock amounted to $320,400 and dividends on preferred stock amounted to $45,000.
The market value of a share of common stock was $54 at the end of the year.
Required:
On the basis of the information given above, fill in the blanks with the appropriate figures:
Example: The gross margin as a percent of sales would be computed by dividing $2,160,000
by $5,400,000.
a. The earnings per share of common stock for the year would be computed by dividing
Chapter 15 – Financial Statement Analysis
15-137
_______________ by _________________.
b. The times interest earned for the year would be computed by dividing _______________
by _________________.
c. The price-earnings ratio at the end of the year would be computed by dividing
_______________ by _________________.
d. The dividend payout ratio for the year would be computed by dividing _______________
by _________________.
e. The dividend yield ratio for the year would be computed by dividing _______________ by
_________________.
f. The return on total assets for the year would be computed by dividing _______________ by
_________________.
g. The return on common stockholders’ equity for the year would be computed by dividing
_______________ by _________________.
h. The acid-test ratio at the end of the year would be computed by dividing _______________
by _________________.
i. The accounts receivable turnover for the year would be computed by dividing
_______________ by _________________.
j. The inventory turnover for the year would be computed by dividing _______________ by
_________________.
k. The debt-to-equity ratio at the end of the year would be computed by dividing
_______________ by _________________.

Chapter 15 – Financial Statement Analysis
Chapter 15 – Financial Statement Analysis
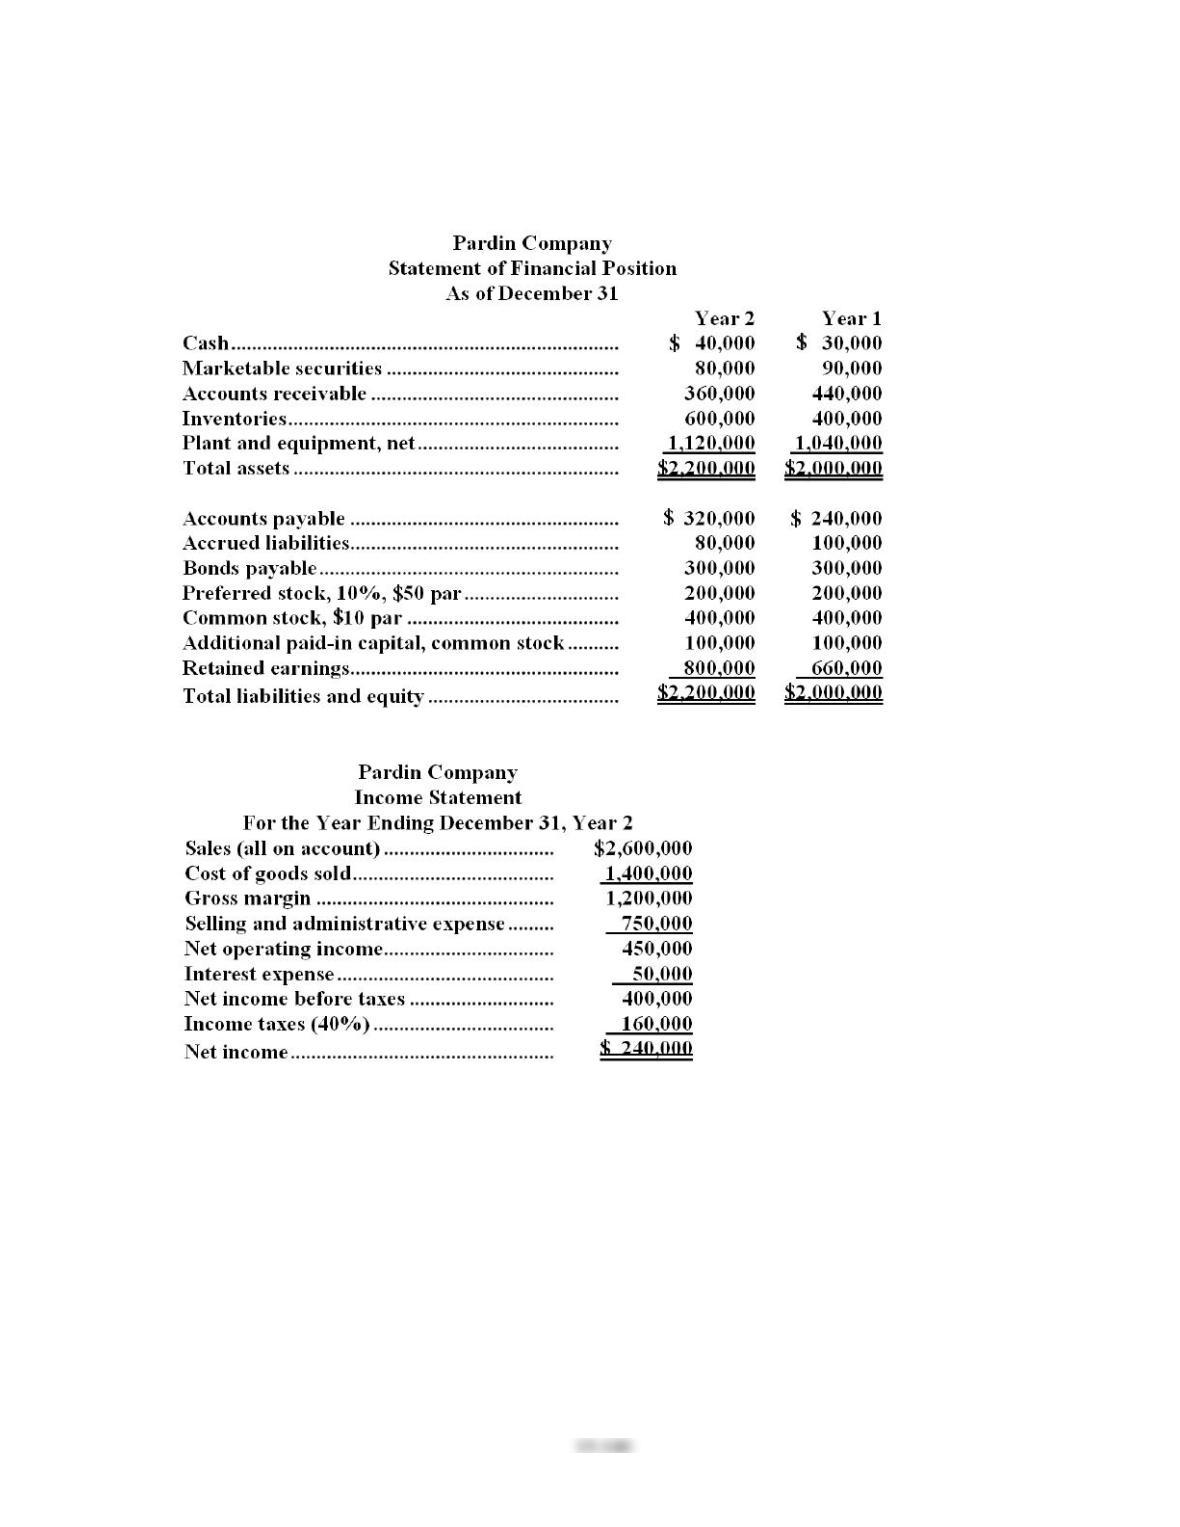
184. Condensed financial statements for Pardin Company are given below: