Chapter 15 – Financial Statement Analysis
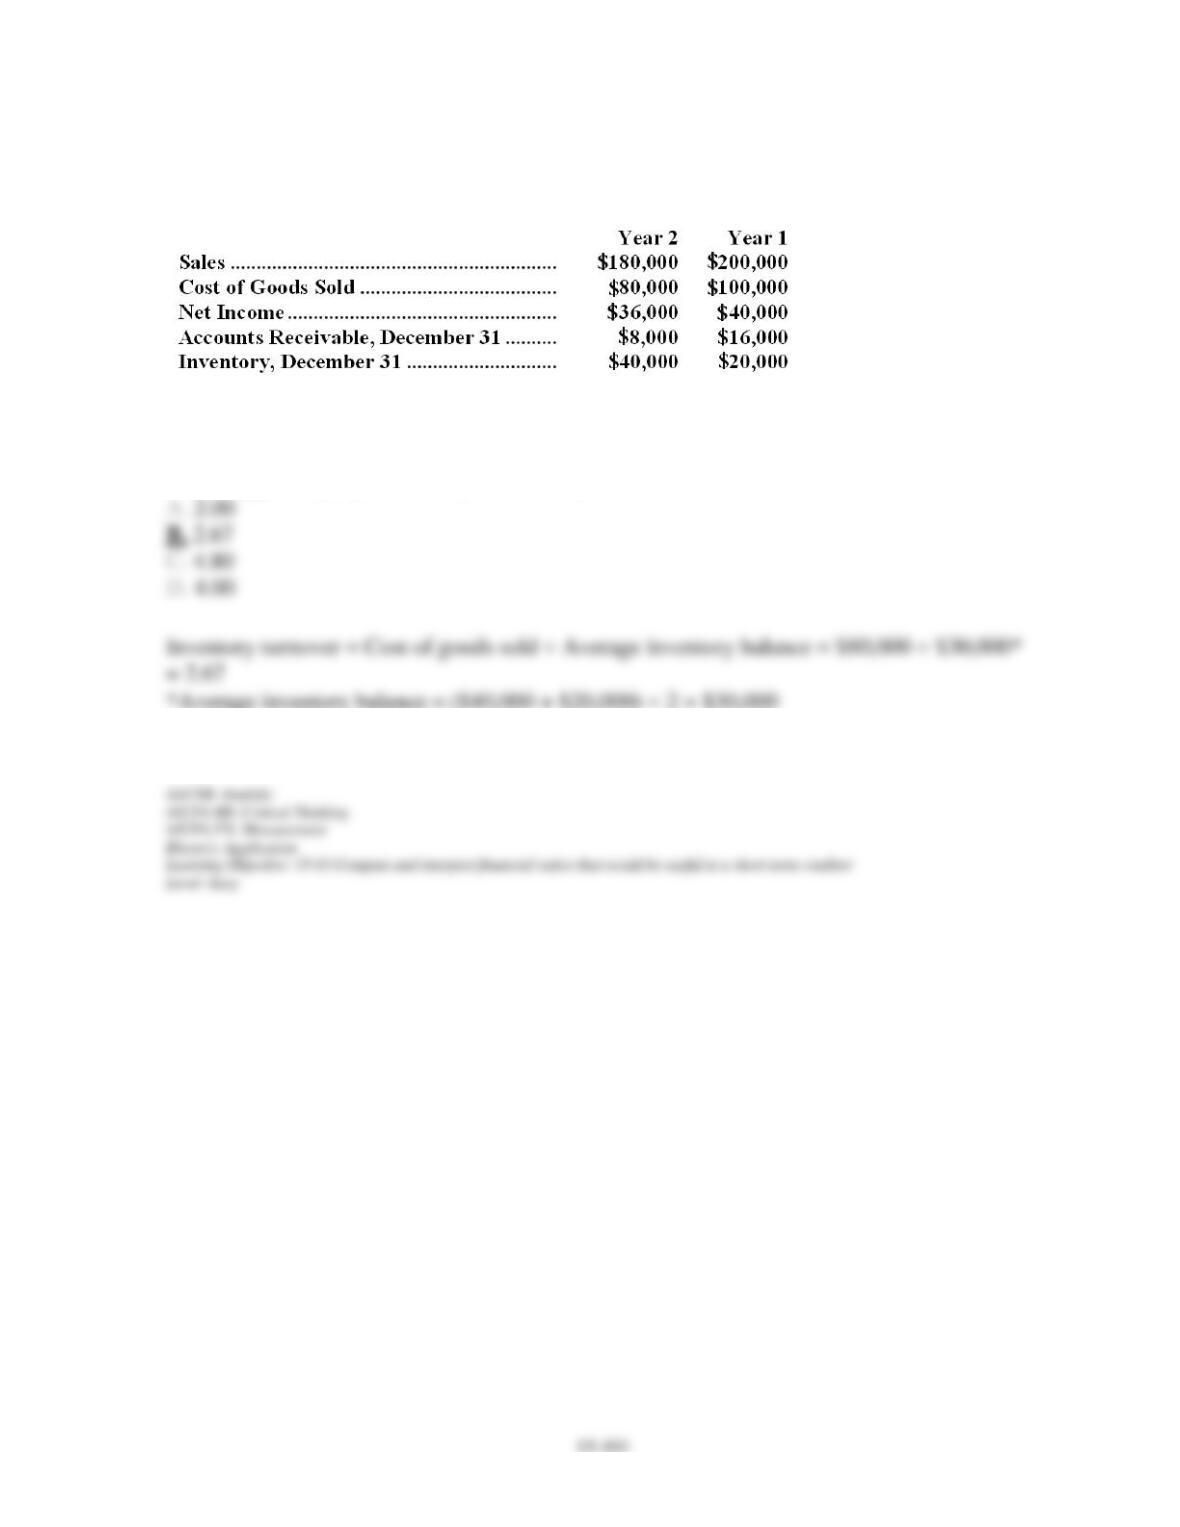
Selected financial data for Bragg Company appear below:
147. Bragg Company’s inventory turnover ratio for Year 2 was closest to:
Chapter 15 – Financial Statement Analysis
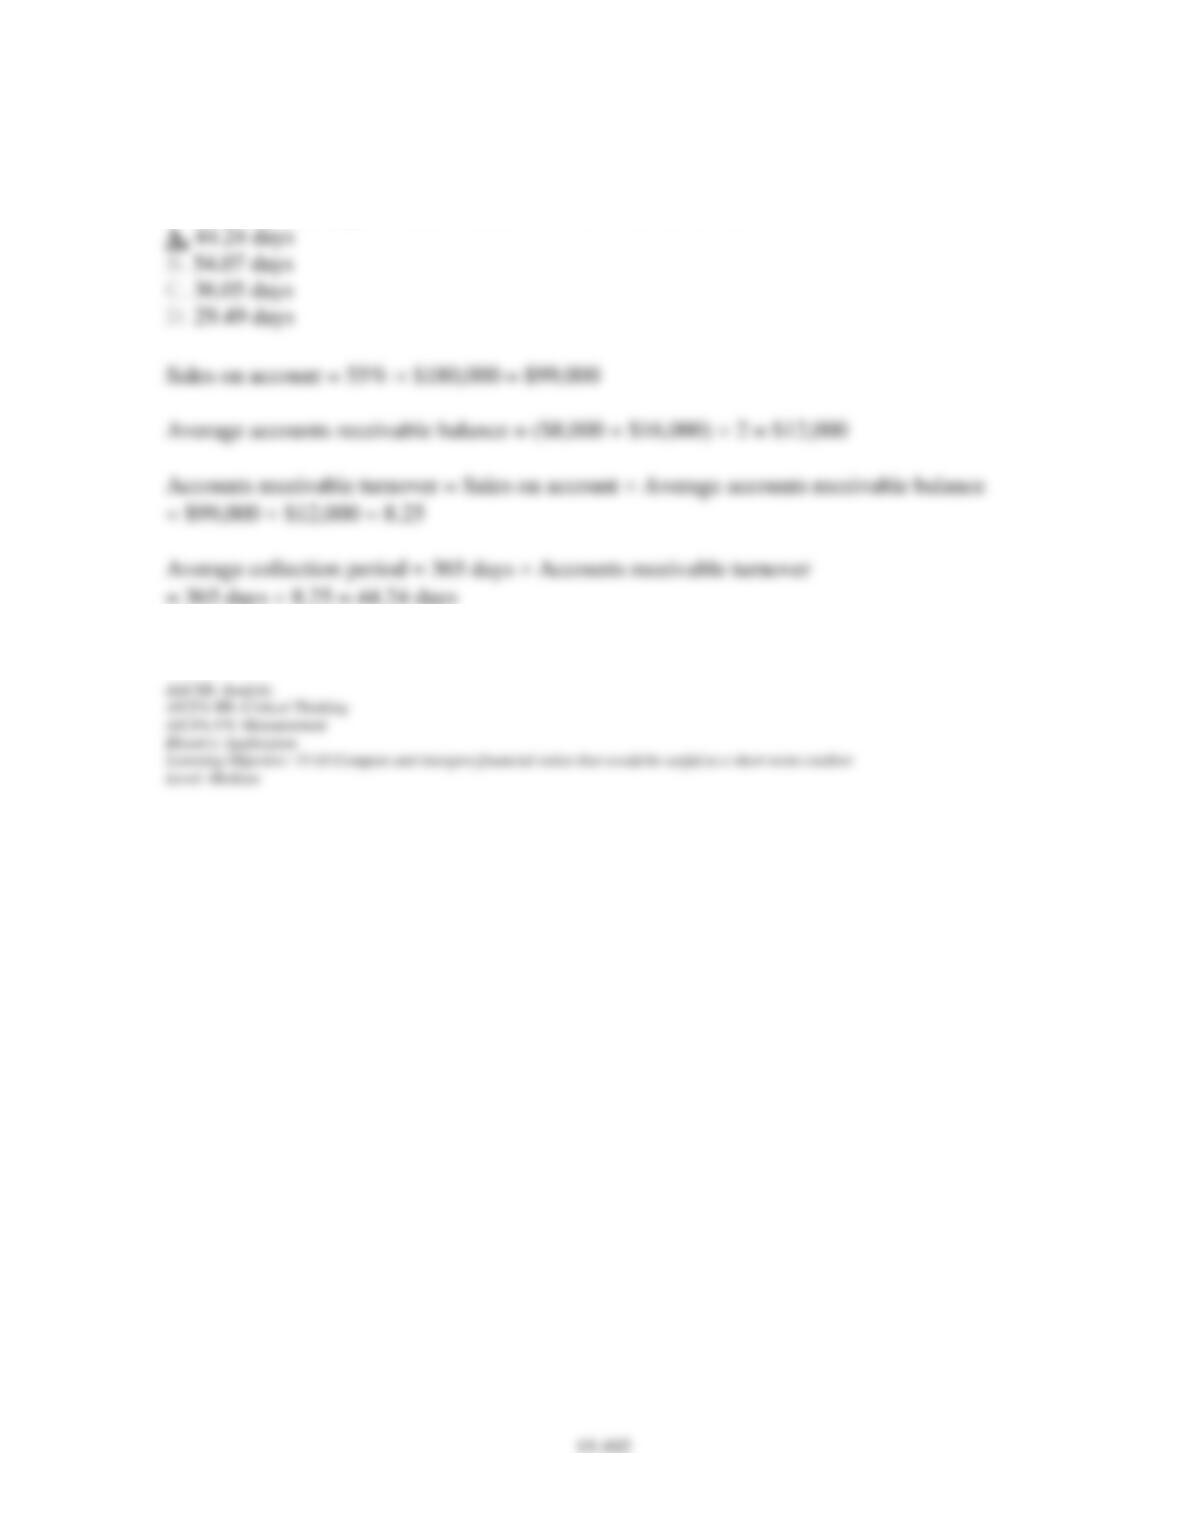
148. Suppose that 45% of Bragg Company’s total sales are cash sales. The company’s average
collection period (age of receivables) for Year 2 was closest to:
Chapter 15 – Financial Statement Analysis
15-103
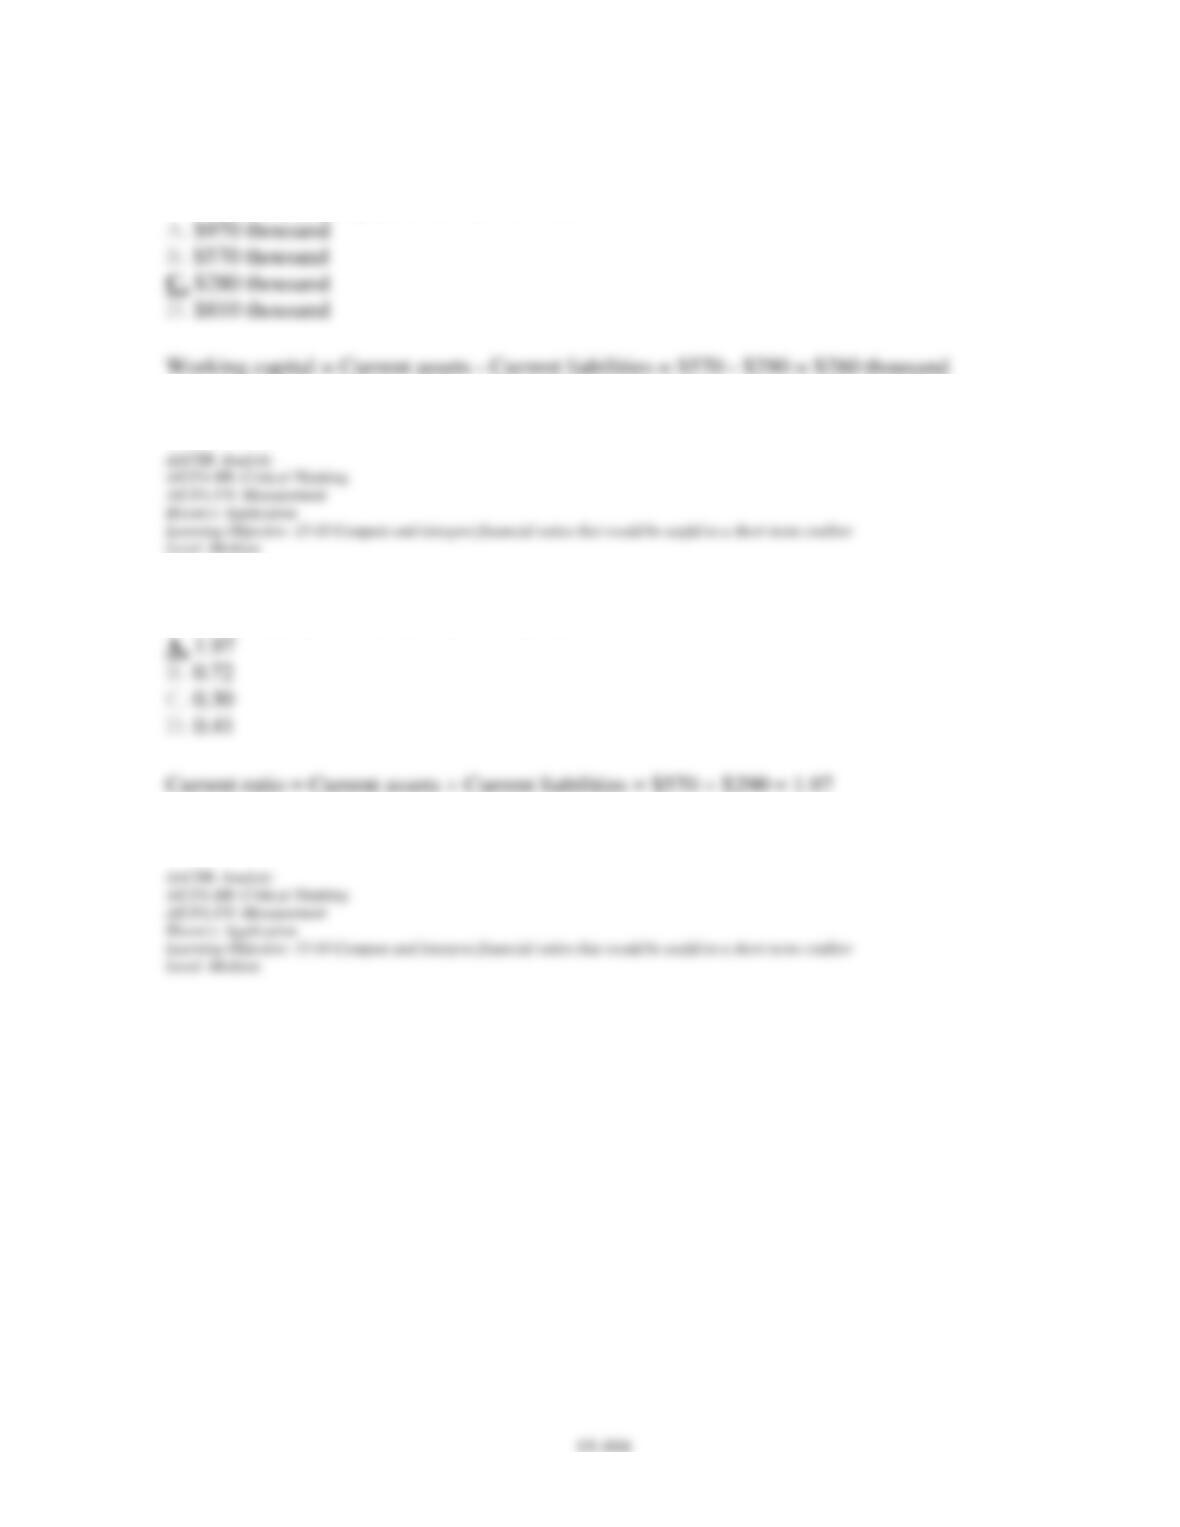
Dieringer Corporation’s most recent balance sheet and income statement appear below:
Chapter 15 – Financial Statement Analysis
149. The working capital at the end of Year 2 is:
150. The current ratio at the end of Year 2 is closest to:
Chapter 15 – Financial Statement Analysis
151. The acid-test ratio at the end of Year 2 is closest to:
152. The accounts receivable turnover for Year 2 is closest to:
Chapter 15 – Financial Statement Analysis
153. The average collection period for Year 2 is closest to:
154. The inventory turnover for Year 2 is closest to:
Chapter 15 – Financial Statement Analysis
15-107
155. The average sale period for Year 2 is closest to:
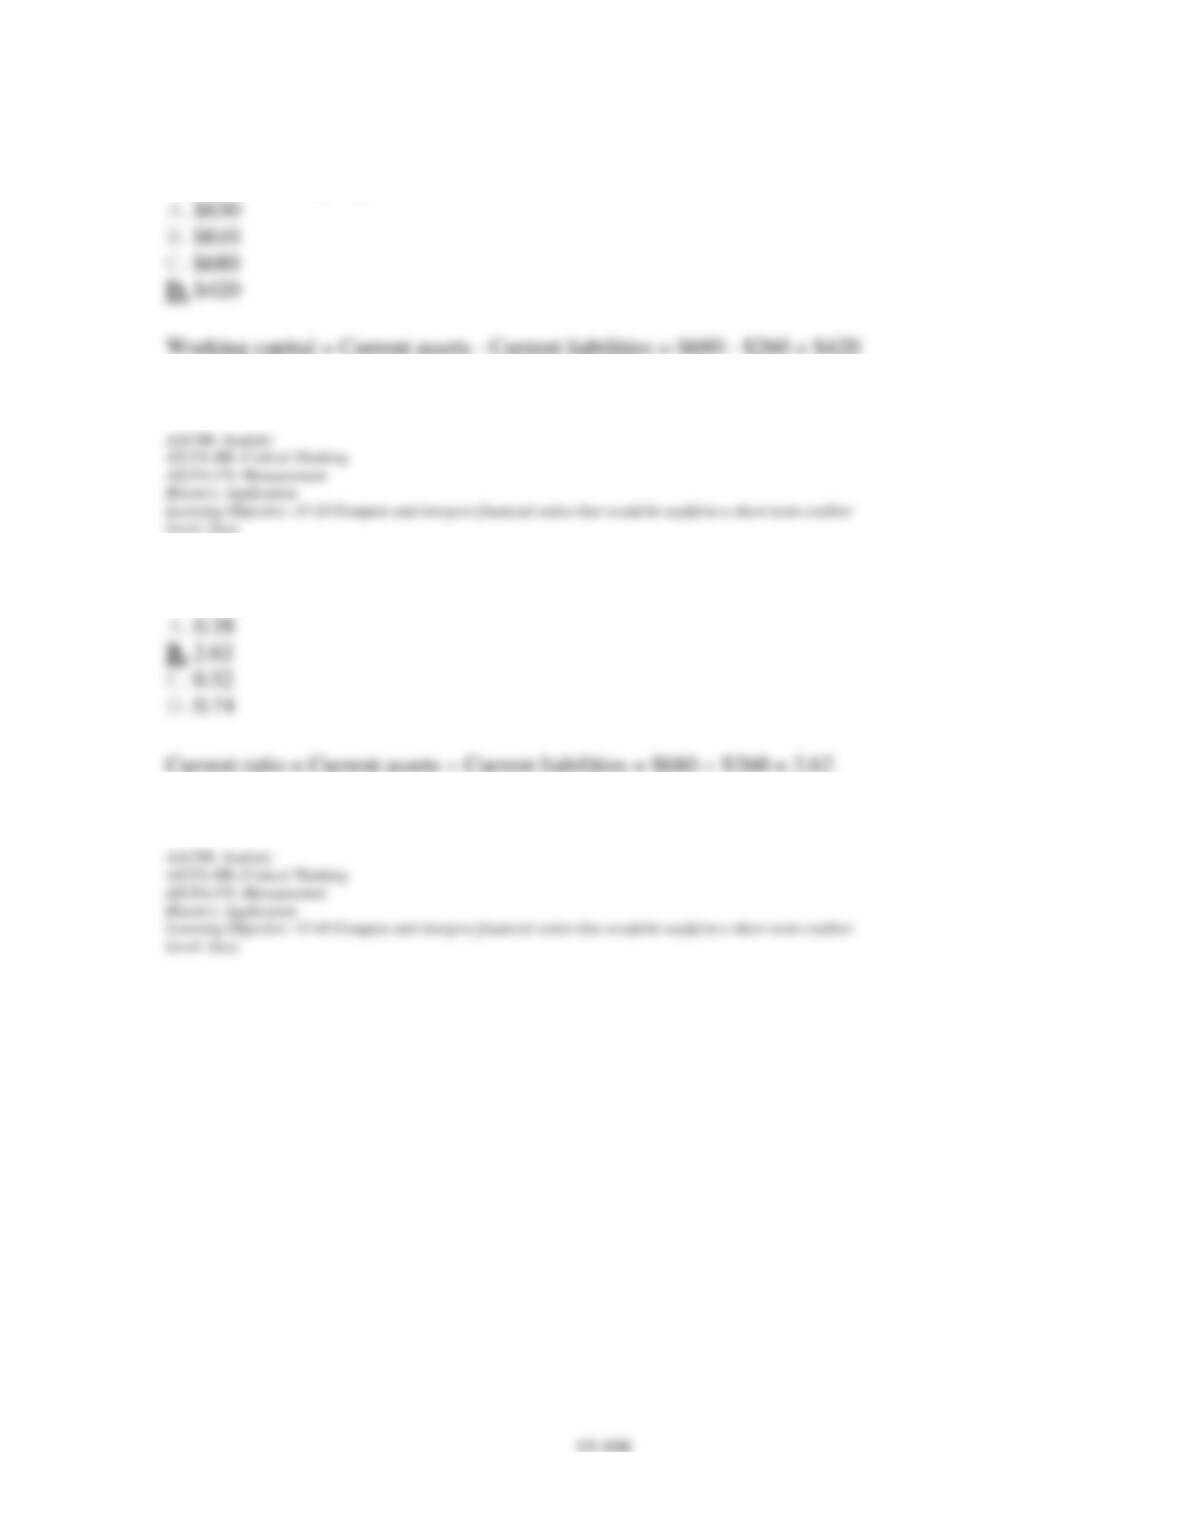
Excerpts from Zorra Corporation’s most recent balance sheet appear below:
Sales on account in Year 2 amounted to $1,370 and the cost of goods sold was $850.
Chapter 15 – Financial Statement Analysis
156. The working capital at the end of Year 2 is:
157. The current ratio at the end of Year 2 is closest to:
Chapter 15 – Financial Statement Analysis
158. The acid-test ratio at the end of Year 2 is closest to:
159. The accounts receivable turnover for Year 2 is closest to:
Chapter 15 – Financial Statement Analysis
160. The average collection period for Year 2 is closest to:
161. The inventory turnover for Year 2 is closest to:
Chapter 15 – Financial Statement Analysis
15-111
162. The average sale period for Year 2 is closest to:
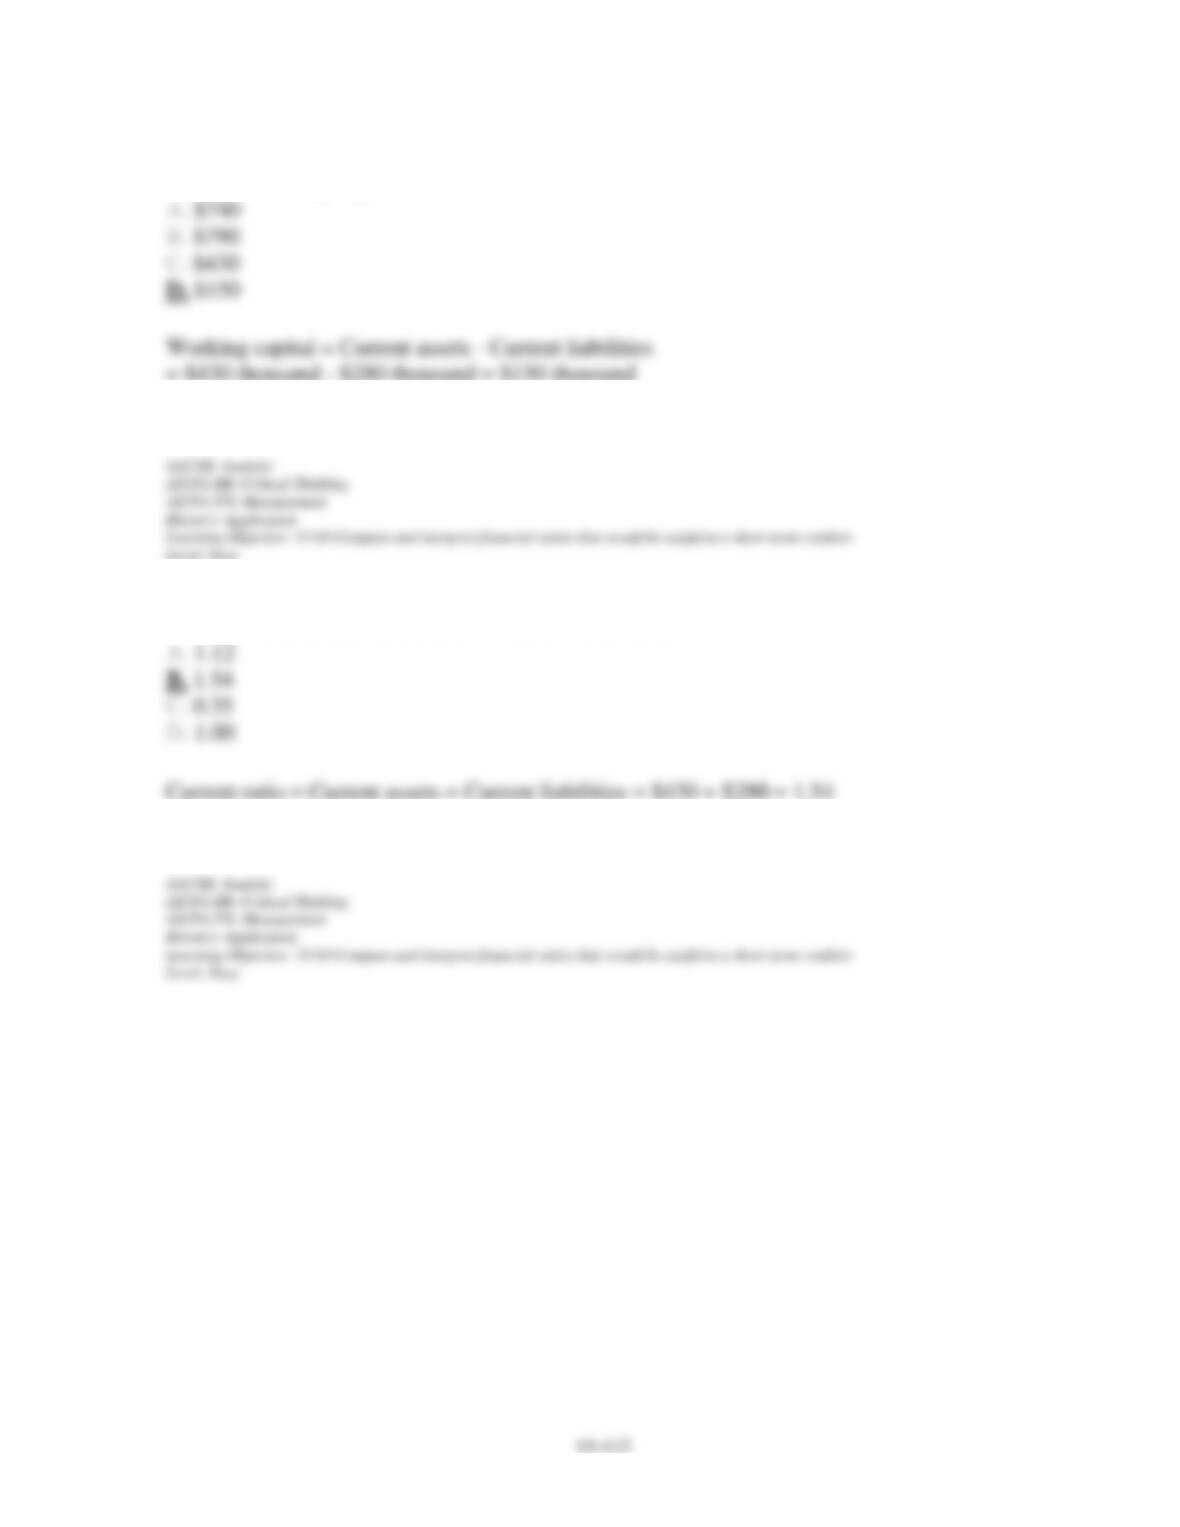
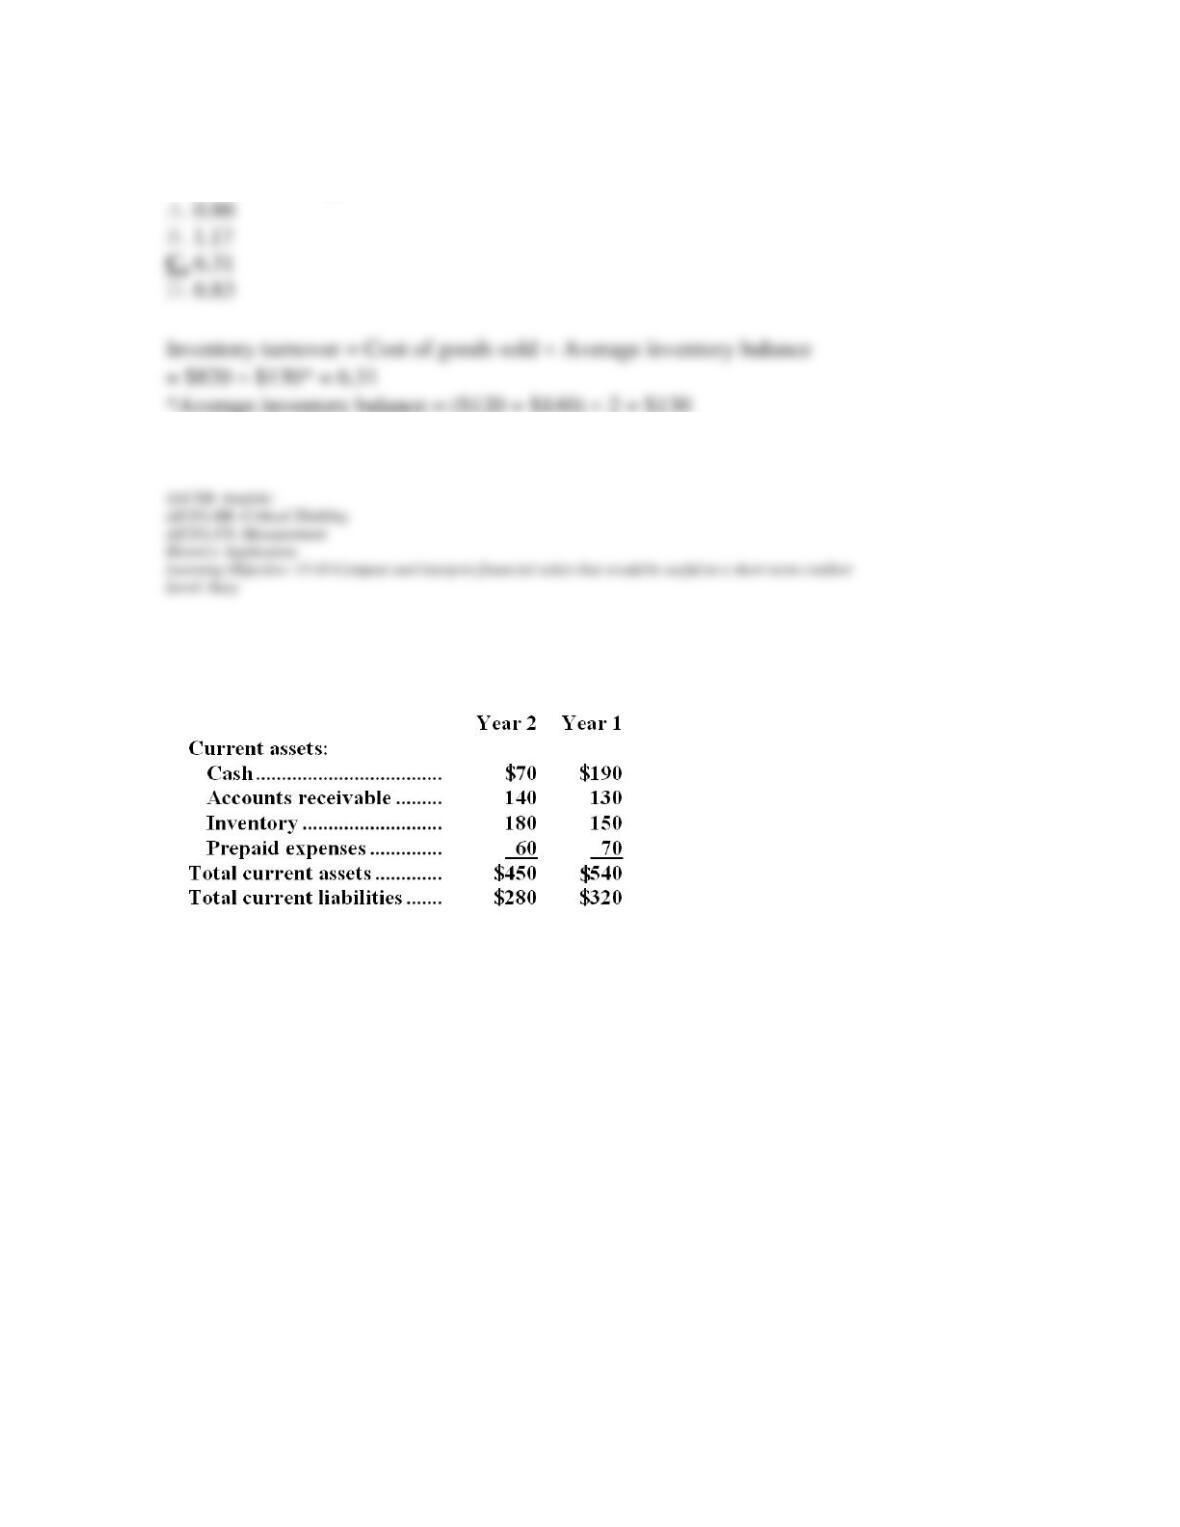
Excerpts from Tigner Corporation’s most recent balance sheet appear below:
Sales on account in Year 2 amounted to $1,230 and the cost of goods sold was $820.
Chapter 15 – Financial Statement Analysis
163. The working capital at the end of Year 2 is:
164. The current ratio at the end of Year 2 is closest to:
Chapter 15 – Financial Statement Analysis
165. The acid-test ratio at the end of Year 2 is closest to:
166. The accounts receivable turnover for Year 2 is closest to:
Chapter 15 – Financial Statement Analysis
15-114
167. The inventory turnover for Year 2 is closest to:
Data from Kooistra Corporation’s most recent balance sheet appear below:
Sales on account in Year 2 amounted to $1,270 and the cost of goods sold was $770.
Chapter 15 – Financial Statement Analysis
168. The working capital at the end of Year 2 is:
169. The current ratio at the end of Year 2 is closest to:
Chapter 15 – Financial Statement Analysis
170. The acid-test ratio at the end of Year 2 is closest to:
171. The average collection period for Year 2 is closest to:
Chapter 15 – Financial Statement Analysis
172. The average sale period for Year 2 is closest to:
Chapter 15 – Financial Statement Analysis
15-118
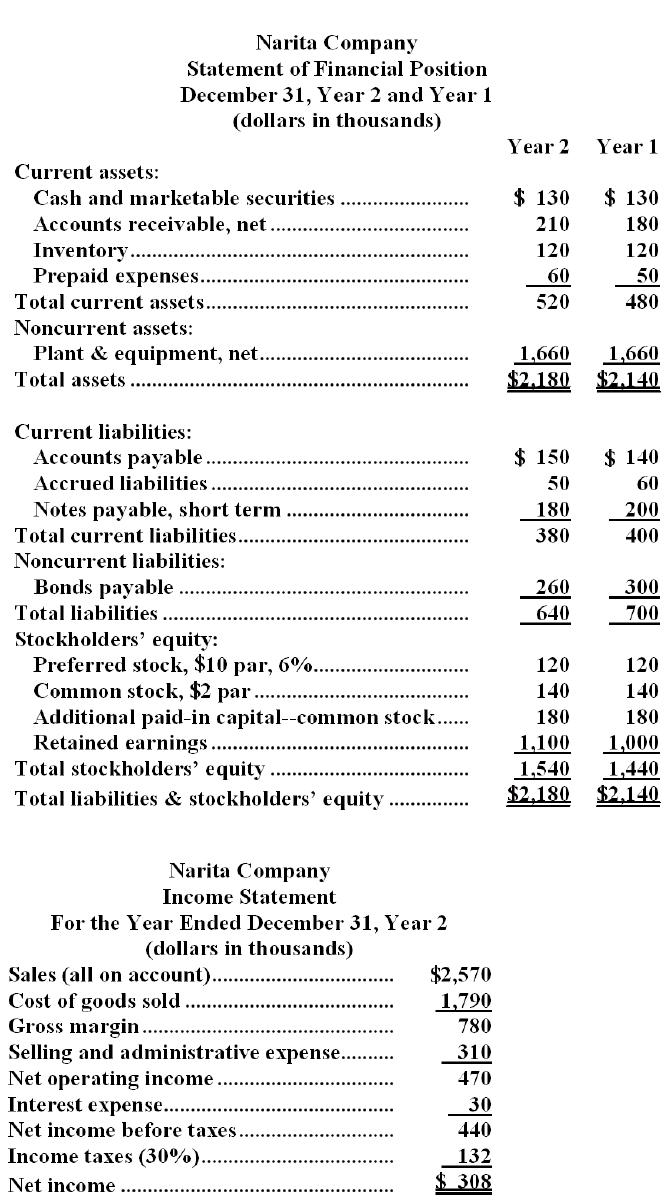
Financial statements for Narita Company appear below:
Chapter 15 – Financial Statement Analysis
173. Narita Company’s times interest earned for Year 2 was closest to:
174. Narita Company’s debt-to-equity ratio at the end of Year 2 was closest to:
Chapter 15 – Financial Statement Analysis
15-120
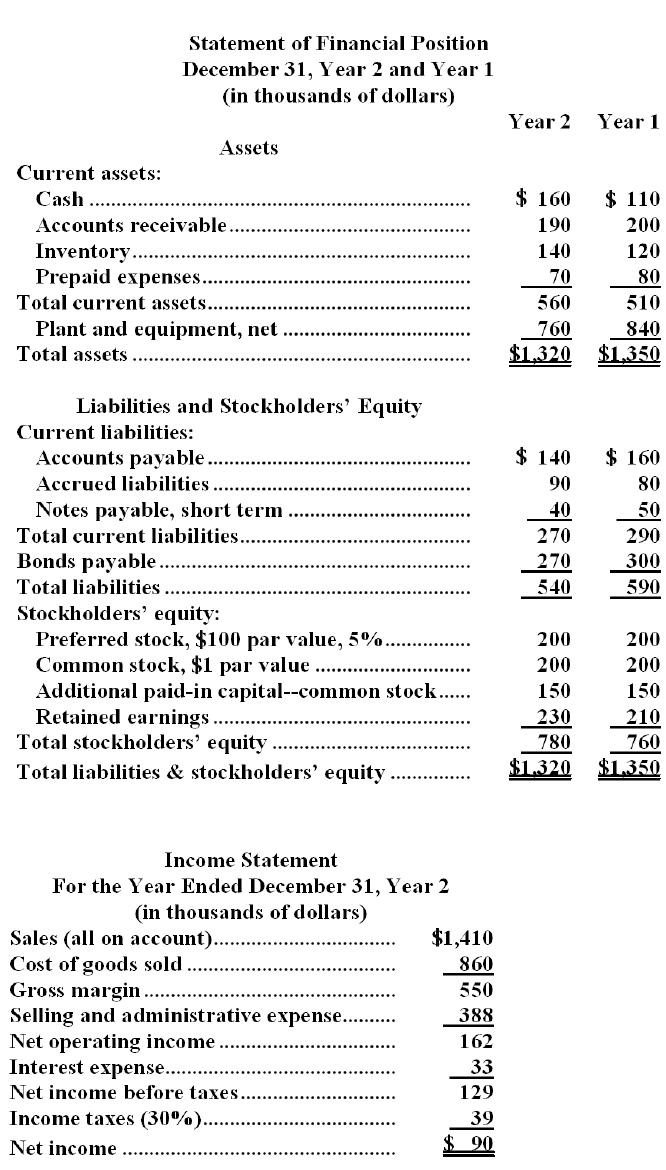
Mclaughlin Corporation’s most recent balance sheet and income statement appear below: