Chapter 15 – Financial Statement Analysis
120. Larned Company’s dividend yield ratio on December 31, Year 2 was closest to:
121. Larned Company’s return on total assets for Year 2 was closest to:
Chapter 15 – Financial Statement Analysis
122. Larned Company’s return on common stockholders’ equity for Year 2 was closest to:
123. Larned Company’s book value per share at the end of Year 2 was closest to:
Chapter 15 – Financial Statement Analysis
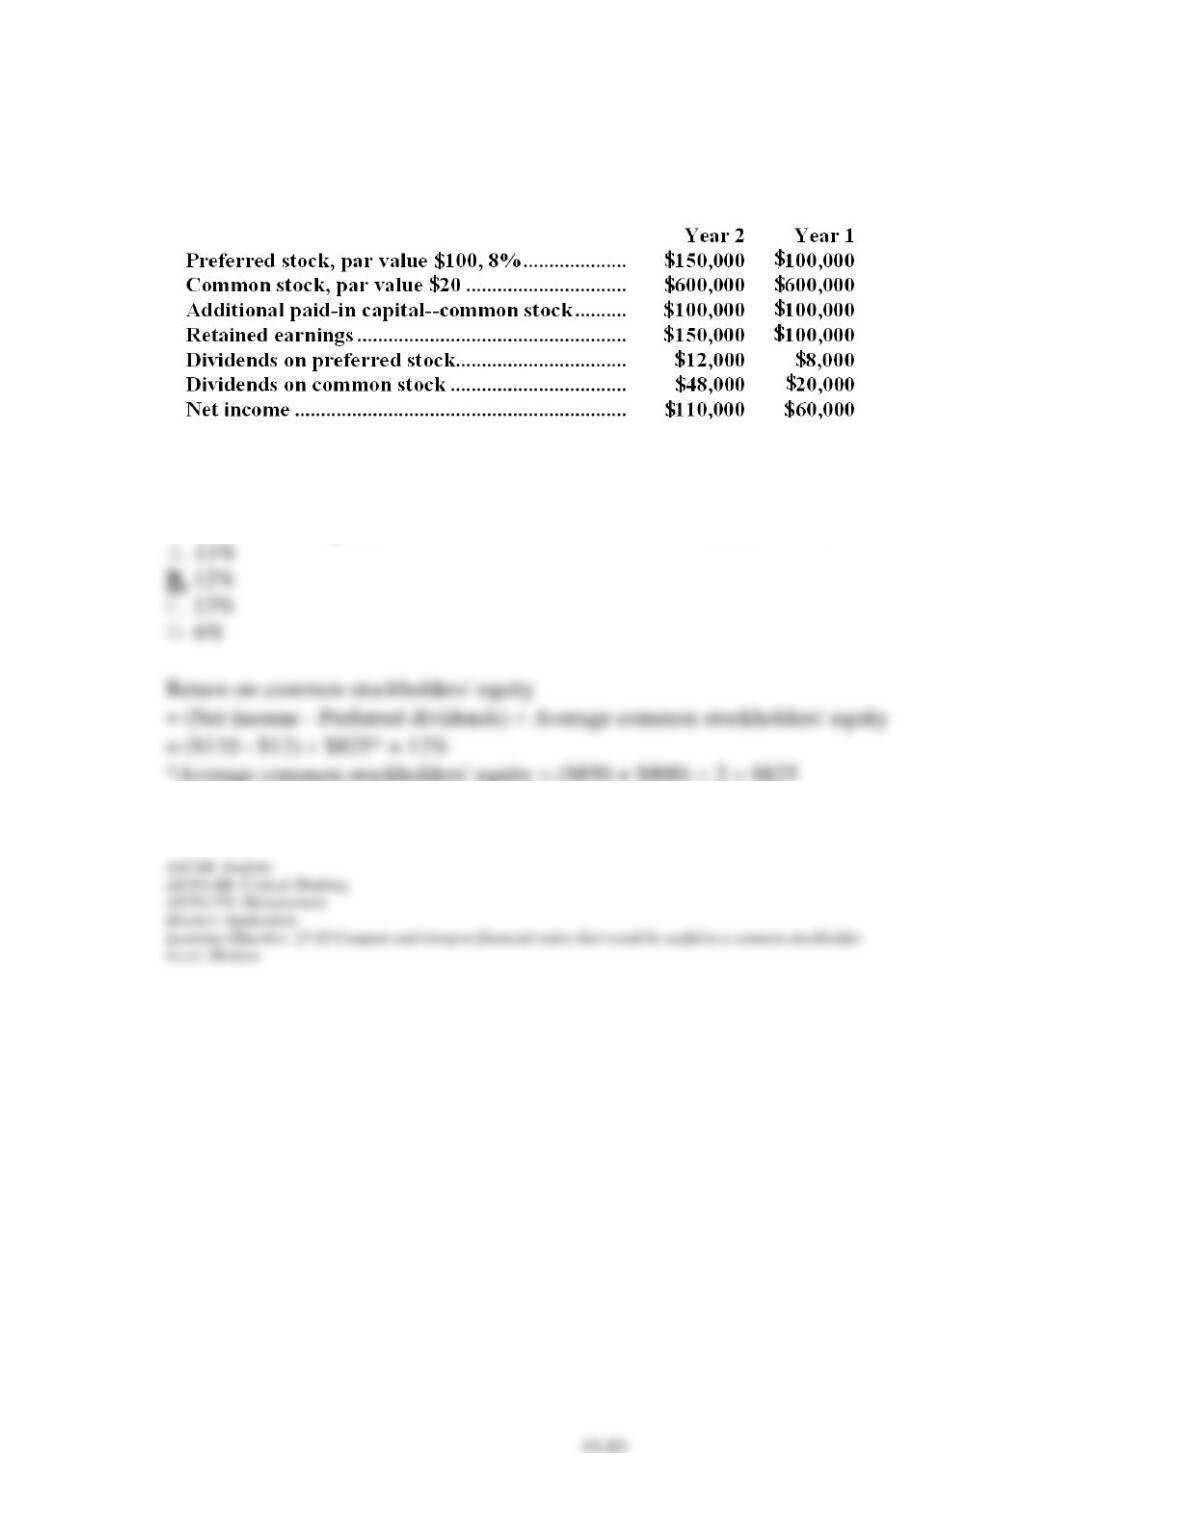
The following selected data are for Geneva Company:
124. Geneva Company’s return on common stockholders’ equity for Year 2 is closest to:
Chapter 15 – Financial Statement Analysis
125. The earnings per share of common stock for Year 2 is closest to:
Chapter 15 – Financial Statement Analysis
15–85
Cadarette Corporation’s most recent balance sheet and income statement appear below:
Dividends on common stock during Year 2 totaled $40 thousand. Dividends on preferred
Chapter 15 – Financial Statement Analysis
stock totaled $10 thousand. The market price of common stock at the end of Year 2 was
$17.73 per share.
126. The earnings per share of common stock for Year 2 is closest to:
Chapter 15 – Financial Statement Analysis
127. The price-earnings ratio for Year 2 is closest to:
Chapter 15 – Financial Statement Analysis
128. The dividend payout ratio for Year 2 is closest to:
Chapter 15 – Financial Statement Analysis
129. The dividend yield ratio for Year 2 is closest to:
130. The return on total assets for Year 2 is closest to:
Chapter 15 – Financial Statement Analysis
131. The return on common stockholders’ equity for Year 2 is closest to:
132. The book value per share at the end of Year 2 is closest to:
Chapter 15 – Financial Statement Analysis
15–91
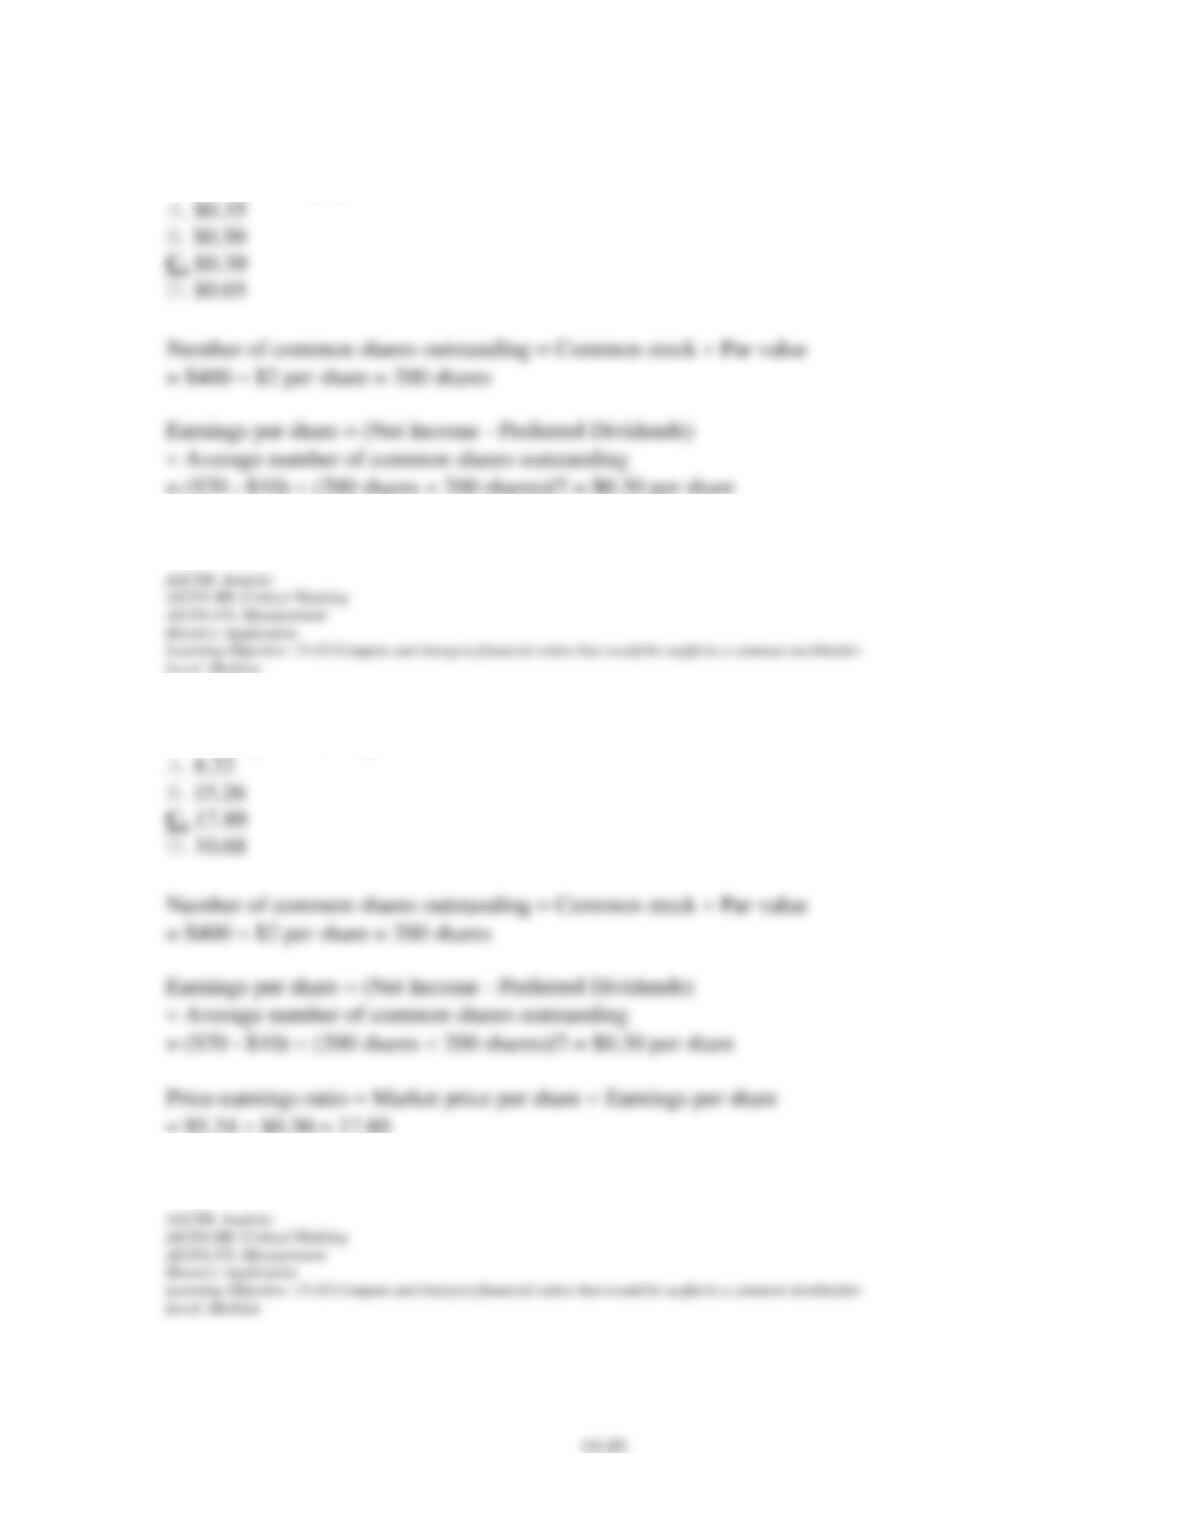
Excerpts from Goodrow Corporation’s most recent balance sheet and income statement
appear below:
Dividends on common stock during Year 2 totaled $20 thousand. Dividends on preferred
stock totaled $10 thousand. The market price of common stock at the end of Year 2 was $5.34
per share.
Chapter 15 – Financial Statement Analysis
133. The earnings per share of common stock for Year 2 is closest to:
134. The price-earnings ratio for Year 2 is closest to:
Chapter 15 – Financial Statement Analysis
135. The dividend payout ratio for Year 2 is closest to:
Chapter 15 – Financial Statement Analysis
136. The dividend yield ratio for Year 2 is closest to:
137. The return on total assets for Year 2 is closest to:
Chapter 15 – Financial Statement Analysis
138. The return on common stockholders’ equity for Year 2 is closest to:
139. The book value per share at the end of Year 2 is closest to:
Chapter 15 – Financial Statement Analysis
15–96
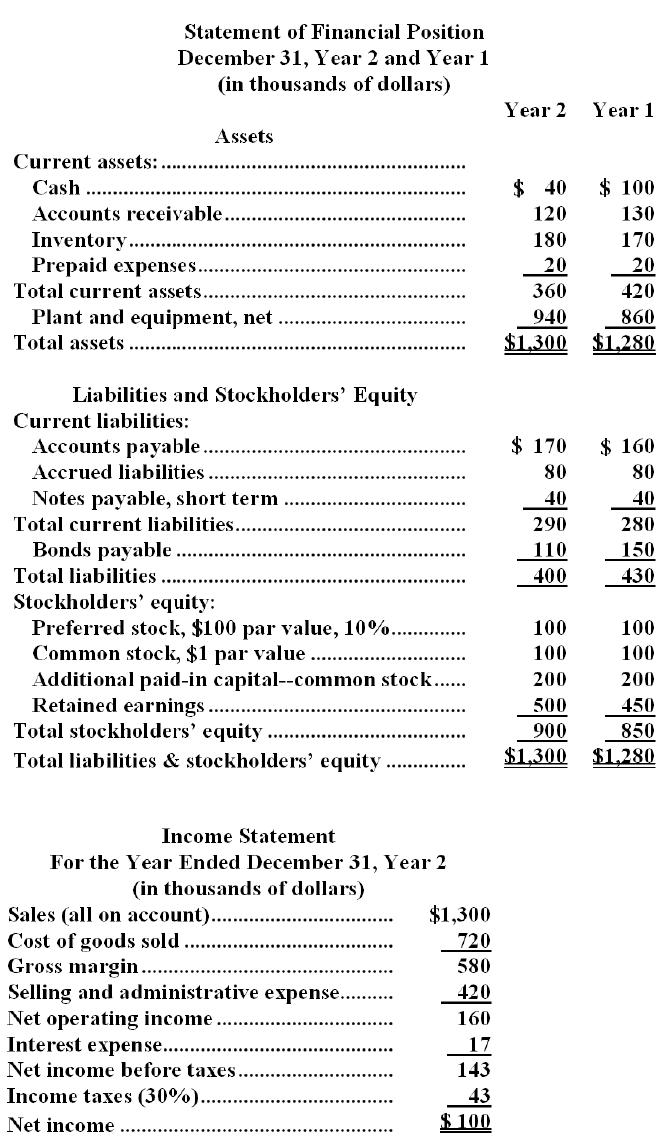
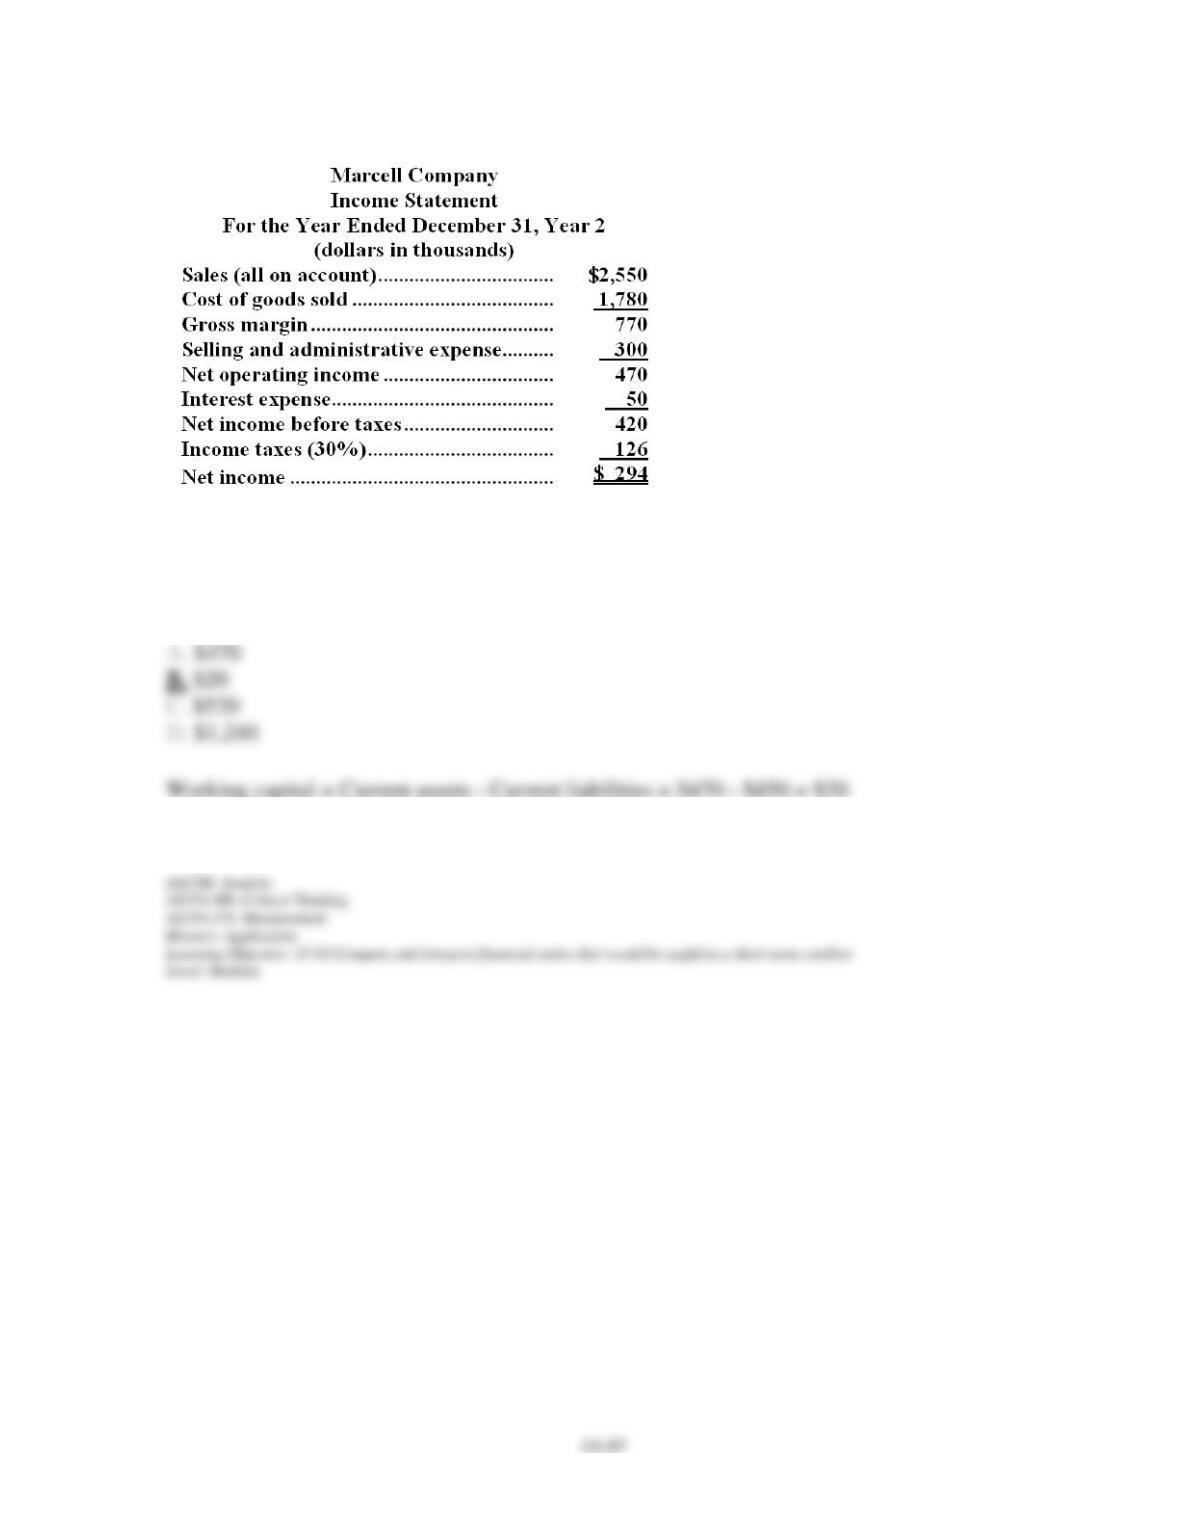
Financial statements for Marcell Company appear below:
Chapter 15 – Financial Statement Analysis
140. Marcell Company’s working capital (in thousands of dollars) at the end of Year 2 was
closest to:
Chapter 15 – Financial Statement Analysis
141. Marcell Company’s current ratio at the end of Year 2 was closest to:
142. Marcell Company’s acid-test ratio at the end of Year 2 was closest to:
Chapter 15 – Financial Statement Analysis
143. Marcell Company’s accounts receivable turnover for Year 2 was closest to:
144. Marcell Company’s average collection period for Year 2 was closest to:
Chapter 15 – Financial Statement Analysis
145. Marcell Company’s inventory turnover for Year 2 was closest to:
146. Marcell Company’s average sale period for Year 2 was closest to: