Chapter 15 – Financial Statement Analysis
93. The dividend payout ratio for Year 2 is closest to:
Chapter 15 – Financial Statement Analysis
94. The dividend yield ratio for Year 2 is closest to:
95. The return on total assets for Year 2 is closest to:
Chapter 15 – Financial Statement Analysis
96. The return on common stockholders’ equity for Year 2 is closest to:
97. The book value per share at the end of Year 2 is closest to:
Chapter 15 – Financial Statement Analysis
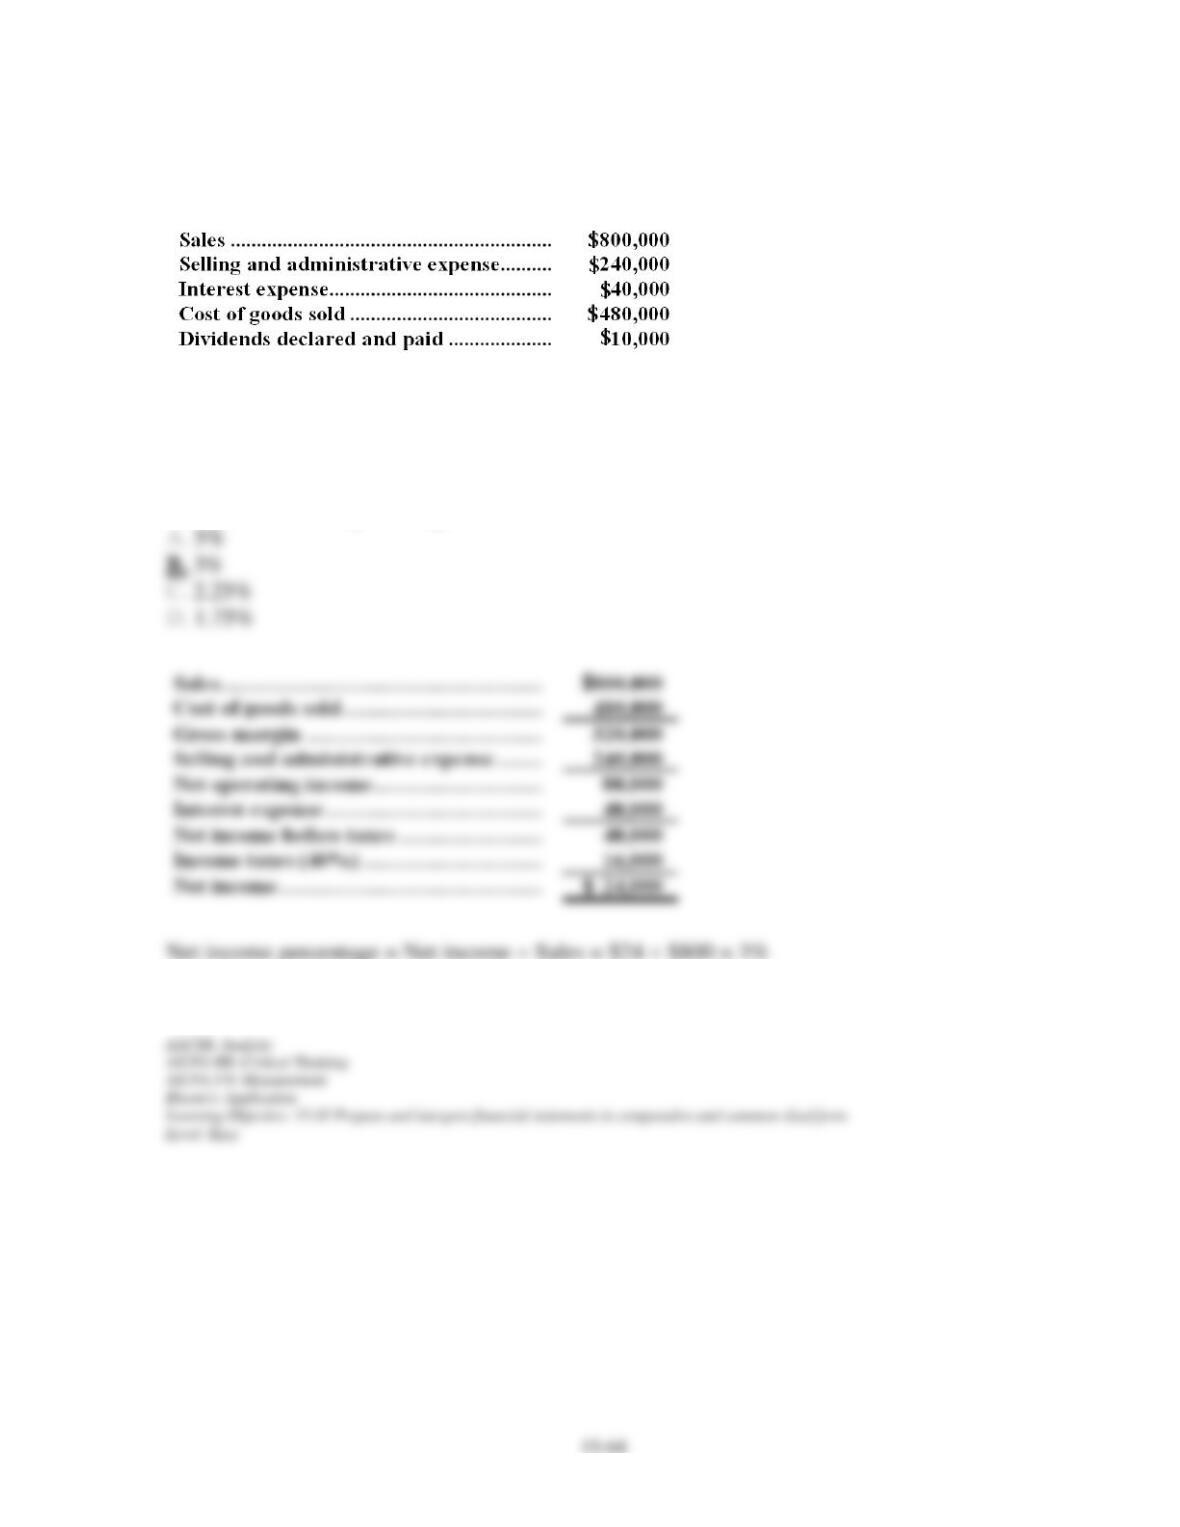
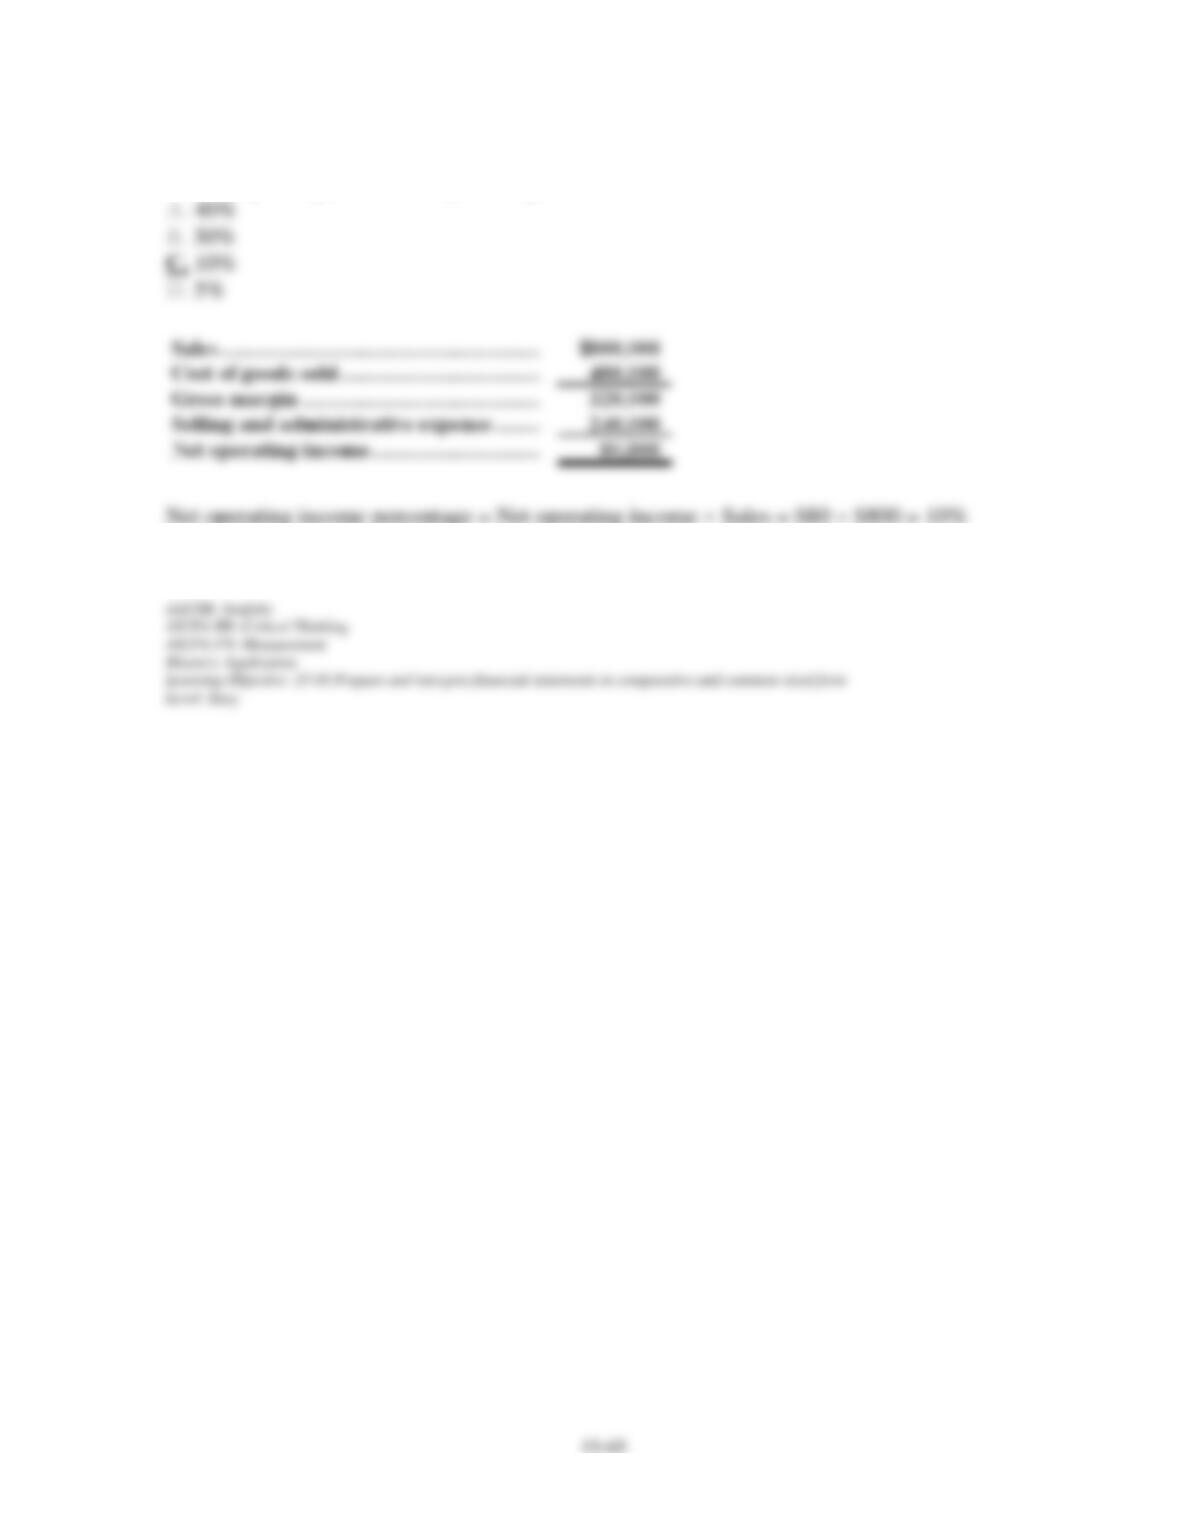
Selected financial data from Osterville Company for the most recent year appear below:
The income tax rate is 40%.
98. Net income as a percentage of sales was:
Chapter 15 – Financial Statement Analysis
99. Net operating income as a percentage of sales was:
Chapter 15 – Financial Statement Analysis
15–66
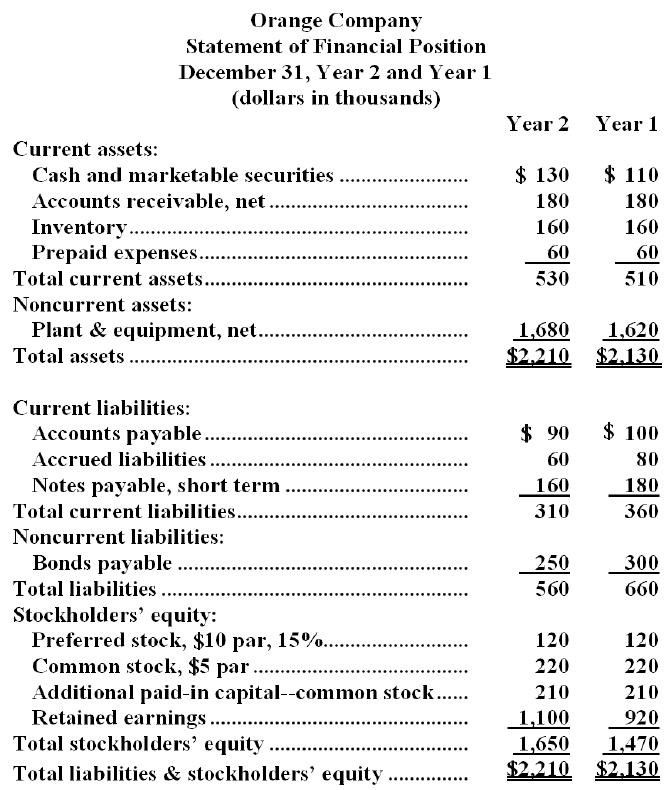
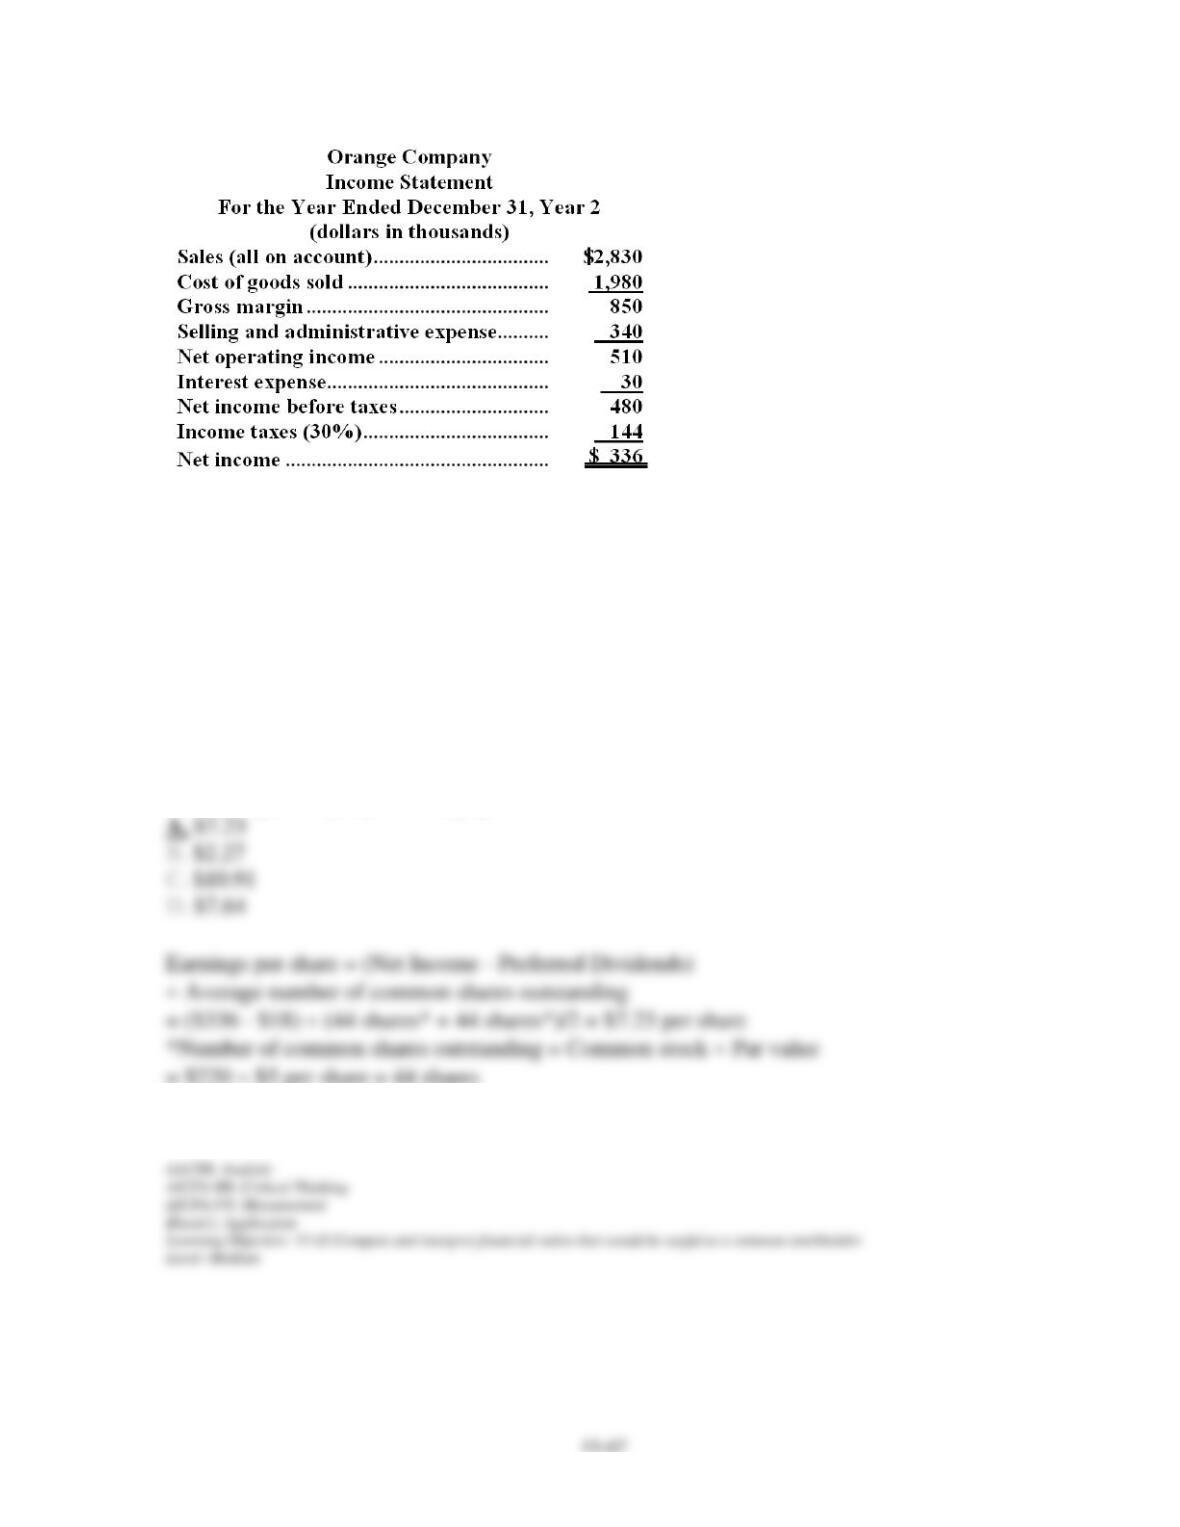
Financial statements for Orange Company appear below:
Chapter 15 – Financial Statement Analysis
Dividends during Year 2 totaled $156 thousand, of which $18 thousand were preferred
dividends.
The market price of a share of common stock on December 31, Year 2 was $100.
100. Orange Company’s earnings per share of common stock for Year 2 was closest to:
Chapter 15 – Financial Statement Analysis
101. Orange Company’s dividend yield ratio on December 31, Year 2 was closest to:
102. Orange Company’s return on total assets for Year 2 was closest to:
Chapter 15 – Financial Statement Analysis
103. Orange Company’s current ratio at the end of Year 2 was closest to:
104. Orange Company’s accounts receivable turnover for Year 2 was closest to:
Chapter 15 – Financial Statement Analysis
105. Orange Company’s average sale period for Year 2 was closest to:
106. Orange Company’s times interest earned for Year 2 was closest to:
Chapter 15 – Financial Statement Analysis
15–71
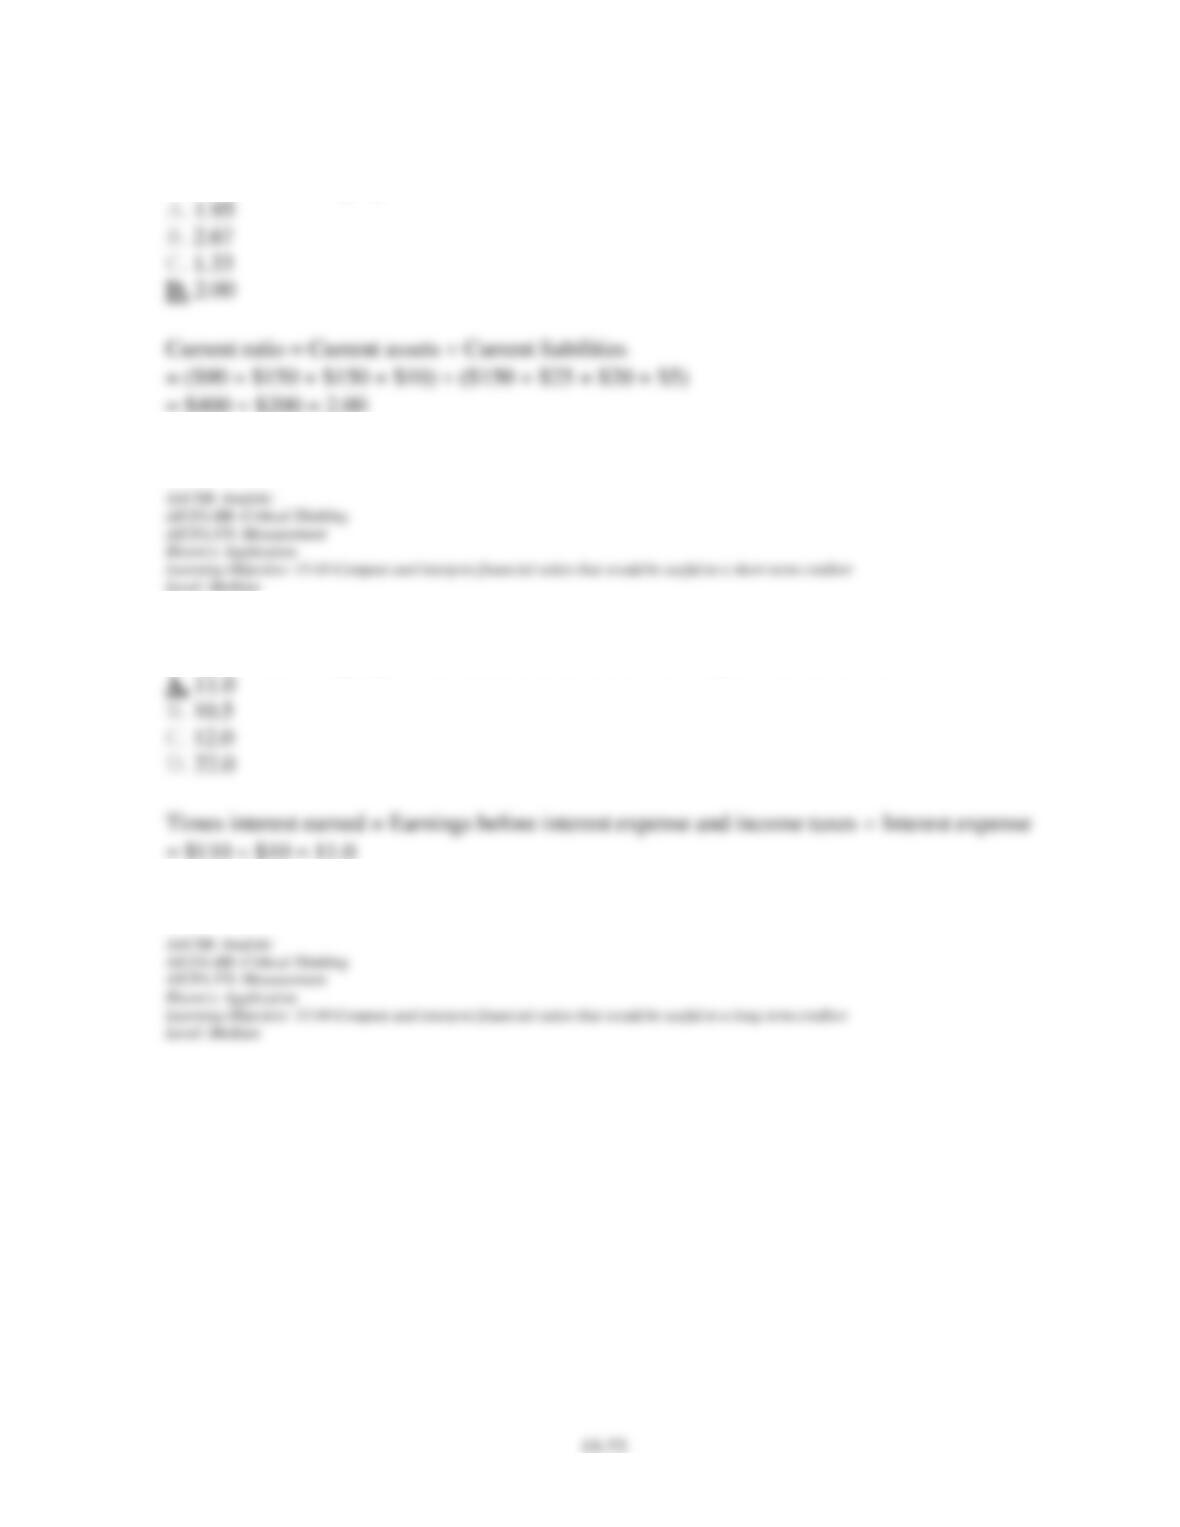
Financial statements for Harwich Company for the most recent year appear below:
The balances in the Cash, Accounts Receivable, Inventory, Bonds Payable, Common Stock,
and Additional Paid-In Capital accounts are unchanged from the beginning of the year. A
$0.75 per share dividend was declared and paid during the year. On December 31, Harwich
Company’s common stock was trading at $24.00 per share.
Chapter 15 – Financial Statement Analysis
107. Harwich Company’s current ratio at December 31 was closest to:
108. Harwich Company’s times interest earned ratio for the year was closest to:
Chapter 15 – Financial Statement Analysis
109. Harwich Company’s acid-test ratio at December 31 was closest to:
110. Harwich Company’s inventory turnover ratio for the year was closest to:
Chapter 15 – Financial Statement Analysis
111. Harwich Company’s average collection period for the year was closest to:
112. Harwich Company’s price-earnings ratio at December 31 was closest to:
Chapter 15 – Financial Statement Analysis
113. Harwich Company’s book value per share at December 31 was closest to:
114. Harwich Company’s dividend payout ratio for the year was closest to:
Chapter 15 – Financial Statement Analysis
115. Harwich Company’s debt-to-equity ratio at the end of the year was closest to:
116. Harwich Company’s dividend yield ratio for the year was closest to:
Chapter 15 – Financial Statement Analysis
15–77
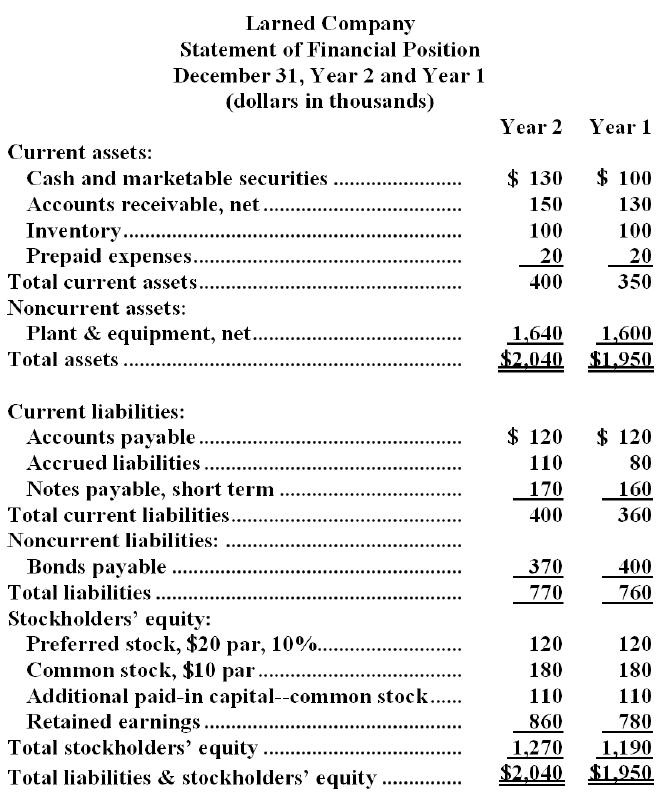
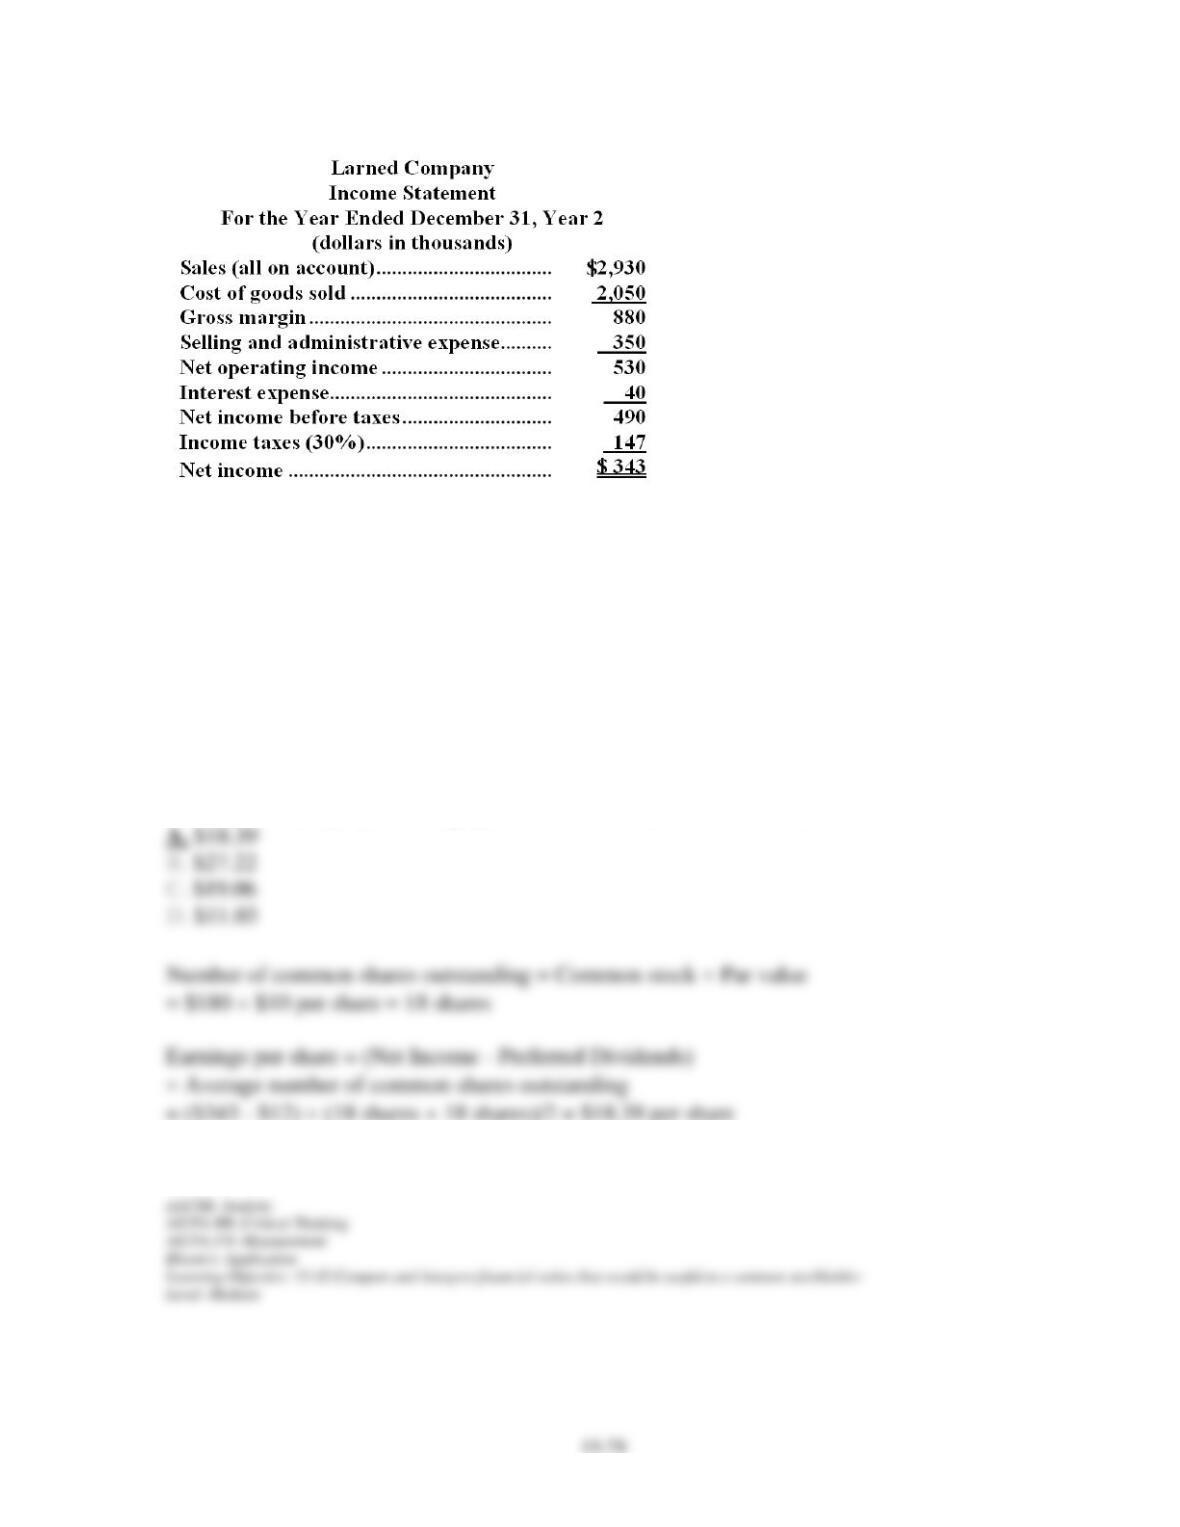
Financial statements for Larned Company appear below:
Chapter 15 – Financial Statement Analysis
Dividends during Year 2 totaled $263 thousand, of which $12 thousand were preferred
dividends.
The market price of a share of common stock on December 31, Year 2 was $160.
117. Larned Company’s earnings per share of common stock for Year 2 was closest to:
Chapter 15 – Financial Statement Analysis
118. Larned Company’s price-earnings ratio on December 31, Year 2 was closest to:
Chapter 15 – Financial Statement Analysis
119. Larned Company’s dividend payout ratio for Year 2 was closest to: