Chapter 15 – Financial Statement Analysis
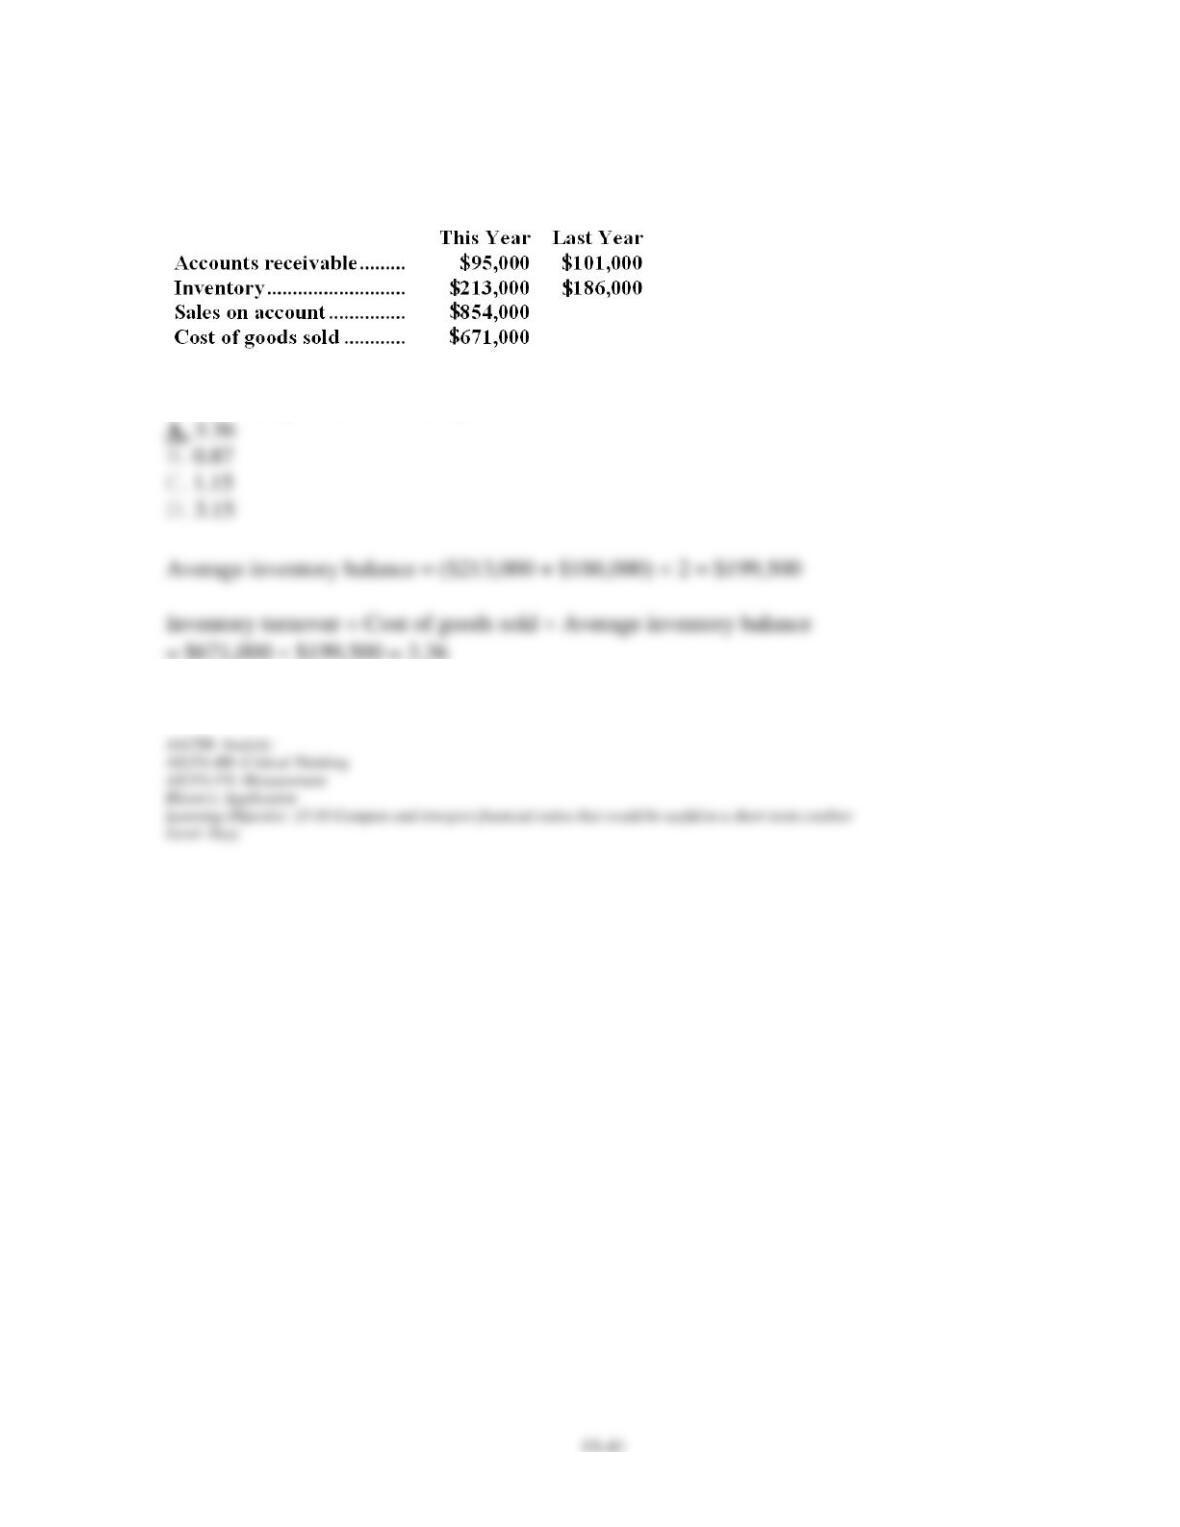
66. Kaelker Corporation has provided the following data:
The inventory turnover for this year is closest to:
Chapter 15 – Financial Statement Analysis
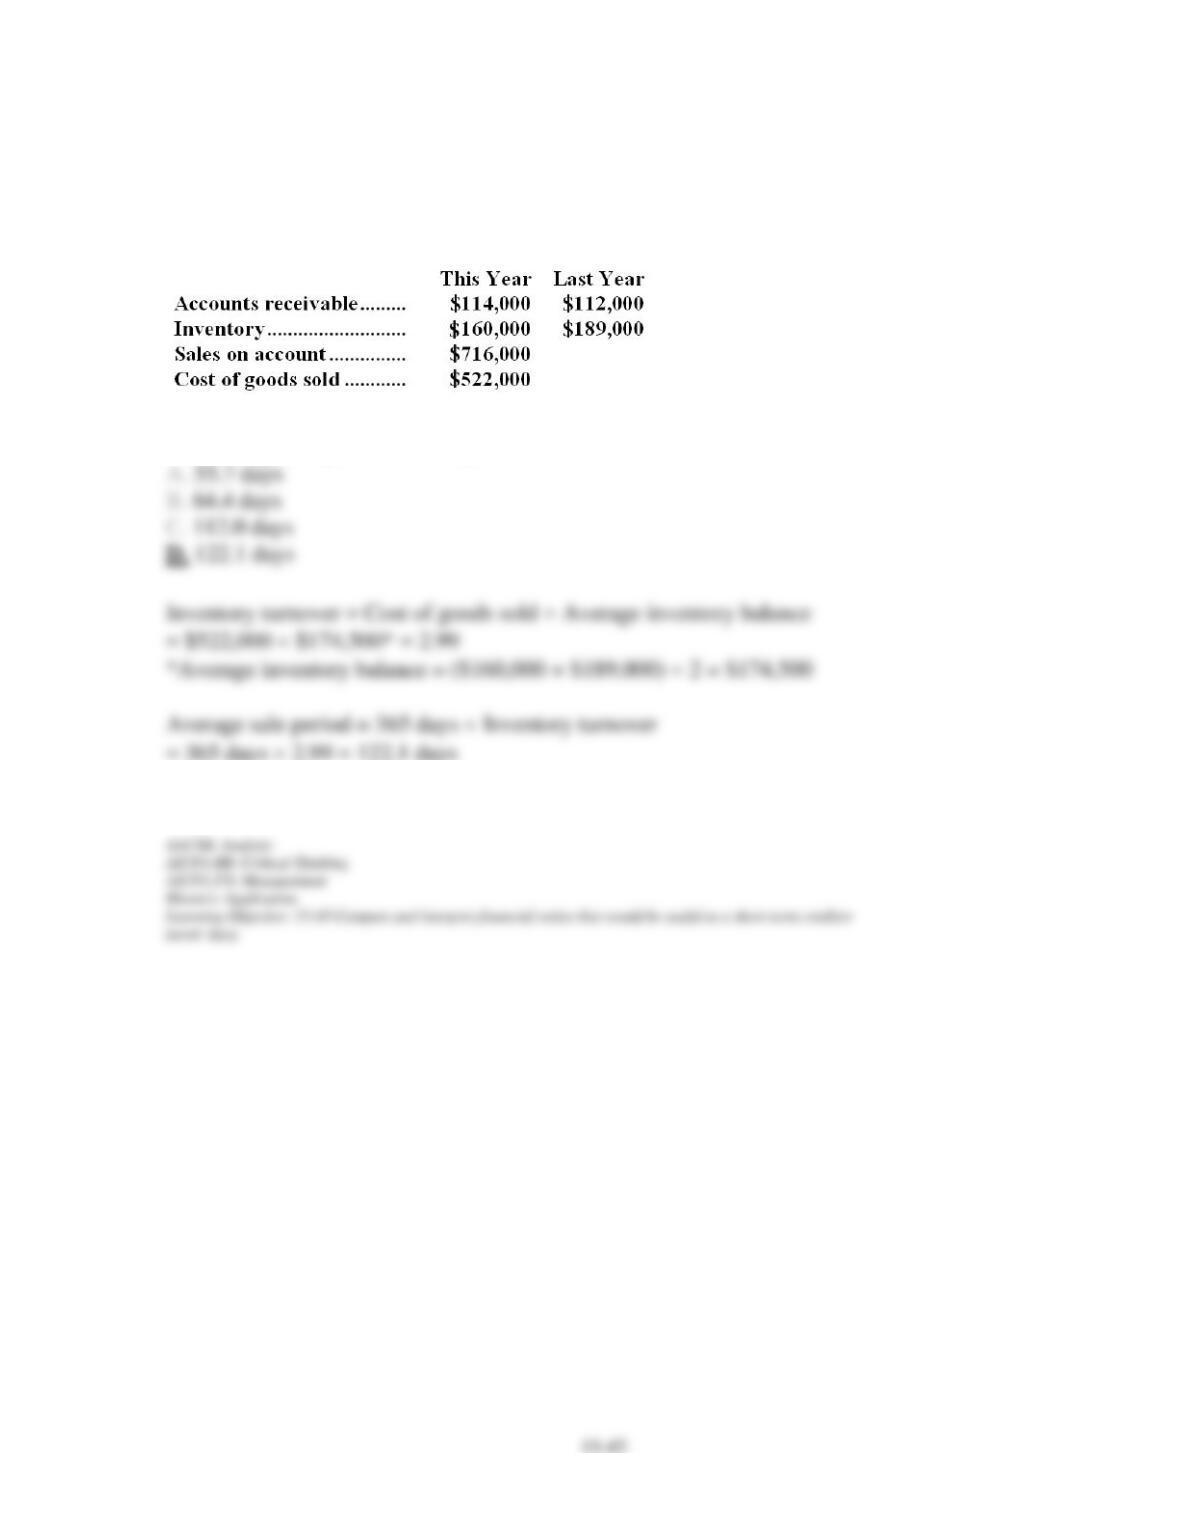
67. Data from Davoren Corporation’s most recent balance sheet and income statement appear
below:
The average sale period for this year is closest to:
Chapter 15 – Financial Statement Analysis
68. Last year Jason Company had a net income of $250,000, income tax expense of $78,000,
and interest expense of $30,000. The company’s times interest earned was closest to:
69. Jersey Corporation has total interest expense of $10,000, sales of $1 million, a tax rate of
40%, and net income (after taxes) of $60,000. What is this firm’s times interest earned ratio?
Chapter 15 – Financial Statement Analysis
70. Krast Company has total assets of $160,000 and total liabilities of $70,000. The
company’s debt-to-equity ratio is closest to:
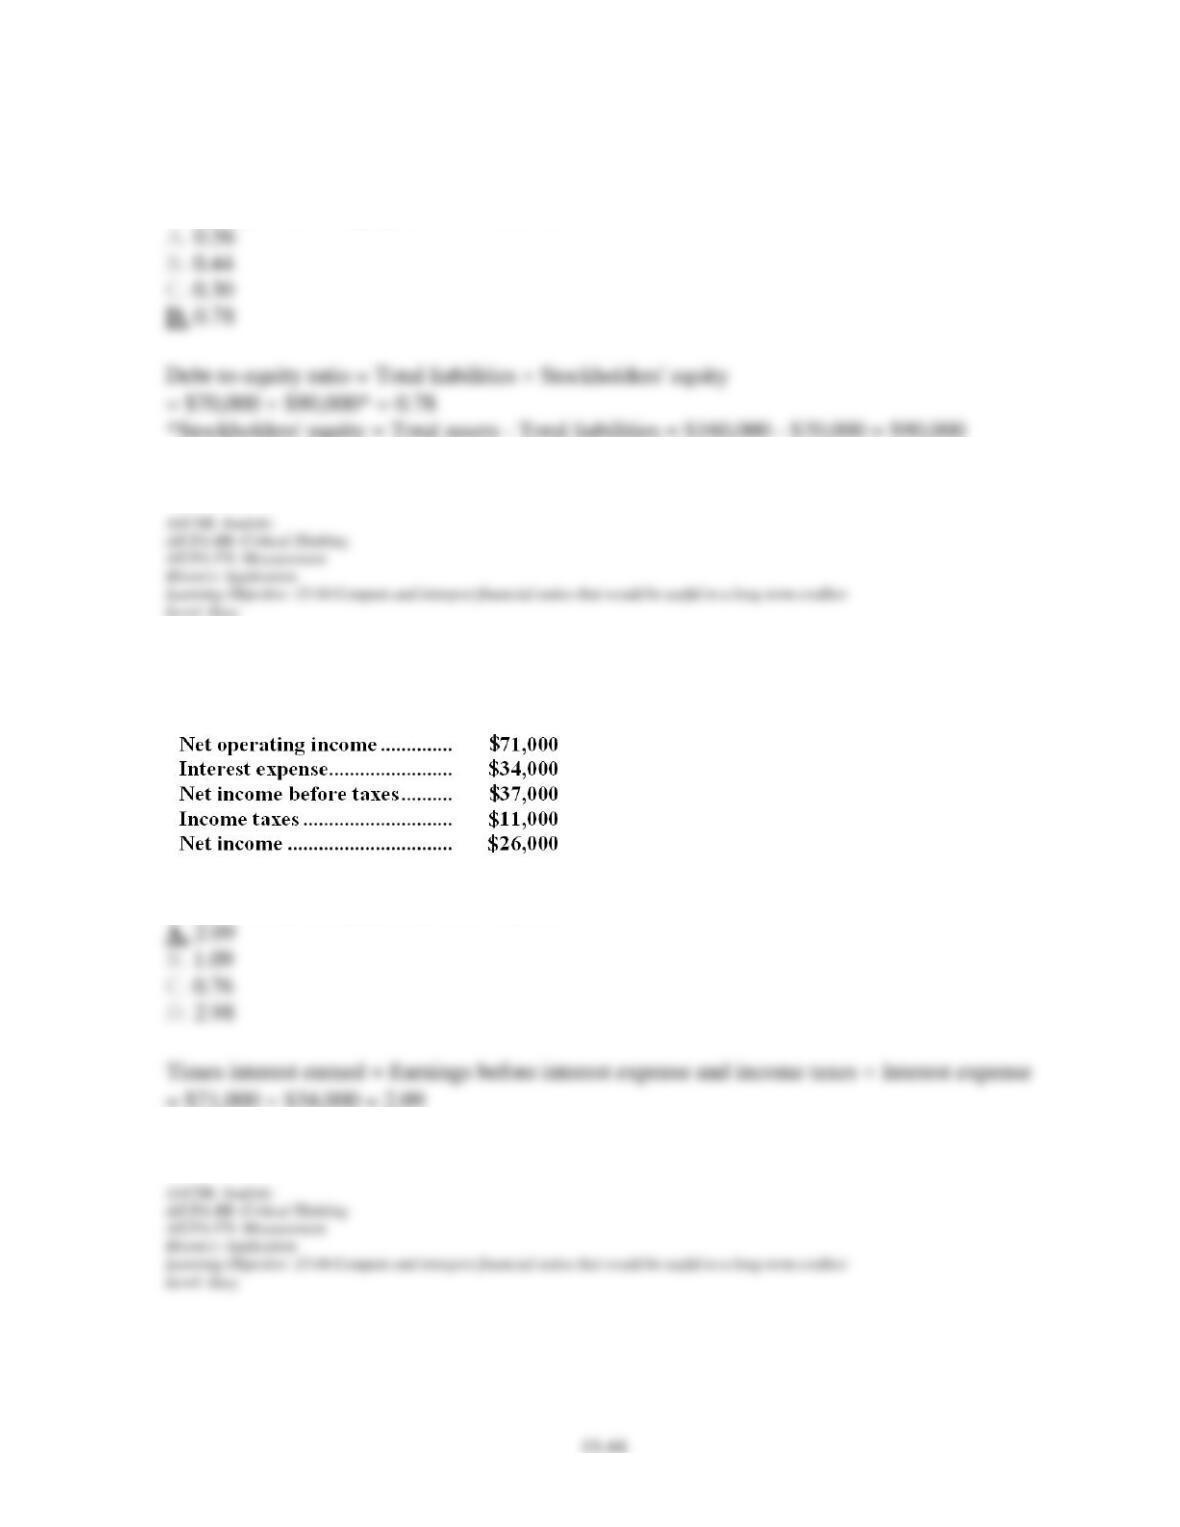
71. Pia Corporation has provided the following data from its most recent income statement:
The times interest earned ratio is closest to:
Chapter 15 – Financial Statement Analysis
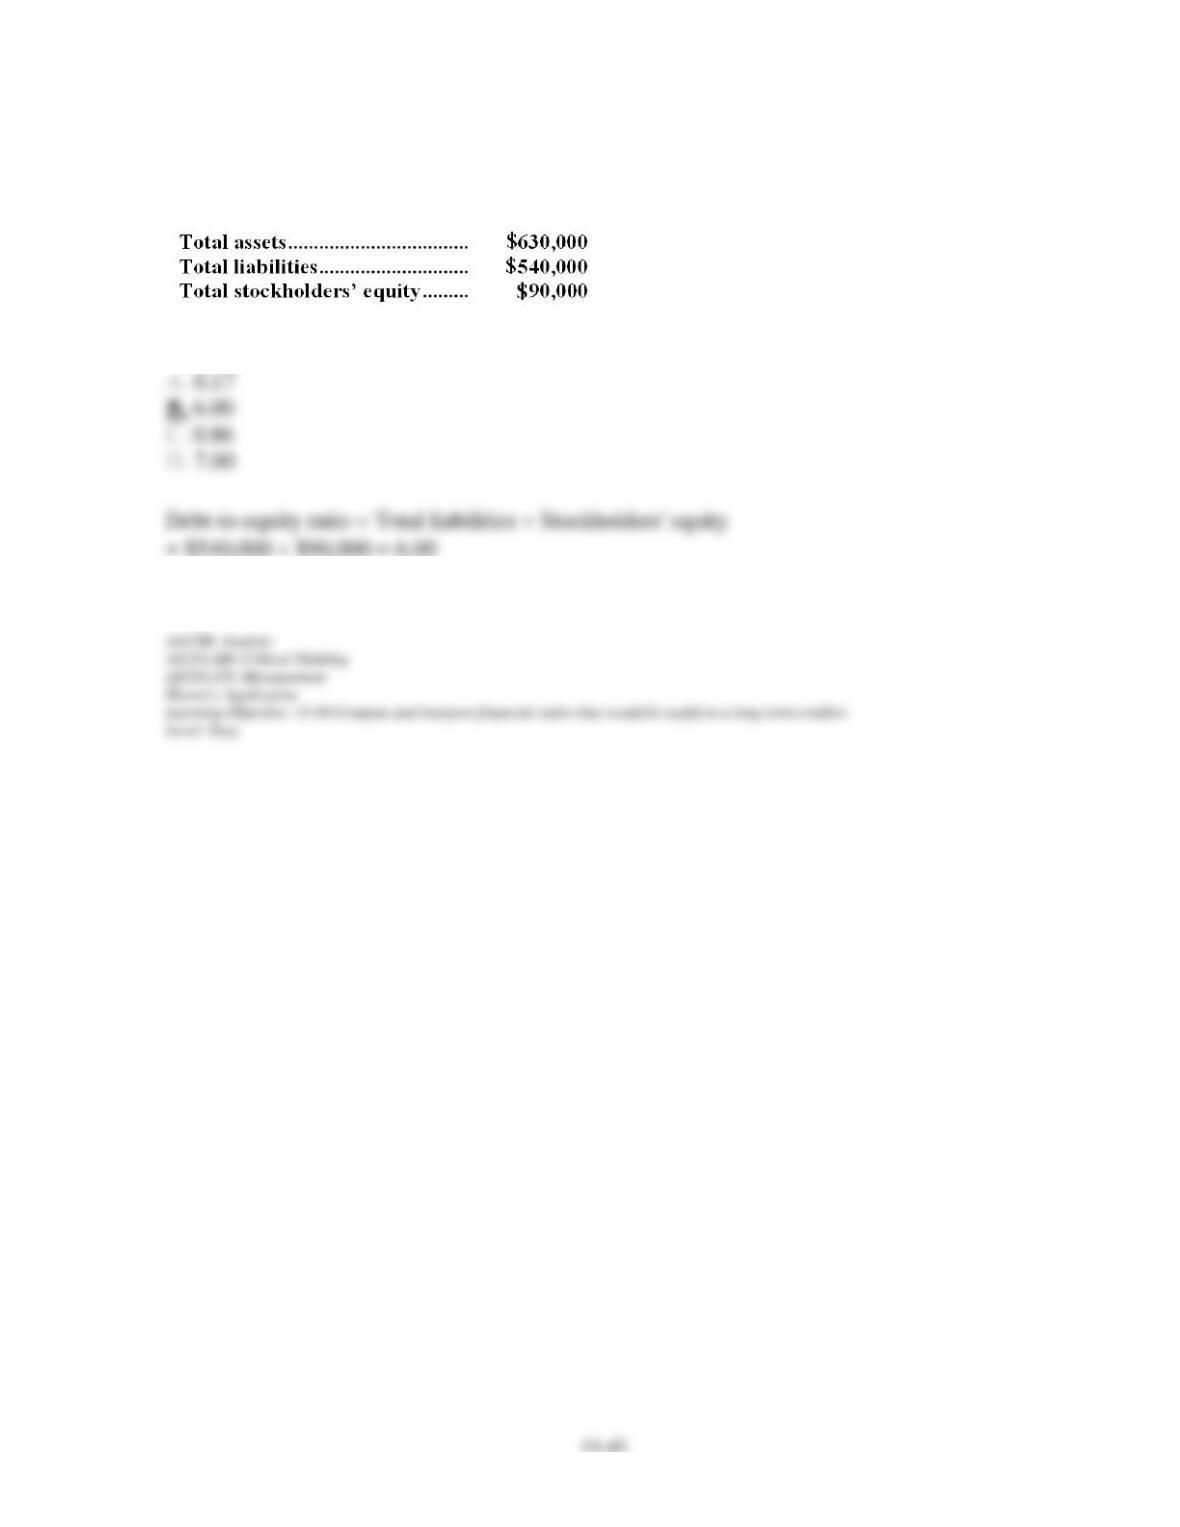
72. Damon Corporation has provided the following data from its most recent balance sheet:
The debt-to-equity ratio is closest to:
Chapter 15 – Financial Statement Analysis
15–46
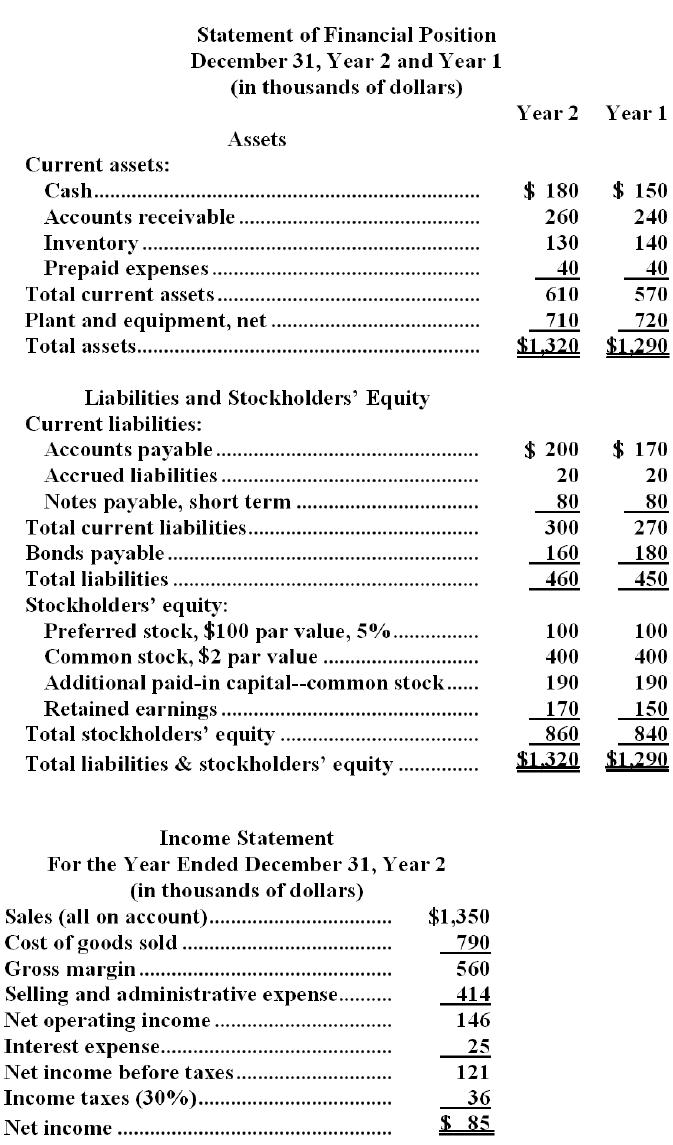
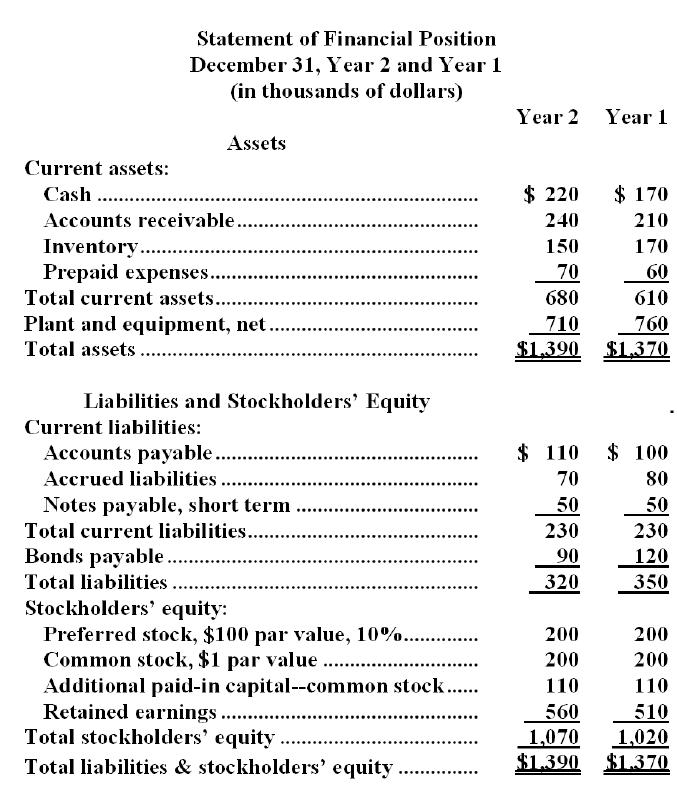
Hartzog Corporation’s most recent balance sheet and income statement appear below:
Dividends on common stock during Year 2 totaled $60 thousand. Dividends on preferred
Chapter 15 – Financial Statement Analysis
stock totaled $5 thousand. The market price of common stock at the end of Year 2 was $7.04
per share.
73. The gross margin percentage for Year 2 is closest to:
74. The earnings per share of common stock for Year 2 is closest to:
Chapter 15 – Financial Statement Analysis
75. The price-earnings ratio for Year 2 is closest to:
Chapter 15 – Financial Statement Analysis
76. The dividend payout ratio for Year 2 is closest to:
Chapter 15 – Financial Statement Analysis
77. The dividend yield ratio for Year 2 is closest to:
78. The return on total assets for Year 2 is closest to:
Chapter 15 – Financial Statement Analysis
79. The return on common stockholders’ equity for Year 2 is closest to:
80. The book value per share at the end of Year 2 is closest to:
Chapter 15 – Financial Statement Analysis
81. The working capital at the end of Year 2 is:
82. The current ratio at the end of Year 2 is closest to:
Chapter 15 – Financial Statement Analysis
83. The acid-test ratio at the end of Year 2 is closest to:
84. The accounts receivable turnover for Year 2 is closest to:
Chapter 15 – Financial Statement Analysis
85. The average collection period for Year 2 is closest to:
86. The inventory turnover for Year 2 is closest to:
Chapter 15 – Financial Statement Analysis
87. The average sale period for Year 2 is closest to:
88. The times interest earned for Year 2 is closest to:
Chapter 15 – Financial Statement Analysis
89. The debt-to-equity ratio at the end of Year 2 is closest to:
Chapter 15 – Financial Statement Analysis
15–57
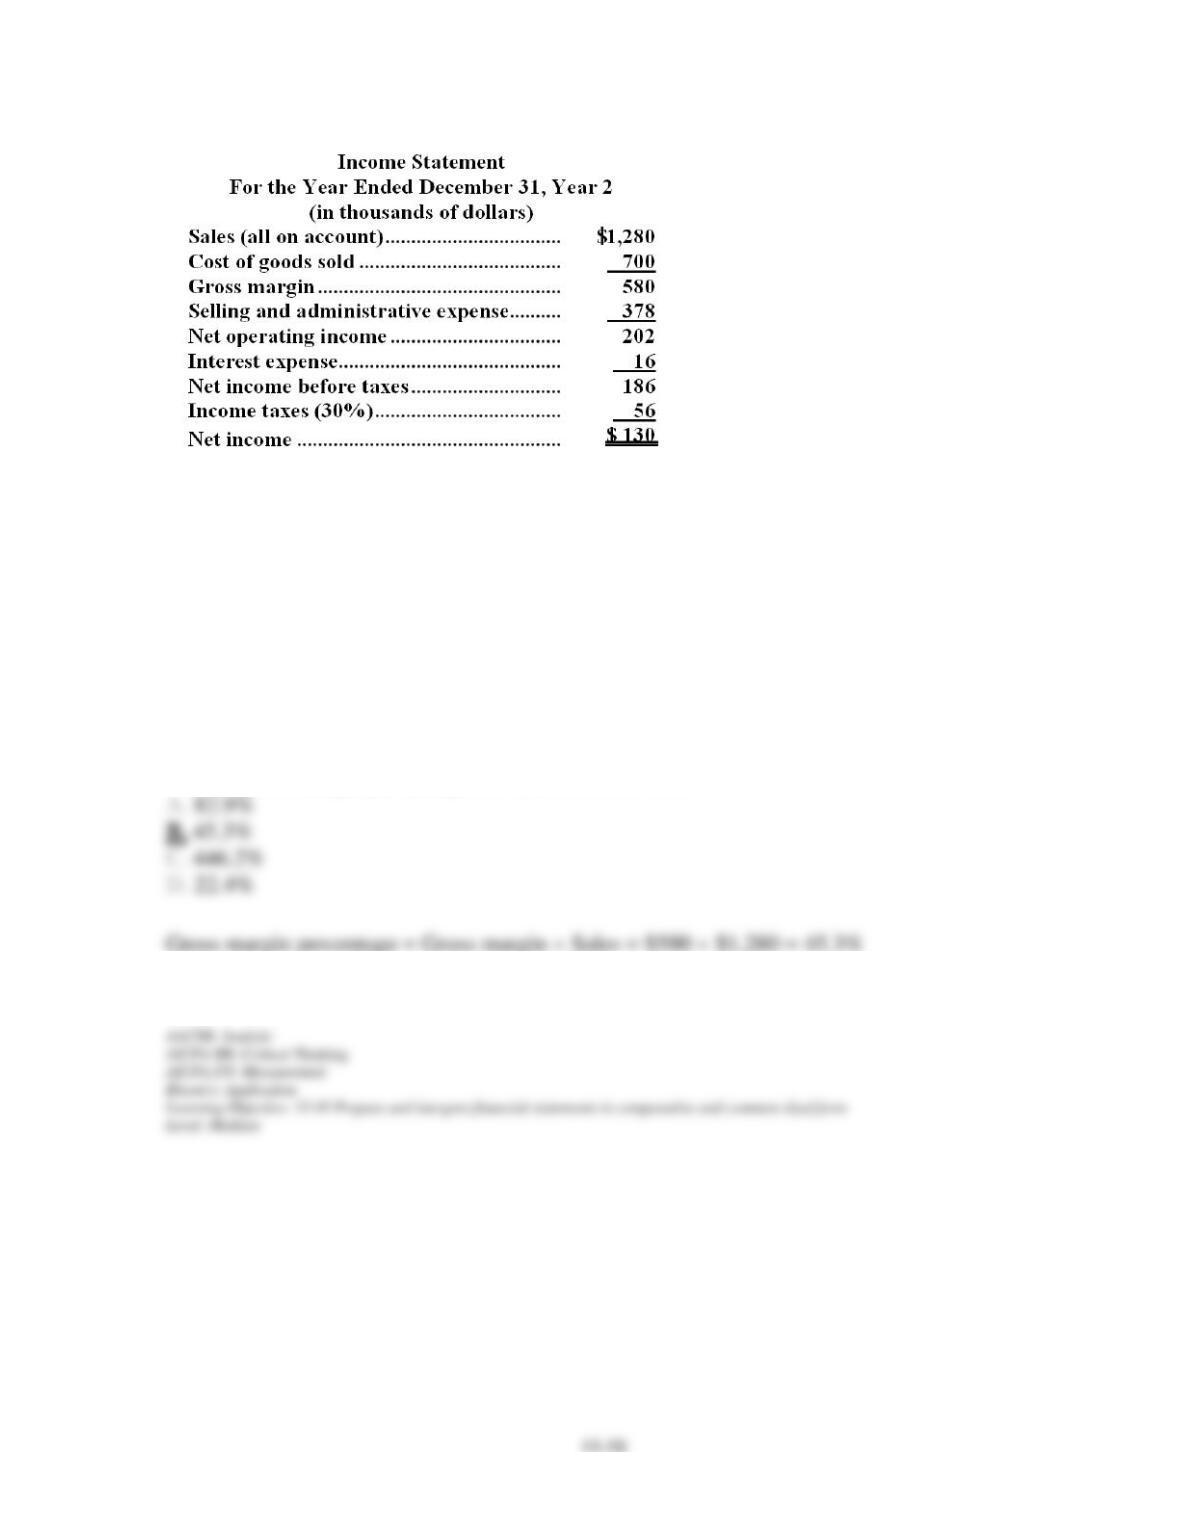
Hick Corporation’s most recent balance sheet and income statement appear below:
Chapter 15 – Financial Statement Analysis
Dividends on common stock during Year 2 totaled $60 thousand. Dividends on preferred
stock totaled $20 thousand. The market price of common stock at the end of Year 2 was $9.57
per share.
90. The gross margin percentage for Year 2 is closest to:
Chapter 15 – Financial Statement Analysis
91. The earnings per share of common stock for Year 2 is closest to:
Chapter 15 – Financial Statement Analysis
92. The price-earnings ratio for Year 2 is closest to: