9) Refer to Figure 15-1. The firm’s profit-maximizing price is
A) P1.
B) P2.
C) P3.
D) P4.
10) Refer to Figure 15-1. If the firm’s average total cost curve is ATC1, the firm will
A) suffer a loss.
B) break even.
C) make a profit.
D) face competition.
11) Refer to Figure 15-1. If the firm’s average total cost curve is ATC2, the firm will
A) suffer a loss.
B) break even.
C) make a profit.
D) face competition.
12) Refer to Figure 15-1. If the firm’s average total cost curve is ATC3, the firm will
A) suffer a loss.
B) break even.
C) make a profit.
D) face competition.
13) If a firm’s average total cost is less than price where MR=MC,
A) the firm should shut down.
B) the firm should raise its price.
C) the firm should continue to produce the output it is producing.
D) the firm should cut back on its output to lower its cost.
Table 15-1
Price per Unit
Quantity
Demanded
(units)
Total Cost of
Production
(dollars)
$85
10
$530
80
11
540
75
12
550
70
13
560
65
14
575
60
15
595
55
16
625
A monopoly producer of foreign language translation software faces a demand and cost structure
as given in Table 15-1.
14) Refer to Table 15-1. What is the marginal revenue from the sale of the 12th unit?
A) $75
B) $50
C) $20
D) -$5
15) Refer to Table 15-1. What is the firm’s profit-maximizing output and what is the price
charged to sell this output?
A) P = $85; Q = 10
B) P = $80; Q = 11
C) P = $70; Q = 13
D) P = $65; Q = 14
16) Refer to Table 15-1. What is the amount of the firm’s profit?
A) $335
B) $350
C) $880
D) $910
17) Which of the following statements applies to a monopolist but not to a perfectly competitive
firm at their profit maximizing outputs?
A) Marginal revenue is less than price.
B) Marginal revenue equals marginal cost.
C) Price equals marginal cost.
D) Average revenue equals average cost.
18) Long-run economic profits would most likely exist in which market structure?
A) monopoly, monopolistic competition and oligopoly
B) monopoly and oligopoly
C) monopoly and monopolistic competition
D) monopoly only
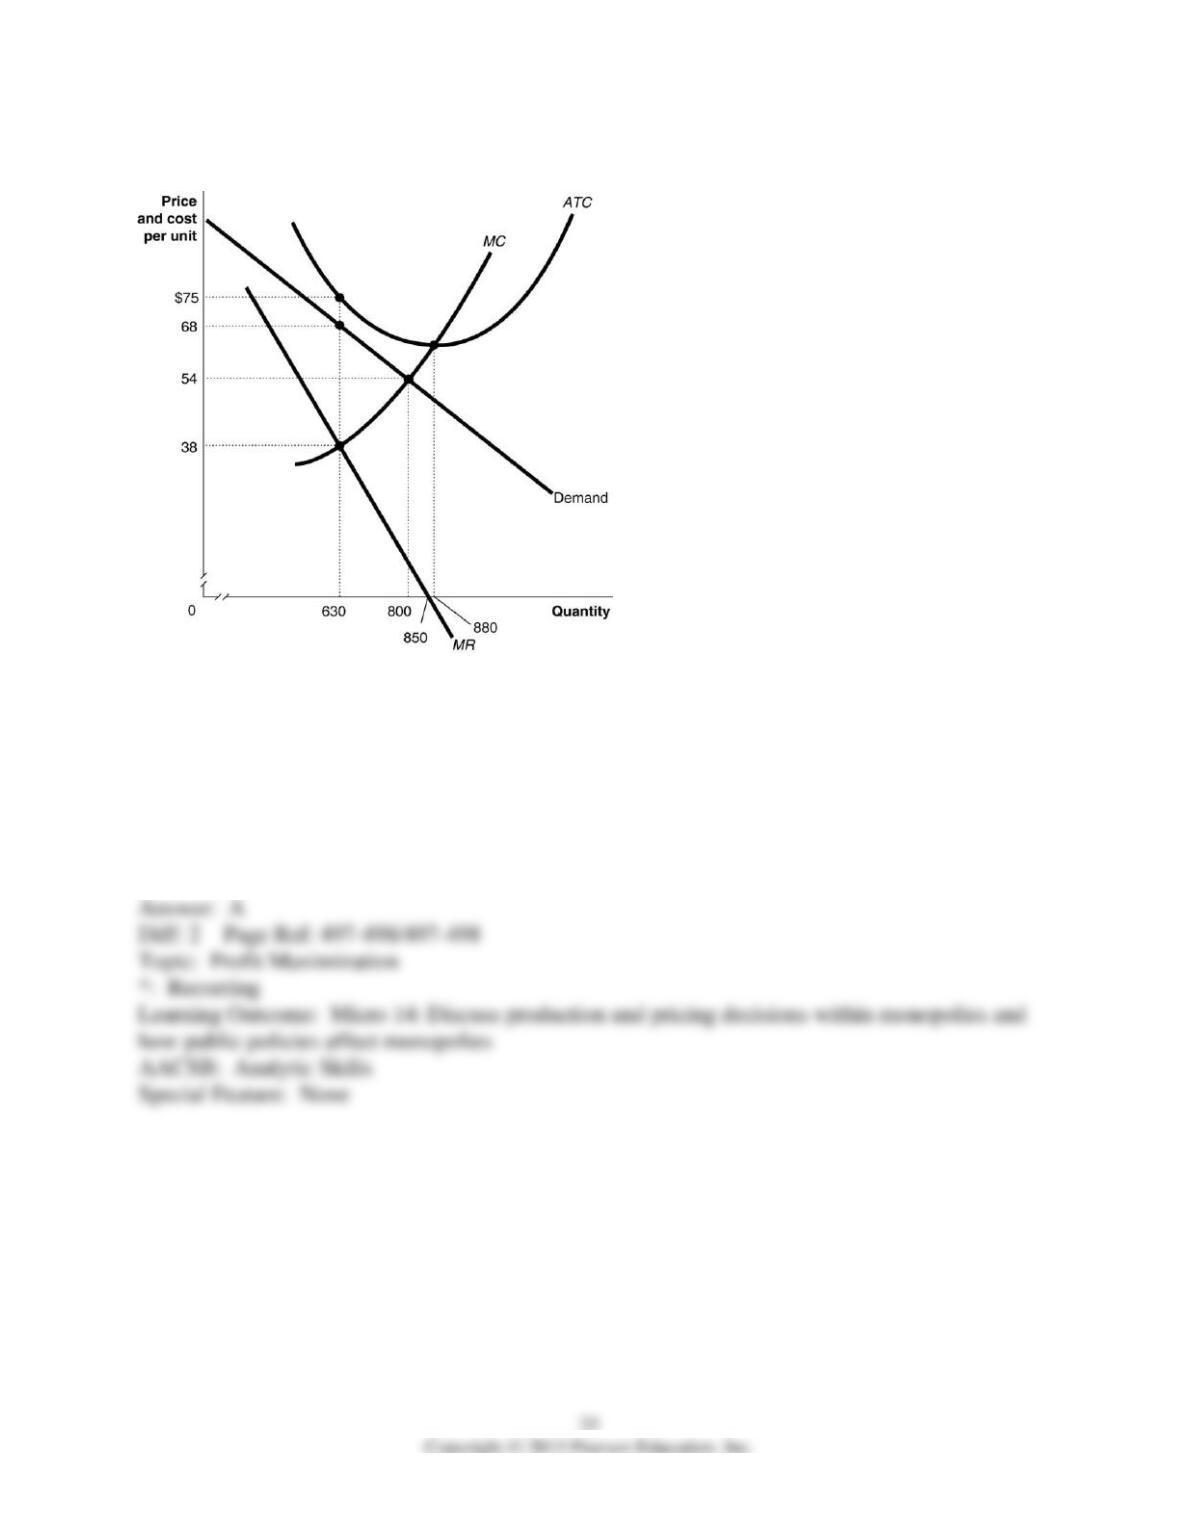
Figure 15-2
Figure 15-2 above shows the demand and cost curves facing a monopolist.
19) Refer to Figure 15-2. Suppose the monopolist represented in the diagram above produces
positive output. What is the profit-maximizing/loss-minimizing output level?
A) 630 units
B) 800 units
C) 850 units
D) 880 units
20) Refer to Figure 15-2. Suppose the monopolist represented in the diagram above produces
positive output. What is the price charged at the profit-maximizing/loss-minimizing output
level?
A) $38
B) $54
C) $68
D) $75
21) Refer to Figure 15-2. Suppose the monopolist represented in the diagram above produces
positive output. What is the profit/loss per unit?
A) loss of $7 per unit
B) profit of $30 per unit
C) loss of $21 per unit
D) profit of $14 per unit
22) Refer to Figure 15-2. What happens to the monopolist represented in the diagram in the
long run?
A) It will raise its price at least until it breaks even.
B) If the cost and demand curves remain the same, it will exit the market.
C) The government will subsidize the monopoly to enable it to break even.
D) It will be forced out of business by more efficient producers.
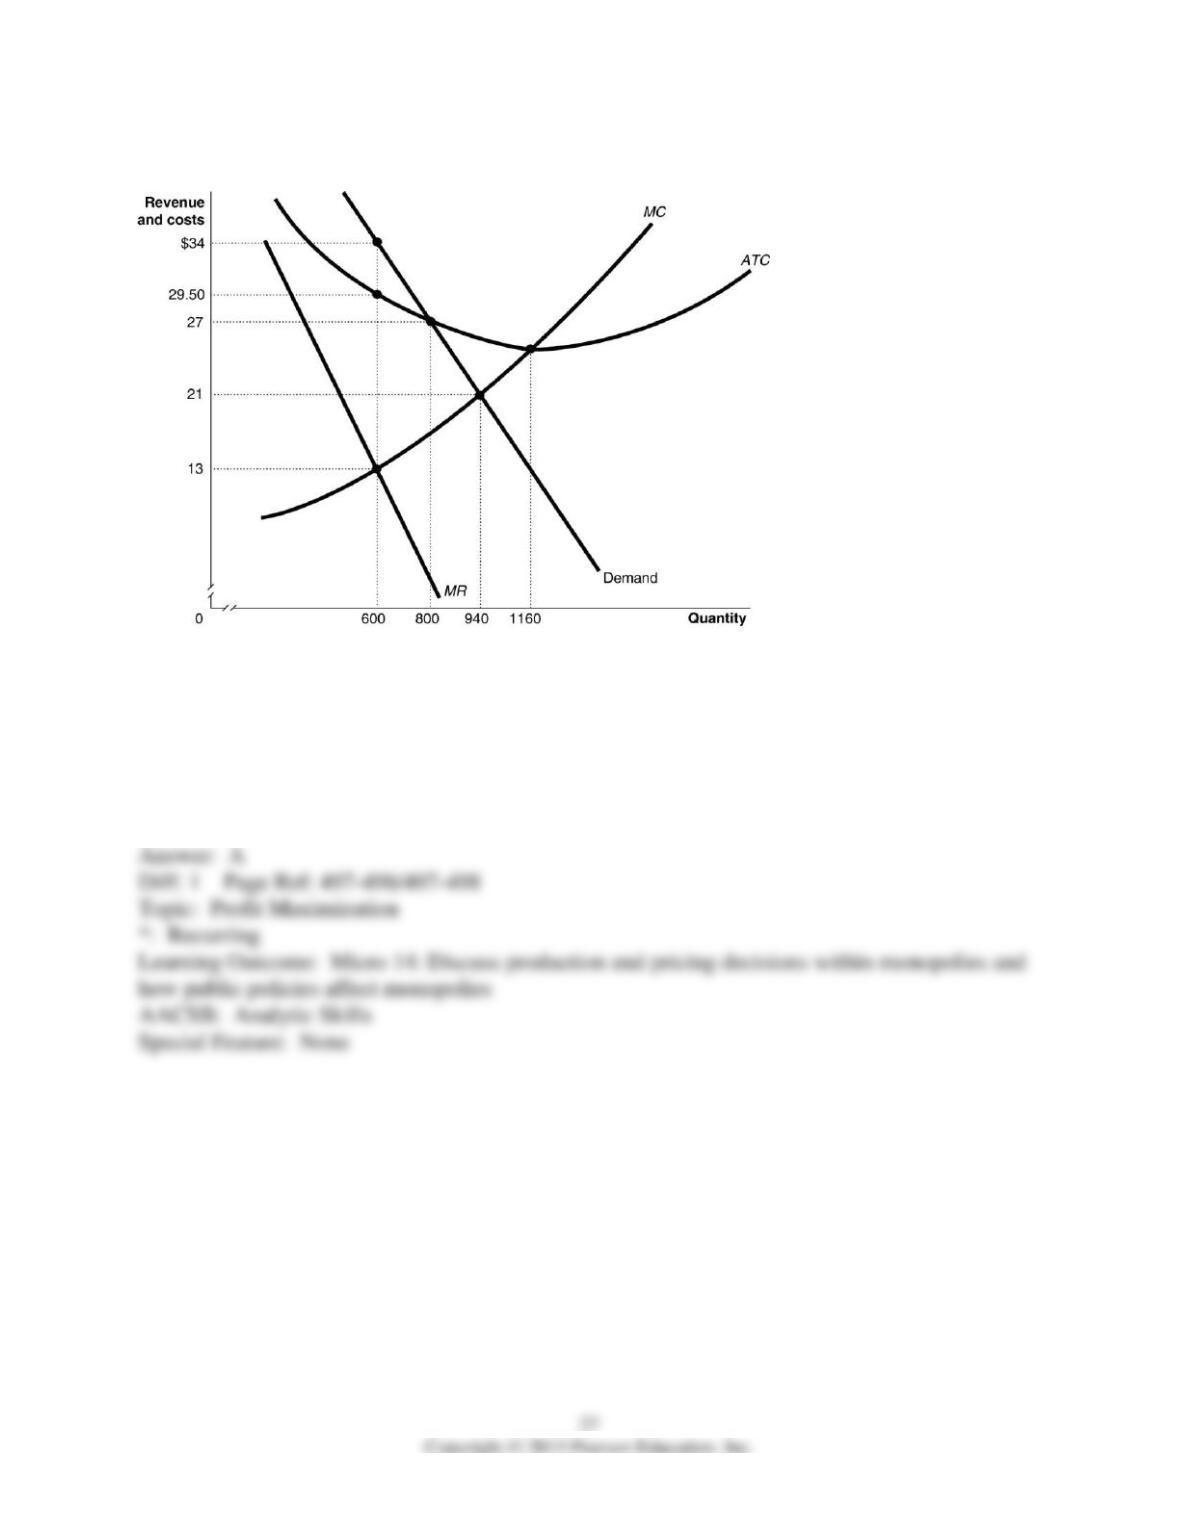
Figure 15-3
Figure 15-3 shows the demand and cost curves for a monopolist.
23) Refer to Figure 15-3. What is the profit-maximizing/loss-minimizing output level?
A) 600 units
B) 800 units
C) 940 units
D) 1,160 units
24) Refer to Figure 15-3. What is the price charged for the profit-maximizing output level?
A) $13
B) $21
C) $27
D) $34
25) Refer to Figure 15-3. What is the amount of the monopoly’s total revenue?
A) $21,600
B) $20,400
C) $19,740
D) $7,800
26) Refer to Figure 15-3. What is the amount of the monopoly’s total cost of production?
A) $21,600
B) $17,700
C) $9,340
D) $7,800
27) Refer to Figure 15-3. What is the amount of the monopoly’s profit?
A) $2,700
B) $4,200
C) $10,400
D) $12,600
28) Refer to Figure 15-3. What is likely to happen to this monopoly in the long run?
A) New firms will enter the market to eliminate its profits.
B) It will expand its output to take advantage of economies of scale so as to further increase its
profit.
C) As long as there are entry barriers, this firm will continue to enjoy economic profits.
D) It will be regulated by the government because of its excess profits.
29) If a monopolist’s price is $50 at the output where marginal revenue equals marginal cost and
average total cost is $43, then the average profit is $7.
30) If a monopolist’s marginal revenue is $15 per unit and its marginal cost is $25, then to
maximize profit the firm should decrease output.
31) In the short-run, even if a monopoly’s total revenue does not cover its variable costs, it
should continue to produce because ultimately in the long run, the monopoly will start earning
profits.
32) To maximize profit, a monopolist will produce and sell a quantity such that for the last unit
sold, marginal revenue equals marginal cost, and charges a price given by the demand curve at
that output level.
33) What is the relationship between marginal revenue and average revenue for a monopolist and
is it the same for a perfect competitor?
34) What happens to a monopoly’s revenue when it sells more units of its product?
35) Explain why the monopolist has no supply curve?
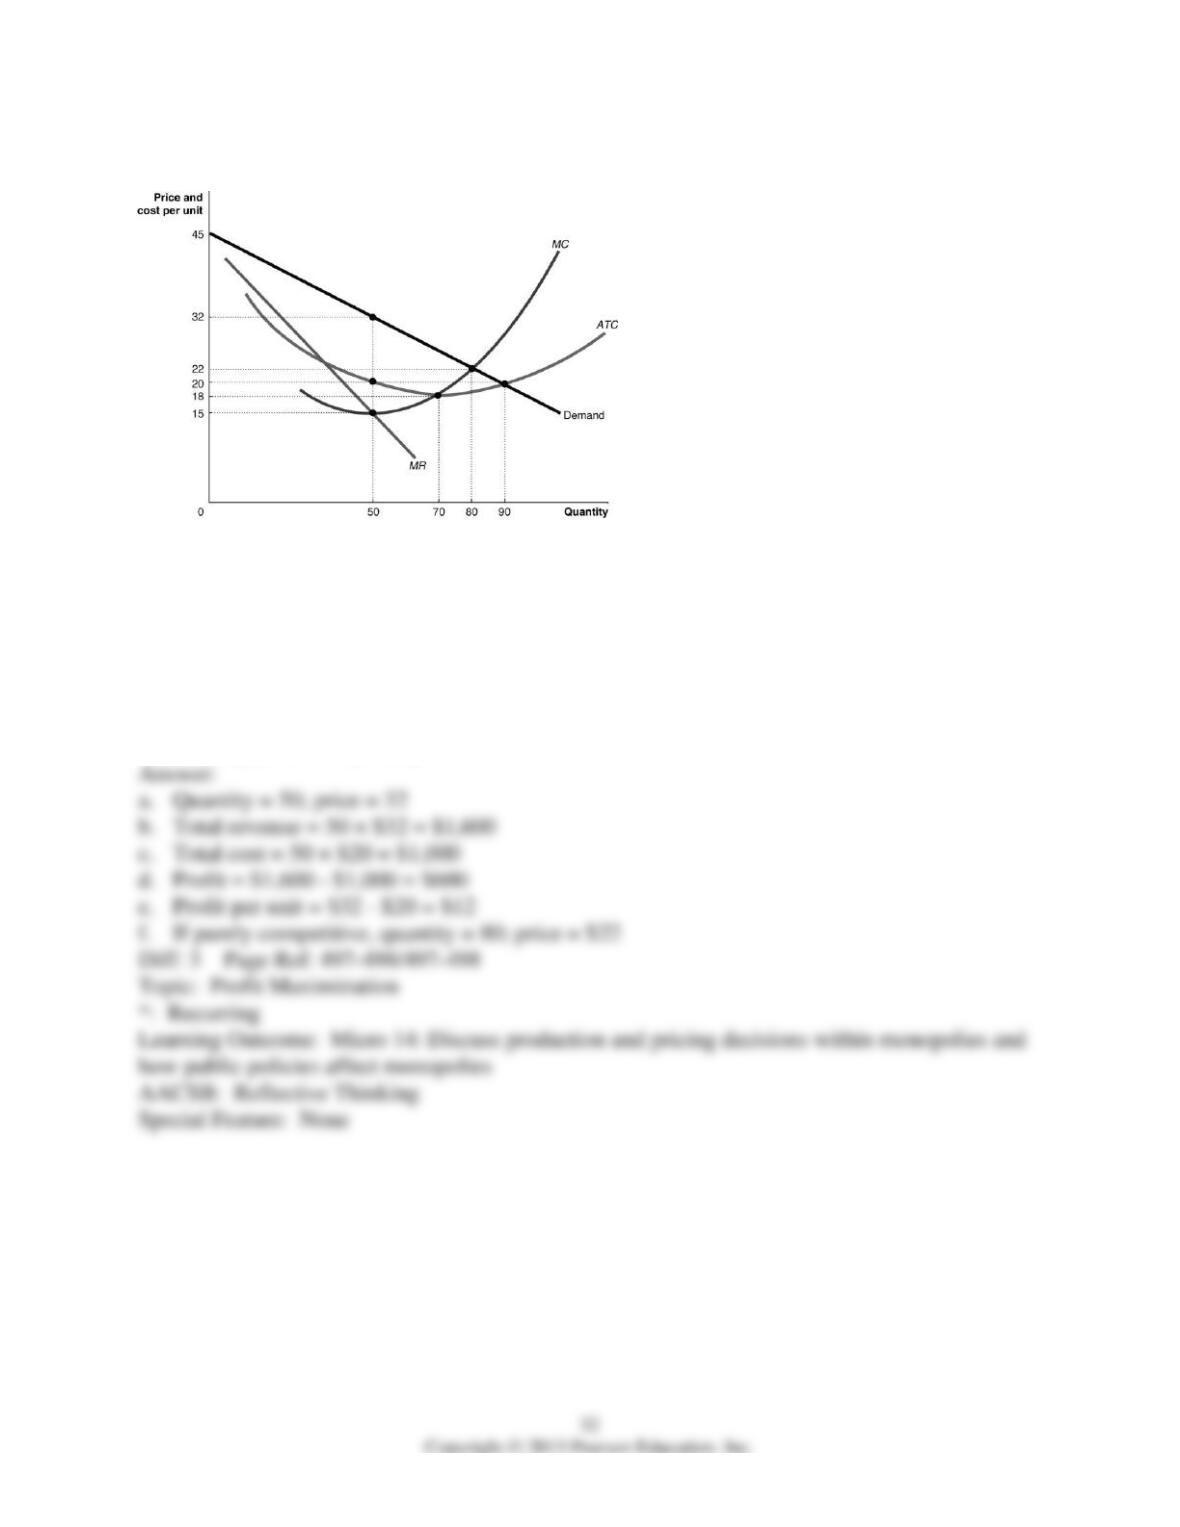
Figure 15-4
36) Refer to Figure 15-4. Use the figure above to answer the following questions.
a. What is the profit-maximizing quantity and what price will the monopolist charge?
b. What is the total revenue at the profit-maximizing output level?
c. What is the total cost at the profit-maximizing output level?
d. What is the profit?
e. What is the profit per unit (average profit) at the profit-maximizing output level?
f. If this industry was organized as a perfectly competitive industry, what would be the profit-
maximizing price and quantity?
15.4 Does Monopoly Reduce Economic Efficiency?
1) Economic efficiency in a free market occurs when
A) consumer surplus is maximized.
B) producer surplus is maximized.
C) the sum of consumer surplus and producer surplus is maximized.
D) price is as low as possible.
2) A profit maximizing monopoly’s price is
A) the same as the price that would prevail if the industry was perfectly competitive.
B) less than the price that would prevail if the industry was perfectly competitive.
C) greater than the price that would prevail if the industry was perfectly competitive.
D) not consistently related to price that would prevail if the market was perfectly competitive.
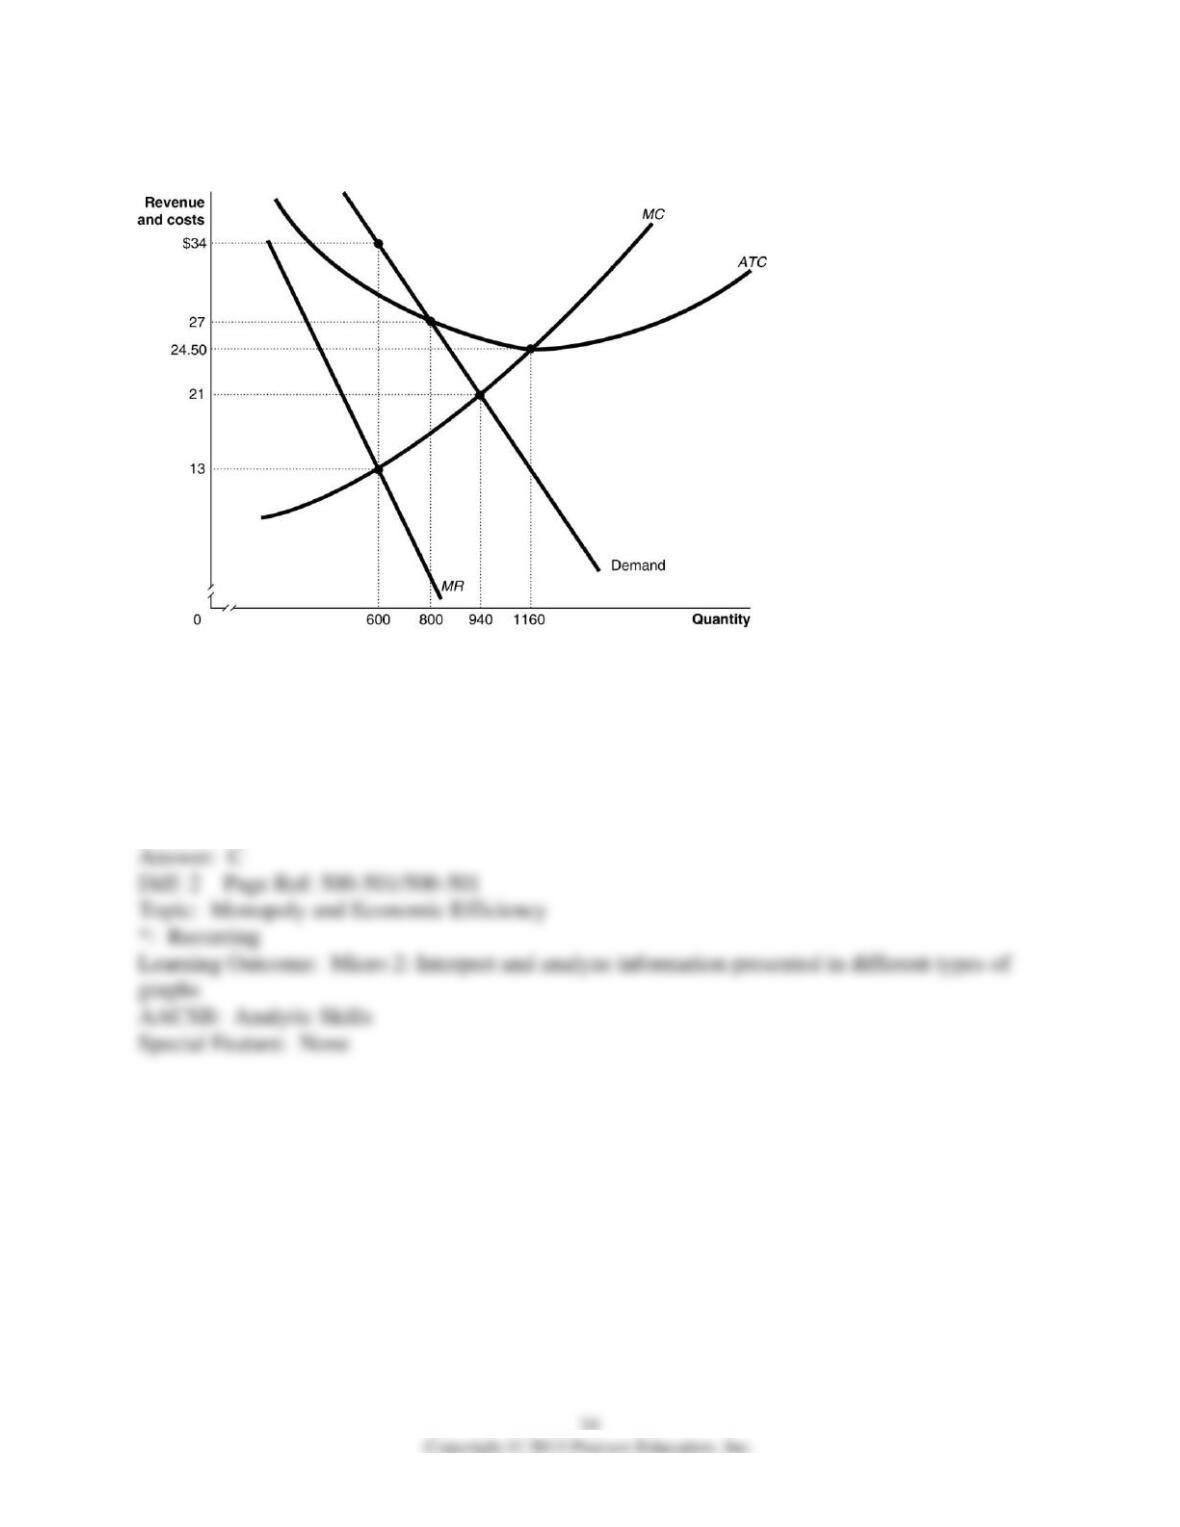
Figure 15-5
Figure 15-5 shows the demand and cost curves for a monopolist.
3) Refer to Figure 15-5. What is the economically efficient output level?
A) 600 units
B) 800 units
C) 940 units
D) 1160 units
4) Refer to Figure 15-5. What is the difference between the monopoly output and the perfectly
competitive output?
A) 140 units
B) 240 units
C) 340 units
D) 560 units
5) Refer to Figure 15-5. What is the difference between the monopoly’s price and perfectly
competitive industry’s price?
A) The monopoly’s price is higher by $9.50.
B) The monopoly’s price is higher by $13.
C) The monopoly’s price is higher by $3.50.
D) The monopoly’s price is higher by $21.
6) Refer to Figure 15-5. At the profit-maximizing quantity, what is the difference between the
monopoly’s price and the marginal cost of production?
A) $8
B) $11.50
C) $21
D) There is no difference.
7) Compared to perfect competition, the consumer surplus in a monopoly
A) is unchanged because price and output are the same.
B) is lower because price is higher and output is lower.
C) is higher because price is higher and output is the same.
D) is eliminated.
8) Why does a monopoly cause a deadweight loss?
A) because it does not produce some output for which marginal benefit exceeds marginal cost
B) because it appropriates a portion of consumer surplus for itself
C) because it increases producer surplus at the expense of consumer surplus
D) because it does not produce some output for which demand exceeds supply
9) Relative to a perfectly competitive market, a monopoly results in
A) a gain in producer surplus equal to the gain in consumer surplus.
B) a gain in producer surplus equal to the loss in consumer surplus.
C) a gain in producer surplus less than the loss in consumer surplus.
D) greater economic efficiency.
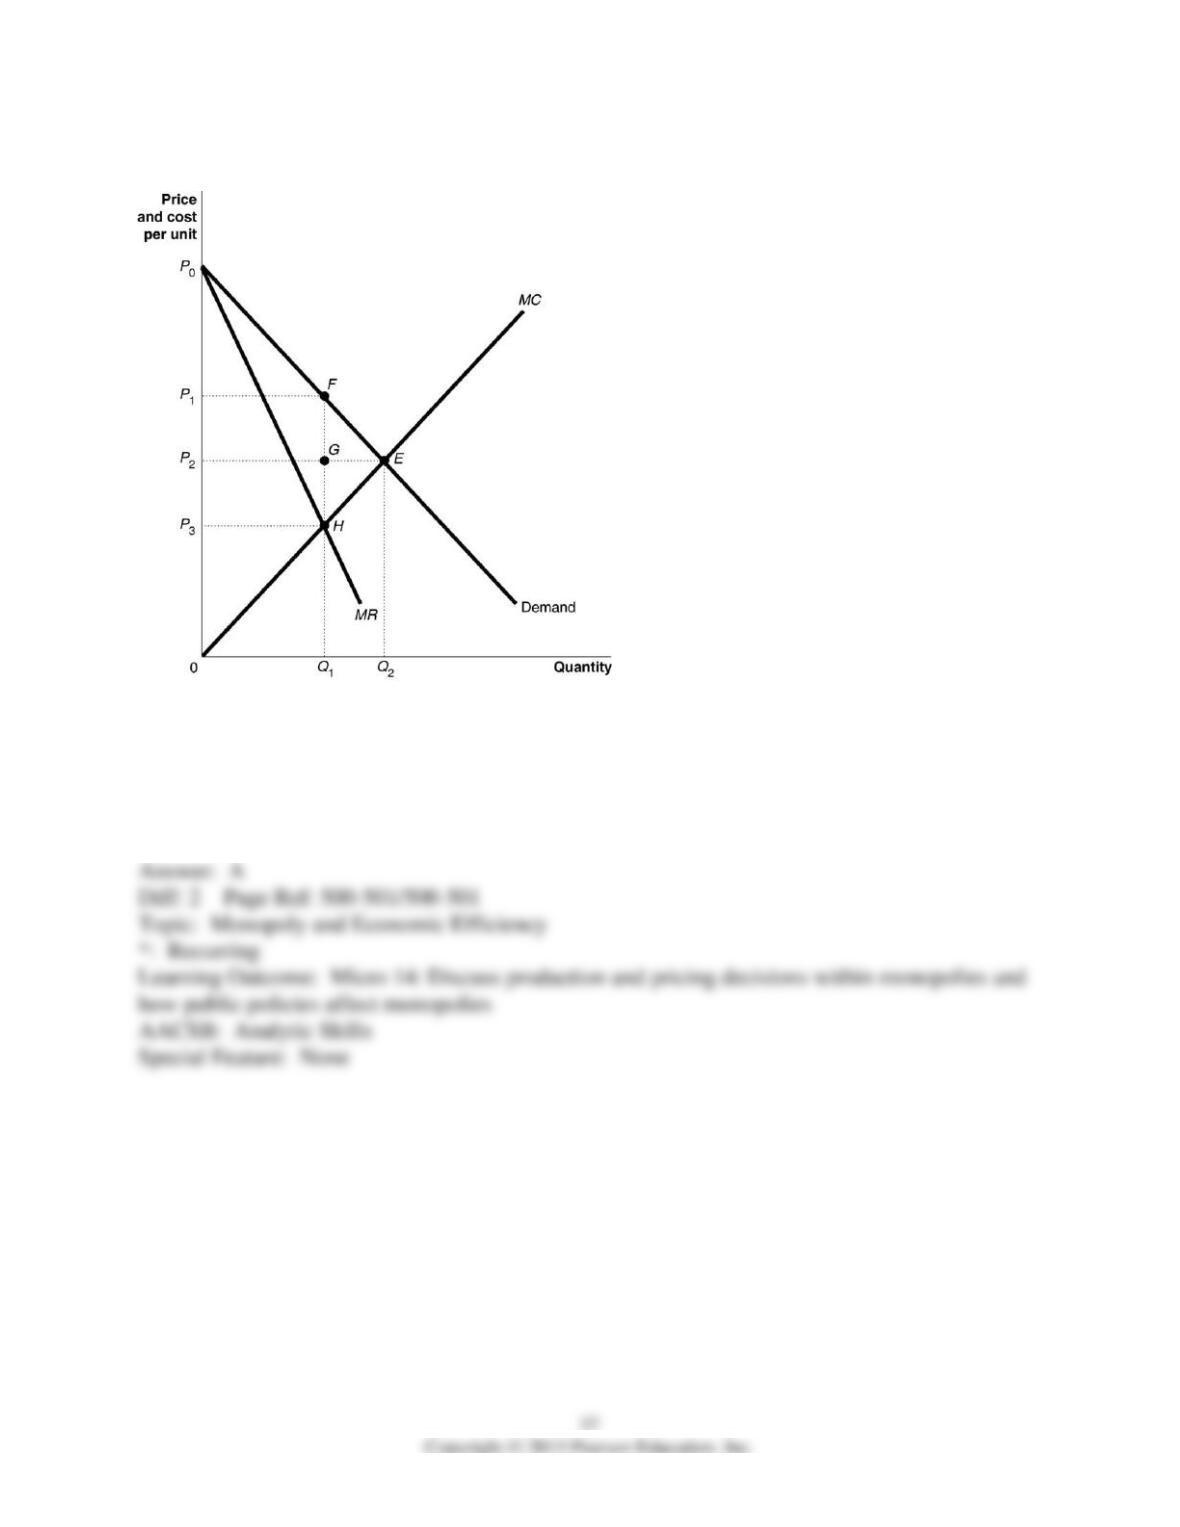
Figure 15-6
10) Refer to Figure 15-6. What is the area that represents consumer surplus under a monopoly?
A) the triangle P0P1F
B) the triangle P0P2E
C) the trapezium P1P2EF
D) the rectangle P1P3HF
11) Refer to Figure 15-6. Compared to a perfectly competitive market, consumer surplus is
lower in a monopoly by an amount equal to the
A) area FHE.
B) area FGE.
C) area P1P2EF.
D) area P1P2GF.
12) Refer to Figure 15-6. What is the area that represents producer surplus under a monopoly?
A) the triangle 0P2E
B) the triangle 0P3H
C) the trapezium 0P1FH
D) the rectangle P1P3HF
13) Refer to Figure 15-6. The deadweight loss due to a monopoly is represented by the area
A) FHE.
B) FGE.
C) GEH.
D) FQ1Q2E.
Table 15-2
Price per
Dose
Quantity
Demanded
(dose)
Total Cost of
Production
(dollars)
$80
0
$80
72
1
82
64
2
88
56
3
100
48
4
124
40
5
164
32
6
208
24
7
268
16
8
340
Shakti Inc. has been granted a patent for its Arnica toothache balm. Table 15-2 shows the
demand and the total cost schedule for the firm.
14) Refer to Table 15-2. What is Shakti’s profit-maximizing output?
A) 4 units
B) 5 units
C) 6 units
D) 7 units
15) Refer to Table 15-2. What is the amount of Shakti’s profit?
A) $68
B) $72
C) $124
D) $192
16) Refer to Table 15-2. What is the economically efficient output level?
A) 5 units
B) 6 units
C) 7 units
D) 8 units
17) Refer to Table 15-2. What is the amount of the deadweight loss generated by Shakti when it
produces the monopoly output?
A) $124
B) $42
C) $36
D) $12
18) Market power refers to
A) the ability of consumers to dictate what products should be produced.
B) the ability of a firm to advertise its product and succeed in selling more output.
C) the ability of a firm to sell at a lower price than rival sellers.
D) the ability of a firm to charge a price higher than the marginal cost of production.