
Chapter 14
Data Analysis: Preliminary Steps
a. categorizing the data.
b. simply counting the number of cases that fall into the various categories.
c. inspecting and correcting each questionnaire or observation form.
d. developing dummy tables that suggest how each item of information will be used
before data is collected.
e. transforming the raw data into symbols.
a. ensure that the analysis is valid.
b. impose maximum quality standards on the raw data.
c. establish a balance between costs and accuracy.
d. establish codes for the raw data.
e. establish minimum quality standards for the raw data.
a. as soon as possible after the questionnaire has been administered.
b. before the questionnaire is administered.
c. after tabulating the data.
d. after coding the data.
e. after the interviewing force is disbanded.
a. helping to control the field force
b. detecting glaring omissions
c. clearing up misunderstandings about directions
d. a and c
e. the field edit is useful for all three purposes
a. the handling of the “don’t know” responses
b. completeness of the answers
c. uniformity displayed in recording the responses
d. legibility of the responses
e. inconsistencies in the responses
more concerned with deciding what exactly to do with the data.
a. field edit; central office edit
b. field edit; preliminary edit
c. edit; coding
d. edit; tabulation
e. central office edit; field edit

a. The central office edit depends primarily on follow-up, either directly with the
interviewers to clear up discrepancies or by having the interviewers recontact the
respondents to clear up inaccuracies or omissions.
b. If more than one person handles the central office edit, the questionnaires should
be divided by respondents with one editor doing all the work on a set of
questionnaires.
c. The first step in establishing categories is to get a “feel” for the data through
preliminary observation of the results so that one can decide what categories are
pertinent.
d. Coding the data refers to the affixing of a code number to each completed
questionnaire so as to aid in the identification of the respondent.
e. All of the above are false.
a. The field edit is primarily designed to detect the most glaring errors and
omissions.
b. The only purpose of the field edit is to check the questionnaires or observational
forms for completeness.
c. The purpose of analysis is to generate meaning from the collected data.
d. Editing involves the inspection and correction, if necessary, of each questionnaire
or observation form.
e. The central office edit depends less on follow-up and more on deciding explicitly
what to do with the data.
information on a questionnaire?
a. Throw out the entire questionnaire.
b. Overlook the missing information and code the remaining answers.
c. Substitute information based on the responses of similar respondents.
d. a and c only
e. All of the above might be appropriate.
a. secondary data; tabulated
b. symbols; manipulated
c. accessible form; automatically retrieved
d. tables; easily perceived
e. tables; analyzed for relationships between variables
a. The classes should always be mutually exclusive and exhaustive.
b. Multiple responses should never be coded.
c. Coding closed-ended questions is more difficult than coding open-ended
questions.
d. Alphabetic codes should be assigned to the classes.
e. Both a and b are true statements.
a. When preparing data for computer analysis, it is advisable to use alphabetic
characters to code the data rather than numbers since alphabetic characters allow
26 codes per column while numbers only allow 10; thus, one can minimize the
number of records per observation with alphabetic characters.
b. When preparing data for computer analysis, it is advisable to use as few records
per observation as possible and thus the use of multiple characters per column is
strongly recommended.
c. When a questionnaire requires more than 80 columns of codes, researchers should
allow for a record sequence number along with a respondent identification
number on each record.
d. A researcher is coding a variable that has nine possible answers. The researcher
needs to provide two columns in the record when developing the codebook.
e. All of the above are false.
18-24
25-34
35-44
45-54
55 and over
a. closed-ended, exhaustive, mutually exhaustive
b. open-ended, mutually exclusive, exhaustive
c. closed-ended, mutually exclusive, exhaustive
d. exhaustive, mutually exclusive, open-ended
e. none of the above
a. The use of several coders can lead to inconsistent treatment of answers.
b. Open-ended questions are generally more difficult to code than closed-ended
questions.
c. The coder must determine categories on the basis of answers that are not always
anticipated.
d. Coding open-ended questions is typically less expensive than coding
closed-ended questions.
e. When the task requires multiple coders, each coder should be assigned parts of the
questionnaire for all questionnaires rather than a subset of the questionnaires.
a. What are the three characteristics that you find most pleasing when using product
X?
b. Have you ever used product X? yes no
c. What religious denomination do you consider yourself?
d. Please specify the type of television set in your home.
e. How do you feel about commercials on children’s TV shows?
recommended?
a. Use only one character per record column.
b. Use alphabetic characters.
c. Assign as many columns to a variable as is necessary to capture the variable, e.g., two
columns would need to be assigned to a question with 12 possible answers.
d. Use standard codes like “8” for all “no answers” and “9” for all “don’t knows”
throughout the study.
e. Each of these procedures is recommended.
a. locate blunders.
b. locate outliers.
c. determine the empirical distribution of a variable.
d. communicate the results of the study.
e. determine the relationship between two variables.
a. locate blunders.
b. determine the empirical distribution of a variable.
c. determine the relationship between two variables.
d. a and b.
e. none of the above.
cleaning”?
a. locating outliers
b. calculating summary statistics
c. determining the degree of item nonresponse
d. locating blunders
e. all of the above are considered data cleaning
the data?
a. substituting values for the missing data
b. reporting the number of blanks as a separate category
c. eliminating the case with the missing data in analyses using the variable(s) for
which data is missing
d. eliminating questionnaires with missing data
e. none of the above

a. leave the item blank and report the number blank as a separate category
b. eliminate the case with the missing item in analyses using the variable
c. substitute values for the missing item
d. a and b
e. there is no single best way for handling missing items but rather their treatment
depends on the purpose of the study, the incidence of missing items, and the
methods that will be used to analyze the data
a. number of cross tabulations.
b. number of categories.
c. number of variables.
d. number of respondents in the sample.
e. a and c.
a. A frequency polygon is developed by connecting the points of change in a
cumulative distribution function.
b. The frequency polygon is obtained from the histogram by connecting the
midpoints of the bars with straight lines.
c. The empirical cumulative distribution function is obtained from the histogram by
connecting the midpoints of the bars of the histogram with straight lines.
d. The empirical cumulative distribution function can only be generated from the
cross tabulation.
e. b and d
a. histogram
b. frequency polygon
c. empirical cumulative distribution function
d. calculating summary statistics
e. it serves as input for all the above
(Use the following one-way tabulation to answer the next three questions.)
Value Frequency
1 12
2 15
3 8
4 7
a. 1
b. 2
c. 3
d. 4
e. none of the above
a. 10.50
b. 2.00
c. 2.24
d. 2.50
e. none of the above
a. 1.06
b. 1.11
c. 6.76
d. 3.70
e. none of the above
or relative frequency along the y axis is called a and can be developed from the .
a. bar graph; cumulative data
b. frequency polygon; one-way frequency tabulation
c. cumulative distribution graph; cumulative data
d. histogram; uncoded data
e. histogram; one-way frequency tabulation
frequency or relative frequency of occurrence of the values are indicated along the
ordinate, and the midpoints of the bars are connected is a:
a. matrix
b. cumulative distribution function
c. histogram
d. frequency polygon
e. midpoint chart
learn how the dependent variable varies from subgroup to subgroup?
a. longitudinal analysis
b. coding
c. cross-sectional analysis
d. cross tabulation
e. one-way tabulation
consistent with a theoretical or assumed distribution is the
a. cumulative distribution function.
b. matrix.
c. frequency polygon.
d. contingency table.
e. a and c.
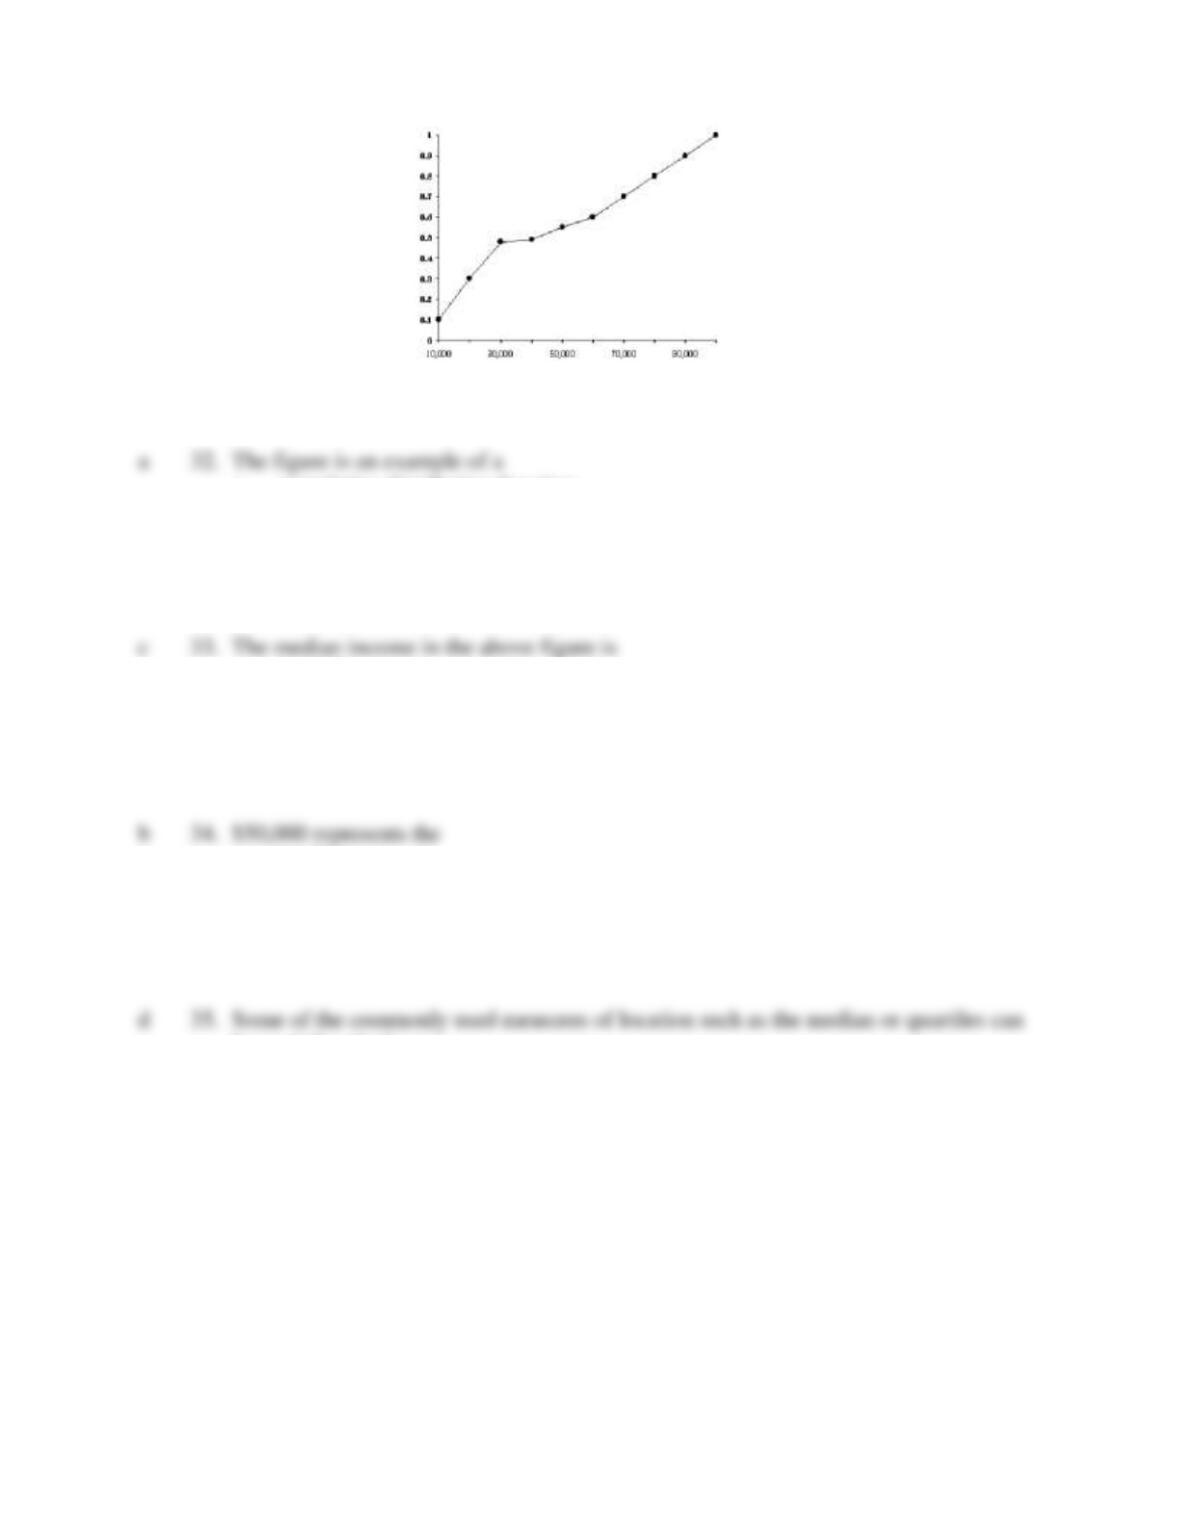
Annual Income per Person in $
a. cumulative distribution function.
b. frequency polygon.
c. histogram.
d. one-way tabulation of annual income per person.
e. midpoint chart.
a. $ 10,000.
b. $ 20,000.
c. $ 30,000.
d. $ 50,000.
e. $100,000.
a. median.
b. sixtieth percentile.
c. third quartile.
d. seventieth percentile.
e. none of the above.
be read directly from a
a. matrix.
b. frequency polygon.
c. histogram.
d. cumulative distribution function.
e. contingency table.
a. longitudinal analysis.
b. coding.
c. one-way tabulation analysis.
d. cross-sectional analysis.
e. cross-tabulation analysis.
a. The cross-tabulation provides information on the joint occurrence of two or more
variables.
b. The cross tabulation emphasizes the division of the sample into subgroups so as to
learn how the dependent variable varies from subgroup to subgroup.
c. Cross tabulation is very useful for studying relationships between variables.
d. Although a variable is part of a planned cross tabulation, it is still necessary to
develop the one-way tabulation if one wishes to construct the histogram showing
the distribution of the variable.
e. The conclusion regarding the relationship between two variables in a cross
tabulation can change with the introduction of another variable to the analysis.
predictor variable
a. reflects the total or zero order association between the variables.
b. is called a conditional table.
c. reflects the conditional association between the variables.
d. is called a first-order conditional table.
e. is called a second-order conditional table.
cross tabulations
a. when modifying the variables.
b. before data collection.
c. after data collection.
d. during data collection.
e. after scanning some initial questionnaires.

TABLE
No. of Purchases per Month per Brand
________________________________________________________________________
No. of Purchases
Brand
_________________________________________________________________
Bought 0 1 2 3 4 5 6 7 or More Total
________________________________________________________________________
A 3 1 1 1 4 10
B 1 1 4 4 4 14
C 1 1 1 4 1 1 1 1 11
________________________________________________________________________
TOTALS 4 2 2 6 6 5 5 5 35
________________________________________________________________________
a. 10,14,11
b. 35
c. 3,1,1,1,4
d. 3,1
e. none of the above are the marginals
Number of Children
Ever Divorced
1 or less
2 to 4
5 or more
Yes
9%
63%
92%
No
91%
37%
8%
Total
100%
100%
100%
a. Having more children increases the divorce rate.
b. Getting divorced makes a couple have more children.
c. The more children a person has the more likely s/he is to be divorced.
d. All of the above can be correctly concluded from the cross-tabulation.
e. None of the above can be concluded from the cross-tabulation.
Consider the following table when answering the next three questions:
G.P.A.
Starting Salary
3.0 or less
>3.0
< or =$30,000
17%
27%
>$30,000
12%
43%
where the percentage represent the proportion of those in the cells who had a job offer
with that starting salary upon graduation.
Sample Size
< or = $20,000 40
> $20,000 10
< or = 3.0 30
> 3.0 20
a. conditional table.
b. zero order table.
c. one-way tabulation.
d. directional table.
e. computational tabulation.
a. B.P.A. and starting salary
b. G.P.A., starting salary, and job after graduation.
c. job offer by graduation
d. starting salary
e. G.P.A.
or equal to 3.0) increase the probability of receiving a job offer by graduation?
a. .14
b. .16
c. .21
d. .41
e. None of the above are correct.
(Use the following information for the next six questions.)
Hours of Study and Grades Received on Test
for 100 Undergraduate Students
RESULTS FOR MEN:
Hours of Study
Grade Received 5 or less 6 or more Total
A 6 14 20
B 18 12 30
Total 24 26 50
RESULTS FOR WOMEN:
Hours of Study
Grade Received 5 or less 6 or more Total
A 8 16 24
B 16 10 26
Total 24 26 50
TOTALS:
Hours of Study
Grade Received 5 or less 6 or more Total
A 14 30 44
B 34 22 56
Total 48 52 100
of percentages, what percentage would be associated with the 18 men who received
a “B” and studied five hours or less?
a. 60%
b. 36%
c. 48%
d. 75%
e. none of the above
received” and “hours of study.”
a. one-way tabulation
b. conditional association
c. zero-order association
d. a and c only
e. none of the above
more hours impact the possibility of making an “A” over studying five hours or
less?
a. 29%
b. 16%
c. 36%
d. 58%
e. none of the above
following sets of numbers would be marginals?
a. 20, 24
b. 44, 56
c. 30, 26
d. 48, 52
e. none of the above
an “A”?
a. -8%
b. 4%
c. 8%
d. cannot determine from the information given
e. none of the above
making an “A” is , while for women this impact is . This means that there is
between the independent variables.
a. 12%;12%;no statistical interaction
b. 29%;29%;statistical interaction
c. 12%;12%;statistical interaction
d. 29%;29%;no statistical interaction
e. none of the above
(Use the following table to answer the next four questions.)
TABLE
Family Size and Ownership of a VCR by Household
(Figures in millions of households)
___________________________________________________________
Family OWN A VCR
Size Yes No TOTAL
___________________________________________________________
Less than 4 10 38 48
4 or more 24 28 52
____________________________________________________________
TOTAL 34 66 100
____________________________________________________________
a. one-way classification.
b. cross tabulation.
c. one-way tabulation.
d. four-way classification.
e. none of the above.
cause and effect is
a. by dividing each of the entries by 100.
b. by dividing 48 and 52 by 100.
c. by dividing 34 and 66 by 100.
d. by dividing entries in the first row by 48 and those in the second row by 52.
e. by dividing entries in the first column by 34 and those in the second column
by 66.
a. 10 million
b. 100 million
c. 48 million
d. 34 million
e. 52 million

owning a VCR?
a. Nothing can be inferred.
b. The smaller the family the more likely they are to own a VCR.
c. A lower proportion of large families (4 or more) own VCR’s than small
families.
d. Owning a VCR causes the family size to increase.
e. Ownership of a VCR tends to increase as family size increases.
swim trunks and the eating of ice cream. This is most likely an example of .
a. a causal relationship
b. spurious correlation
c. spurious noncorrelation
d. miscoding of data
e. none of the above
a. there is no true relationship between X and Y and the researcher concludes
there is.
b. the researcher concludes there is no relationship between X and Y and in fact
there is.
c. there is a true relationship between X and Y and the researcher concludes this
is so.
d. there is no true relationship between X and Y and the researcher concludes
this is so.
e. none of the above.
a. identify limiting conditions in the relationship between the original variables.
b. have no impact on the relationship between the original variables.
c. uncover spurious noncorrelation between the original variables.
d. uncover spurious correlation between the original variables.
e. do all of the above.
female), region of the country (east, west, north, south), and marital status (single,
married, divorced, separated). Assuming an even allocation of observations to
cells, how many observations are necessary for 20 per cell?
a. 60
b. 320
c. 480
d. 640
e. none of the above
successive variables to the analysis. Which of the following typically act to
constrain the researcher in this regard?
a. incorrect anticipation of the tabulations that will be needed, resulting in
failure to collect some needed data
b. size of the sample
c. theory
d. a and b
e. a, b, and c
a. Much information can be presented in a small amount of space.
b. The display format makes it easy for managers to read.
c. They provide a useful substitute for traditional cross-tabulation analysis.
d. Many explanatory variables can be considered in a single table.
e. All of the above are advantages of using a banner table.
traditional cross tabulation?
a. They may hide relationships in which it is necessary to consider several
variables simultaneously.
b. They make it difficult to probe alternative explanations as to what might be
producing certain results.
c. It is more difficult to detect data errors due to improper coding or editing.
d. a and c only
e. All of the above are disadvantages to using a banner table.
Kolmogorov-Smirnov test?
a. sales data for various shades of paint
b. number of patients visiting a doctor each day of the week
c. sales data for three brands of blue jeans
d. sales data for four different grades of building materials
e. all of the above should be analyzed using the Kolmogorov-Smirnov test
(K-S) test with respect to the chi-square goodness-of-fit test?
a. The K-S test can take advantage of the ordinal nature of data, while the
chi-square test cannot.
b. In almost all cases, the K-S test is more powerful than the chi-square test.
c. The K-S test requires a certain minimum expected frequency in each cell,
while the chi-square test does not.
d. The K-S test is easier to compute than the chi-square test.
e. All of the above are true of the K-S test with respect to the chi-square test.

Kolmogorov-Smirnov test
a. is more powerful.
b. is easier to compute.
c. does not require minimum cell frequencies for computations.
d. all of the above.
e. a and b only.
a. two independent samples are drawn from the same population.
b. two independent samples are drawn from different populations.
c. two variables x and y are correlated.
d. variable x explains a significant amount of variation in the dependent
measure, y.
e. a and b above.