CHAPTER 14
FINANCIAL STATEMENT ANALYSIS
SUMMARY OF QUESTIONS BY LEARNING OBJECTIVES AND BLOOM’S TAXONOMY
Item
LO
BT
Item
LO
BT
Item
LO
BT
Item
LO
BT
Item
LO
BT
True-False Statements
1.
1
C
9.
3
K
17.
4
K
25.
5
C
sg33.
4
K
2.
1
K
10.
3
AP
18.
5
K
26.
5
C
sg34.
5
K
3.
1
K
11.
3
C
19.
5
K
27.
6
K
sg35.
5
K
4.
1
K
12.
4
K
20.
5
K
28.
6
K
sg36.
6
K
5.
1
K
13.
4
C
21.
5
K
29.
7
K
6.
2
K
14.
4
C
22.
5
C
30.
7
K
7.
2
K
15.
4
C
23.
5
C
sg31.
2
K
8.
3
K
16.
4
C
24.
5
C
sg32.
3
K
Multiple Choice Questions
37.
1
K
66.
4
C
95.
5
C
124.
5
AP
153.
6
AP
38.
1
K
67.
4
C
96.
5
AP
125.
5
AP
154.
6
C
39.
1
C
68.
4
C
97.
5
C
126.
5
AP
155.
6
K
40.
1
C
69.
4
C
98.
5
C
127.
5
AP
156.
6
K
41.
1
C
70.
5
C
99.
5
K
128.
5
AP
157.
6
K
42.
1
C
71.
5
C
100.
5
C
129.
5
AP
158.
6
C
43.
1
C
72.
5
K
101.
5
AP
130.
5
AP
159.
6
K
44.
1
K
73.
5
K
102.
5
AP
131.
5
AP
160.
7
C
45.
2
K
74.
5
K
103.
5
C
132.
5
AP
sg161.
1
K
46.
2
K
75.
5
AP
104.
5
K
133.
5
AP
sg162.
1
K
47.
2
K
76.
5
AP
105.
5
AP
134.
5
AP
sg163.
3
AN
48.
3
K
77.
5
AP
106.
5
C
135.
5
AP
st164.
4
K
49.
4
K
78.
5
AP
107.
5
C
136.
5
AP
sg165.
4
K
50.
5
K
79.
5
K
108.
5
AP
137.
5
AP
sg166.
5
K
51.
3
K
80.
5
C
109.
5
K
138.
5
AP
sg167.
5
K
52.
3
K
81.
5
C
110.
5
C
139.
5
AP
sg168.
5
K
53.
3
K
82.
5
K
111.
5
K
140.
5
AP
sg169.
5
K
54.
3
AP
83.
5
AP
112.
5
K
141.
5
AP
sg170.
6
K
55.
3
K
84.
5
AP
113.
5
K
142.
5
AP
sg171.
6
AP
56.
3
C
85.
5
AP
114.
5
AP
143.
5
AP
sg172.
6
K
57.
3
C
86.
5
C
115.
5
AP
144.
5
AP
173.
8
K
58.
3
C
87.
5
K
116.
5
AP
145.
6
AN
174.
8
K
59.
3
AP
88.
5
AP
117.
5
AP
146.
6
C
175.
8
K
60.
3
AP
89.
5
K
118.
5
AP
147.
6
AP
176.
8
K
61.
4
AP
90.
5
C
119.
5
AP
148.
6
AP
177.
8
K
62.
4
AP
91.
5
C
120.
5
AP
149.
6
AP
178.
8
K
63.
4
K
92.
5
C
121.
5
AP
150.
6
K
179.
8
K
64.
4
K
93.
5
C
122.
5
AP
151.
6
K
180.
8
K
65.
4
C
94.
5
C
123.
5
AP
152.
6
AP
sg This question also appears in the Study Guide.
st This question also appears in a self-test at the student companion website.
Test Bank for Financial Accounting, Ninth Edition
FOR INSTRUCTOR USE ONLY
14 – 2
SUMMARY OF QUESTIONS BY LEARNING OBJECTIVES AND BLOOM’S TAXONOMY
Brief Exercises
181.
3
AP
184.
3
AP
187.
5
K
190.
5
AP
182.
3
AP
185.
4
AP
188.
5
AP
191.
6
AP
183.
3
AN
186.
4
AP
189.
5
AP
Exercises
192.
3
AP
199.
3,4
AP
206.
5
AP
213.
5
AP
220.
6
AP
193.
3
AP
200.
4
AP
207.
5
AP
214.
5
AP
221.
6
AP
194.
3
AP
201.
4
AN
208.
5
AP
215.
5
AP
222.
6
AP
195.
3
AN
202.
5
AP
209.
5
AP
216.
5
AN
196.
3,4
AP
203.
5
AP
210.
5
AP
217.
6
AP
197.
3,4
AP
204.
5
AP
211.
5
E
218.
6
AP
198.
3,4
AP
205.
5
AP
212.
5
AN
219.
6
AP
Completion Statements
223.
1
K
226.
5
K
229.
5
AP
232.
5
K
235.
6
K
224.
3
K
227.
5
K
230.
5
K
233.
6
K
225.
4
K
228.
5
AP
231.
5
K
234.
6
K
Matching Statements
236.
5
AN
237.
2
K
Short-Answer Essay
238.
1
K
240.
2
K
242.
6
K
244.
1
S
239.
1
K
241.
7
K
243.
7
K
SUMMARY OF LEARNING OBJECTIVES BY QUESTION TYPE
Item
Type
Item
Type
Item
Type
Item
Type
Item
Type
Item
Type
Item
Type
Learning Objective 1
1.
TF
4.
TF
38.
MC
41.
MC
44.
MC
215.
C
244.
SA
2.
TF
5.
TF
39.
MC
42.
MC
161.
MC
238.
SA
3.
TF
37.
MC
40.
MC
43.
MC
162.
MC
239.
SA
Learning Objective 2
6.
TF
31.
TF
46.
MC
240.
SA
7.
TF
45.
MC
47.
MC
237.
MA
Learning Objective 3
8.
TF
48/51.
MC
56.
MC
163.
MC
192.
Ex
197.
Ex
9.
TF
52.
MC
57.
MC
181.
BE
193.
Ex
198.
MC
10.
TF
53.
MC
58.
MC
182.
BE
194.
Ex
199.
MC
11.
TF
54.
MC
59.
MC
183.
BE
195.
Ex
224.
C
32.
TF
55.
MC
60.
MC
184.
BE
196.
Ex
Learning Objective 4
12.
TF
16.
TF
62.
MC
66.
MC
164.
MC
196.
Ex
200.
Ex
13.
TF
17.
TF
63.
MC
67.
MC
165.
MC
197.
Ex
201.
Ex
14.
TF
33/49.
TF
64.
MC
68.
MC
185.
BE
198.
MC
225.
C
15.
TF
61.
MC
65.
MC
69.
MC
186.
BE
199.
MC
Note: TF = True-False BE = Brief Exercise C = Completion
MC = Multiple Choice Ex = Exercise
Financial Statement Analysis
FOR INSTRUCTOR USE ONLY
14 – 3
SUMMARY OF LEARNING OBJECTIVES BY QUESTION TYPE
Learning Objective 5
18.
TF
76.
MC
93.
MC
110.
MC
127.
MC
144.
MC
210.
Ex
19.
TF
77.
MC
94.
MC
111.
MC
128.
MC
166.
MC
211.
Ex
20.
TF
78.
MC
95.
MC
112.
MC
129.
MC
167.
MC
212.
Ex
21.
TF
79.
MC
96.
MC
113.
MC
130.
MC
168.
MC
213.
Ex
22.
TF
80.
MC
97.
MC
114.
MC
131.
MC
169.
MC
214.
Ex
23.
TF
81.
MC
98.
MC
115.
MC
132.
MC
187.
BE
215.
Ex
24.
TF
82.
MC
99.
MC
116.
MC
133.
MC
188.
BE
216.
Ex
25.
TF
83.
MC
100.
MC
117.
MC
134.
MC
189.
BE
226.
C
26.
TF
84.
MC
101.
MC
118.
MC
135.
MC
190.
BE
227.
C
34.
TF
85.
MC
102.
MC
119.
MC
136.
MC
202.
Ex
228.
C
35./50.
TF
86.
MC
103.
MC
120.
MC
137.
MC
203.
Ex
229.
C
70.
MC
87.
MC
104.
MC
121.
MC
138.
MC
204.
Ex
230.
C
71.
MC
88.
MC
105.
MC
122.
MC
139.
MC
205.
Ex
231.
C
72.
MC
89.
MC
106.
MC
123.
MC
140.
MC
206.
Ex
232.
C
73.
MC
90.
MC
107.
MC
124.
MC
141.
MC
207.
Ex
236.
MA
74.
MC
91.
MC
108.
MC
125.
MC
142.
MC
208.
Ex
75.
MC
92.
MC
109.
MC
126.
MC
143.
MC
209.
Ex
Learning Objective 6
27.
TF
147.
MC
152.
MC
157.
MC
172.
MC
220.
Ex
235.
C
28.
TF
148.
MC
153.
MC
158.
MC
191.
BE
221.
Ex
242.
SA
36.
TF
149.
MC
154.
MC
159.
MC
217.
Ex
222.
Ex
45.
MC
150.
MC
155.
MC
170.
MC
218.
Ex
233.
C
46.
MC
151.
MC
156.
MC
171.
MC
219.
Ex
234.
C
Learning Objective 7
29.
TF
30.
TF
160.
MC
241.
SA
243.
SA
Learning Objective 8
173.
MC
175.
MC
177.
MC
179.
MC
174.
MC
176.
MC
178.
MC
180.
MC
Note: TF = True-False BE = Brief Exercise C = Completion
MC = Multiple Choice Ex = Exercise
CHAPTER LEARNING OBJECTIVES
1. Discuss the need for comparative analysis. There are three bases of comparison: (1)
Intracompany, which compares an item or financial relationship with other data within a
company; (2) Industry, which compares company data with industry averages; (3)
Intercompany, which compares an item or financial relationship of a company with data of one
or more competing companies.
2. Identify the tools of financial statement analysis. Financial statements can be analyzed
horizontally, vertically, and with ratios.
3. Explain and apply horizontal analysis. Horizontal analysis is a technique for evaluating a
series of data over a period of time to determine the increase or decrease that has taken
place, expressed as either an amount or a percentage.
Test Bank for Financial Accounting, Ninth Edition
14 – 4
4. Describe and apply vertical analysis. Vertical analysis is a technique that expresses each
item within a financial statement in terms of a percentage of a relevant total or a base amount.
5. Identify and compute ratios used in analyzing a firm’s liquidity, profitability, and
solvency. The formula and purpose of each ratio is presented in Illustration 14–27.
6. Understand the concept of earning power, and how irregular items are presented.
Earning power refers to a company’s ability to sustain its profits from operations. “Irregular
items”—discontinued operations and extraordinary items—are presented net of tax below
income from continuing operations to highlight their unusual nature.
7. Understand the concept of quality of earnings. A high quality of earnings provides full and
transparent information that will not confuse or mislead users of financial statements. Issues
related to quality of earnings are (1) alternative accounting methods, (2) pro forma income,
and (3) improper recognition.
TRUE-FALSE STATEMENTS
1. Intracompany comparisons of the same financial statement items can often detect
changes in financial relationships and significant trends.
2. Calculating financial ratios is a financial reporting requirement under generally accepted
accounting principles.
3. Measures of a company’s liquidity are concerned with the frequency and amounts of
dividend payments.
4. Analysis of financial statements is enhanced with the use of comparative data.
5. Comparisons of company data with industry averages can provide some insight into the
company’s relative position in the industry.
6. Vertical and horizontal analyses are concerned with the format used to prepare financial
statements.
7. Horizontal, vertical, and circular analyses are the most common tools of financial
statement analysis.
8. Horizontal analysis is a technique for evaluating a financial statement item in the current
year with other items in the current year.
Financial Statement Analysis
14 – 5
9. Another name for trend analysis is horizontal analysis.
10. If a company has sales of $110 in 2013 and $154 in 2014, the percentage increase in
sales from 2013 to 2014 is 140%.
11. In horizontal analysis, if an item has a negative amount in the base year, and a positive
amount in the following year, no percentage change for that item can be computed.
12. Common size analysis expresses each item within a financial statement in terms of a
percent of a base amount.
13. Vertical analysis is a more sophisticated analytical tool than horizontal analysis.
14. Vertical analysis is useful in making comparisons of companies of different sizes.
15. Meaningful analysis of financial statements will include either horizontal or vertical
analysis, but not both.
16. Using vertical analysis of the income statement, a company’s net income as a percentage
of net sales is 10%; therefore, the cost of goods sold as a percentage of sales must be
90%.
17. In the vertical analysis of the income statement, each item is generally stated as a
percentage of net income.
18. A ratio can be expressed as a percentage, a rate, or a proportion.
19. A solvency ratio measures the income or operating success of an enterprise for a given
period of time.
20. The current ratio is a measure of all the ratios calculated for the current year.
Test Bank for Financial Accounting, Ninth Edition
14 – 6
21. Inventory turnover measures the number of times on the average the inventory was sold
during the period.
22. Profitability ratios are frequently used as a basis for evaluating management‘s operating
effectiveness.
23. The rate of return on total assets will be greater than the rate of return on common
stockholders’ equity if the company has been successful in trading on the equity at a gain.
24. From a creditor’s point of view, the higher the total debt to total assets ratio, the lower the
risk that the company may be unable to pay its obligations.
25. A current ratio of 1.2 to 1 indicates that a company’s current assets exceed its current
liabilities.
26. Using borrowed money to increase the rate of return on common stockholders’ equity is
called “trading on the equity.”
27. When the disposal of a significant component occurs, the income statement should report
both income from continuing operations and income (loss) from discontinued operations.
28. An event or transaction should be classified as an extraordinary item if it is unusual in
nature or if it occurs infrequently.
29. Variations among companies in the application of generally accepted accounting
principles may reduce quality of earnings.
30. Pro forma income usually excludes items that the company thinks are unusual or
nonrecurring.
31. The three basic tools of analysis are horizontal analysis, vertical analysis, and ratio
analysis.
32. A percentage change can be computed only if the base amount is zero or positive.
Financial Statement Analysis
14 – 7
33. In vertical analysis, the base amount in an income statement is usually net sales.
34. Profitability ratios measure the ability of the enterprise to survive over a long period of
time.
35. The days in inventory is computed by multiplying inventory turnover by 365.
36. Extraordinary items are reported net of applicable taxes in a separate section of the
income statement.
Answers to True-False Statements
Item
Ans.
Item
Ans.
Item
Ans.
Item
Ans.
Item
Ans.
Item
Ans.
MULTIPLE CHOICE QUESTIONS
37. Which one of the following is primarily interested in the liquidity of a company?
a. Federal government
b. Stockholders
c. Long-term creditors
d. Short-term creditors
38. Which one of the following is not a characteristic generally evaluated in analyzing
financial statements?
a. Liquidity
b. Profitability
c. Marketability
d. Solvency
39. In analyzing the financial statements of a company, a single item on the financial
statements
a. should be reported in bold-face type.
b. is more meaningful if compared to other financial information.
c. is significant only if it is large.
d. should be accompanied by a footnote.
Test Bank for Financial Accounting, Ninth Edition
14 – 8
40. Short-term creditors are usually most interested in evaluating
a. solvency.
b. liquidity.
c. marketability.
d. profitability.
41. Long-term creditors are usually most interested in evaluating
a. liquidity and solvency.
b. solvency and marketability.
c. liquidity and profitability.
d. profitability and solvency.
42. Stockholders are most interested in evaluating
a. liquidity and solvency.
b. profitability and solvency.
c. liquidity and profitability.
d. marketability and solvency.
43. A stockholder is interested in the ability of a firm to
a. pay consistent dividends.
b. appreciate in share price.
c. survive over a long period.
d. All of these answer choices are correct.
44. Comparisons of financial data made within a company are called
a. intracompany comparisons.
b. interior comparisons.
c. intercompany comparisons.
d. intramural comparisons.
45. A technique for evaluating financial statements that expresses the relationship among
selected items of financial statement data is
a. common size analysis.
b. horizontal analysis.
c. ratio analysis.
d. vertical analysis.
Financial Statement Analysis
14 – 9
46. Which one of the following is not a tool in financial statement analysis?
a. Horizontal analysis
b. Circular analysis
c. Vertical analysis
d. Ratio analysis
47. In analyzing financial statements, horizontal analysis is a
a. requirement.
b. tool.
c. principle.
d. theory.
48. Horizontal analysis is also called
a. linear analysis.
b. vertical analysis.
c. trend analysis.
d. common size analysis.
49. Vertical analysis is also known as
a. perpendicular analysis.
b. common size analysis.
c. trend analysis.
d. straight-line analysis.
50. In ratio analysis, the ratios are never expressed as a
a. rate.
b. negative figure.
c. percentage.
d. simple proportion.
51. The formula for horizontal analysis of changes since the base period is the current year
amount
a. divided by the base year amount.
b. minus the base year amount divided by the base year amount.
c. minus the base year amount divided by the current year amount.
d. plus the base year amount divided by the base year amount.
Test Bank for Financial Accounting, Ninth Edition
14 – 10
52. Horizontal analysis evaluates a series of financial statement data over a period of time
a. that has been arranged from the highest number to the lowest number.
b. that has been arranged from the lowest number to the highest number.
c. to determine which items are in error.
d. to determine the amount and/or percentage increase or decrease that has taken
place.
53. Horizontal analysis evaluates financial statement data
a. within a period of time.
b. over a period of time.
c. on a certain date.
d. as it may appear in the future.
54. Assume the following sales data for a company:
2016 $1,050,000
2015 950,000
2014 800,000
2013 650,000
If 2013 is the base year, what is the percentage increase in sales from 2013 to 2015?
a. 100%
b. 61.5%
c. 46.2%
d. 68.4%
55. Comparative balance sheets are usually prepared for
a. one year.
b. two years.
c. three years.
d. four years.
56. Horizontal analysis is appropriately performed
a. only on the income statement.
b. only on the balance sheet.
c. only on the statement of retained earnings.
d. on all three of these statements.
Financial Statement Analysis
14 – 11
57. A horizontal analysis performed on a statement of retained earnings would not show a
percentage change in
a. dividends paid.
b. net income.
c. expenses.
d. beginning retained earnings.
58. Under which of the following cases may a percentage change be computed?
a. The trend of the balances is decreasing but all balances are positive.
b. There is no balance in the base year.
c. There is a positive balance in the base year and a negative balance in the subsequent
year.
d. There is a negative balance in the base year and a positive balance in the subsequent
year.
59. Assume the following sales data for a company:
2016 $945,000
2015 877,500
2014 675,000
If 2014 is the base year, what is the percentage increase in sales from 2014 to 2015?
a. 76.9%
b. 30%
c. 40%
d. 71.4%
60. Assume the following cost of goods sold data for a company:
2016 $1,704,000
2015 1,400,000
2014 1,200,000
If 2014 is the base year, what is the percentage increase in cost of goods sold from 2014
to 2016?
a. 70.4%
b. 42%
c. 85.7%
d. 117%
Test Bank for Financial Accounting, Ninth Edition
14 – 12
61. Saira, Inc. has the following income statement (in millions):
SAIRA, INC.
Income Statement
For the Year Ended December 31, 2014
Net Sales $300
Cost of Goods Sold 180
Gross Profit 120
Operating Expenses 45
Net Income $75
Using vertical analysis, what percentage is assigned to Cost of Goods Sold?
a. 40%
b. 60%
c. 100%
d. None of these answer choices are correct.
62. Saira, Inc. has the following income statement (in millions):
SAIRA, INC.
Income Statement
For the Year Ended December 31, 2014
Net Sales $300
Cost of Goods Sold 180
Gross Profit 120
Operating Expenses 45
Net Income $75
Using vertical analysis, what percentage is assigned to Net Income?
a. 625%
b. 40%
c. 25%
d. None of these answer choices are correct.
63. Vertical analysis is also called
a. common size analysis.
b. horizontal analysis.
c. ratio analysis.
d. trend analysis.
Financial Statement Analysis
14 – 13
64. Vertical analysis is a technique which expresses each item within a financial statement
a. in dollars and cents.
b. in terms of a percentage of the item in the previous year.
c. in terms of a percent of a base amount.
d. starting with the highest value down to the lowest value.
65. In common size analysis,
a. a base amount is required.
b. a base amount is optional.
c. the same base is used across all financial statements analyzed.
d. the results of the horizontal analysis are necessary inputs for performing the analysis.
66. In performing a vertical analysis, the base for prepaid expenses is
a. total current assets.
b. total assets.
c. total liabilities and stockholders’ equity.
d. prepaid expenses.
67. In performing a vertical analysis, the base for sales revenues on the income statement is
a. net sales.
b. sales.
c. net income.
d. cost of goods available for sale.
68. In performing a vertical analysis, the base for sales returns and allowances is
a. sales.
b. sales discounts.
c. net sales.
d. total revenues.
69. In performing a vertical analysis, the base for cost of goods sold is
a. total selling expenses.
b. net sales.
c. total revenues.
d. total expenses.
70. Each of the following is a liquidity ratio except the
a. acid-test ratio.
b. current ratio.
c. debt to assets ratio.
d. inventory turnover.
Test Bank for Financial Accounting, Ninth Edition
14 – 14
71. A ratio calculated in the analysis of financial statements
a. expresses a mathematical relationship between two numbers.
b. shows the percentage increase from one year to another.
c. restates all items on a financial statement in terms of dollars of the same purchasing
power.
d. is meaningful only if the numerator is greater than the denominator.
72. A liquidity ratio measures the
a. income or operating success of an enterprise over a period of time.
b. ability of the enterprise to survive over a long period of time.
c. short-term ability of the enterprise to pay its maturing obligations and to meet
unexpected needs for cash.
d. number of times interest is earned.
73. The current ratio is
a. calculated by dividing current liabilities by current assets.
b. used to evaluate a company’s liquidity and short-term debt paying ability.
c. used to evaluate a company’s solvency and long-term debt paying ability.
d. calculated by subtracting current liabilities from current assets.
74. The acid-test (quick) ratio
a. is used to quickly determine a company’s solvency and long-term debt paying ability.
b. relates cash, short-term investments, and net receivables to current liabilities.
c. is calculated by taking one item from the income statement and one item from the
balance sheet.
d. is the same as the current ratio except it is rounded to the nearest whole percent.
75. Blaney Clothing Store had a balance in the Accounts Receivable account of $437,500 at
the beginning of the year and a balance of $500,000 at the end of the year. Net credit
sales during the year amounted to $3,000,000. The average collection period of the
receivables in terms of days was
a. 53.2 days.
b. 365 days.
c. 60.1 days.
d. 57 days.
Financial Statement Analysis
14 – 15
76. Fess Hardware Store had net credit sales of $8,500,000 and cost of goods sold of
$5,000,000 for the year. The Accounts Receivable balances at the beginning and end of
the year were $600,000 and $760,000, respectively. The accounts receivable turnover
was
a. 7.4 times.
b. 5.9 times.
c. 11.2 times.
d. 12.5 times.
77. Turnbull Department Store had net credit sales of $18,000,000 and cost of goods sold of
$15,000,000 for the year. The average inventory for the year amounted to $2,500,000.
Inventory turnover for the year is
a. 7.2 times.
b. 15 times.
c. 6 times.
d. 1.5 times.
78. Turnbull Department Store had net credit sales of $18,000,000 and cost of goods sold of
$15,000,000 for the year. The average inventory for the year amounted to $2,500,000.
The average number of days in inventory during the year was
a. 365 days.
b. 60.8 days.
c. 50.7 days.
d. 30 days.
79. Each of the following is included in computing the acid-test ratio except
a. cash.
b. inventory.
c. receivables.
d. short-term investments.
80. Which one of the following would not be considered a liquidity ratio?
a. Current ratio
b. Inventory turnover
c. Acid-test ratio
d. Return on assets
Test Bank for Financial Accounting, Ninth Edition
14 – 16
81. Asset turnover measures
a. how often a company replaces its assets.
b. how efficiently a company uses its assets to generate sales.
c. the portion of the assets that have been financed by creditors.
d. the overall rate of return on assets.
82. Profit margin is calculated by dividing
a. sales by cost of goods sold.
b. gross profit by net sales.
c. net income by stockholders’ equity.
d. net income by net sales.
83. Ale Corporation had net income of $240,000 and paid dividends to common stockholders
of $40,000 in 2014. The weighted average number of shares outstanding in 2014 was
60,000 shares. Ale Corporation’s common stock is selling for $76 per share on the New
York Stock Exchange. Ale Corporation‘s price-earnings ratio is
a. 3.2 times.
b. 22.8 times.
c. 19 times.
d. 12.7 times.
84. Ale Corporation had net income of $240,000 and paid dividends to common stockholders
of $40,000 in 2014. The weighted average number of shares outstanding in 2014 was
60,000 shares. Ale Corporation’s common stock is selling for $60 per share on the New
York Stock Exchange. Ale Corporation‘s payout ratio for 2014 is
a. $0.71 per share.
b 25%.
c. 16.7%.
d. 8%.
85. Lake Company reported the following on its income statement:
Income before income taxes $600,000
Income tax expense 150,000
Net income $450,000
An analysis of the income statement revealed that interest expense was $60,000. Lake
Company’s times interest earned was
a. 11 times.
b. 10 times.
c. 8.5 times.
d. 7.5 times.
Financial Statement Analysis
14 – 17
86. The debt to assets ratio measures
a. the company’s profitability.
b. whether interest can be paid on debt in the current year.
c. the proportion of interest paid relative to dividends paid.
d. the percentage of the total assets provided by creditors.
87. Trading on the equity (leverage) refers to the
a. amount of working capital.
b. amount of capital provided by owners.
c. use of borrowed money to increase the return to owners.
d. number of times interest is earned.
88. The current assets of Myers Company are $250,000. The current liabilities are $100,000.
The current ratio expressed as a proportion is
a. 250%.
b. 2.5 : 1
c. .25 : 1
d. $250,000 ÷ $100,000.
89. The current ratio may also be referred to as the
a. short run ratio.
b. acid-test ratio.
c. working capital ratio.
d. contemporary ratio.
90. A weakness of the current ratio is
a. the difficulty of the calculation.
b. that it doesn’t take into account the composition of the current assets.
c. that it is rarely used by sophisticated analysts.
d. that it can be expressed as a percentage, as a rate, or as a proportion.
91. A supplier to a company would be most interested in the company’s
a. asset turnover.
b. profit margin.
c. current ratio.
d. earnings per share.
Test Bank for Financial Accounting, Ninth Edition
14 – 18
92. Which one of the following ratios would not likely be used by a short-term creditor in
evaluating whether to sell on credit to a company?
a. Current ratio
b. Acid-test ratio
c. Asset turnover
d. Accounts receivable turnover
93. Ratios are used as tools in financial analysis
a. instead of horizontal and vertical analyses.
b. because they may provide information that is not apparent from inspection of the
individual components of the ratio.
c. because even single ratios by themselves are quite meaningful.
d. because they are prescribed by GAAP.
94. The ratios that are used to determine a company’s short-term debt paying ability are
a. asset turnover, times interest earned, current ratio, and accounts receivable turnover.
b. times interest earned, inventory turnover, current ratio, and accounts receivable turnover.
c. times interest earned, acid-test ratio, current ratio, and inventory turnover.
d. current ratio, acid-test ratio, accounts receivable turnover, and inventory turnover.
95. A measure of the percentage of each dollar of sales that results in net income is
a. profit margin.
b. return on assets.
c. return on common stockholders’ equity.
d. earnings per share.
96. Nord Company had $375,000 of current assets and $150,000 of current liabilities before
borrowing $70,000 from the bank with a 3-month note payable. What effect did the
borrowing transaction have on the amount of Nord Company‘s working capital?
a. No effect
b. $70,000 increase
c. $140,000 increase
d. $70,000 decrease
97. Nord Company had $375,000 of current assets and $150,000 of current liabilities before
borrowing $70,000 from the bank with a 3-month note payable. What effect did the
borrowing transaction have on Nord Company’s current ratio?
a. The ratio remained unchanged.
b. The change in the current ratio cannot be determined.
c. The ratio decreased.
d. The ratio increased.
Financial Statement Analysis
14 – 19
98. If equal amounts are added to the numerator and the denominator of the current ratio, the
ratio will always
a. increase.
b. decrease.
c. stay the same.
d. equal zero.
99. The acid-test ratio
a. is a quick calculation of an approximation of the current ratio.
b. does not include all current liabilities in the calculation.
c. does not include inventory as part of the numerator.
d. does include prepaid expenses as part of the numerator.
100. If a company has an acid-test ratio of 1.2:1, what respective effects will the borrowing of
cash by short-term debt and collection of accounts receivable have on the ratio?
Short-term Borrowing Collection of Receivable
a. Increase No effect
b. Increase Increase
c. Decrease No effect
d. Decrease Decrease
101. A company has a accounts receivable turnover of 10 times. The average accounts
receivable during the period are $400,000. What is the amount of net credit sales for the
period?
a. $40,000
b. $4,000,000
c. $400,000
d. Cannot be determined from the information given
102. If the average collection period is 60 days, what is the accounts receivable turnover?
a. 6.0 times
b. 6.1 times
c. 12.2 times
d. None of these
103. A general rule to use in assessing the average collection period is that
a. it should not exceed 30 days.
b. it can be any length as long as the customer continues to buy merchandise.
c. it should not greatly exceed the discount period.
d. it should not greatly exceed the credit term period.

Test Bank for Financial Accounting, Ninth Edition
FOR INSTRUCTOR USE ONLY
14 – 20
Financial Statement Analysis
14 – 21
104. Inventory turnover is calculated by dividing
a. cost of goods sold by the ending inventory.
b. cost of goods sold by the beginning inventory.
c. cost of goods sold by the average inventory.
d. average inventory by cost of goods sold.
105. A company has an average inventory on hand of $60,000 and the days in inventory is 73
days. What is the cost of goods sold?
a. $300,000
b. $4,380,000
c. $600,000
d. $2,190,000
106. A successful grocery store would probably have
a. a low inventory turnover.
b. a high inventory turnover.
c. zero profit margin.
d. low volume.
107. An aircraft company would most likely have
a. a high inventory turnover.
b. low profit margin.
c. high volume.
d. a low inventory turnover.
108. Net sales are $8,000,000, beginning total assets are $2,500,000, and the asset turnover is
4.0 times. What is the ending total asset balance?
a. $2,000,000
b. $1,500,000
c. $2,800,000
d. $2,500,000
109. Earnings per share is calculated
a. only for common stock.
b. only for preferred stock.
c. for common and preferred stock.
d. only for treasury stock.
Test Bank for Financial Accounting, Ninth Edition
14 – 22
110. Which of the following is not a profitability ratio?
a. Payout ratio
b. Profit margin
c. Times interest earned
d. Return on common stockholders’ equity
111. Times interest earned is also called the
a. money multiplier.
b. interest coverage ratio.
c. coupon coverage ratio.
d. premium ratio.
112. The ratio that uses weighted average common shares outstanding in the denominator is
the
a. price-earnings ratio.
b. return on common stockholders’ equity.
c. earnings per share.
d. payout ratio.
113. Net income does not appear in the numerator of the
a. profit margin.
b. return on assets.
c. return on common stockholders’ equity.
d. payout ratio.
114. Swiss Clothing Store had a balance in the Accounts Receivable account of $820,000 at
the beginning of the year and a balance of $780,000 at the end of the year. Net credit
sales during the year amounted to $7,200,000. The accounts receivable turnover ratio
was
a. 9.0 times.
b. 8.4 times.
c. 9.2 times.
d. 8.8 times.
Financial Statement Analysis
14 – 23
115. Swiss Clothing Store had a balance in the Accounts Receivable account of $920,000 at
the beginning of the year and a balance of $980,000 at the end of the year. Net credit
sales during the year amounted to $6,650,000. The average collection period of the
receivables in terms of days was
a. 53.7 days.
b. 52.1 days.
c. 30 days.
d. 50.7 days.
116. Blitzen Corporation had net income of $200,000 and paid dividends to common
stockholders of $50,000 in 2014. The weighted average number of shares outstanding in
2014 was 40,000 shares. Blitzen Corporation’s common stock is selling for $35 per share
on the New York Stock Exchange. Blitzen Corporation’s price-earnings ratio is
a. 5.6 times.
b. 7 times.
c. 5 times.
d. 9.3 times.
117. Blitzen Corporation had net income of $500,000 and paid dividends to common
stockholders of $40,000 in 2014. The weighted average number of shares outstanding in
2014 was 60,000 shares. Blitzen Corporation’s common stock is selling for $50 per share
on the New York Stock Exchange. Blitzen Corporation’s payout ratio for 2014 is
a. $8.33 per share.
b. 8%.
c. 12%.
d. 16%.
118. Country Company reported the following on its income statement:
Income before income taxes $850,000
Income tax expense 250,000
Net income $650,000
An analysis of the income statement revealed that interest expense was $100,000.
Country Company‘s times interest earned was
a. 3.4 times.
b. 9.5 times.
c. 6.5 times.
d. 8.5 times.
Test Bank for Financial Accounting, Ninth Edition
FOR INSTRUCTOR USE ONLY
14 – 24
119. The following information pertains to Ortiz Company. Assume that all balance sheet
amounts represent both average and ending balance figures. Assume that all sales were
on credit. Assets
Cash and short-term investments $ 45,000
Accounts receivable (net) 30,000
Inventory 20,000
Property, plant and equipment 210,000
Total Assets $305,000
Liabilities and Stockholders’ Equity
Current liabilities $ 50,000
Long-term liabilities 95,000
Stockholders’ equity—common 160,000
Total Liabilities and Stockholders’ Equity $305,000
Income Statement
Sales $ 120,000
Cost of goods sold 66,000
Gross profit 54,000
Operating expenses 30,000
Net income $ 24,000
Number of shares of common stock 6,000
Market price of common stock $20
Dividends per share .50
What is the current ratio for Ortiz?
a. 1.90
b. 1.50
c. 1.30
d. .53
120. The following information pertains to Ortiz Company. Assume that all balance sheet
amounts represent both average and ending balance figures. Assume that all sales were
on credit. Assets
Cash and short-term investments $ 45,000
Accounts receivable (net) 40,000
Inventory 20,000
Property, plant and equipment 210,000
Total Assets $305,000
Liabilities and Stockholders’ Equity
Current liabilities $ 50,000
Long-term liabilities 95,000
Stockholders’ equity—common 160,000
Total Liabilities and Stockholders’ Equity $305,000
Financial Statement Analysis
FOR INSTRUCTOR USE ONLY
14 – 25
MC 120. (Cont.) Income Statement
Sales $ 110,000
Cost of goods sold 66,000
Gross profit 44,000
Operating expenses 30,000
Net income $ 14,000
Number of shares of common stock 6,000
Market price of common stock $20
Dividends per share .50
What is the accounts receivable turnover for Ortiz?
a. 1.3 times
b. 1.1 times
c. 2.8 times
d. 12.7 times
121. The following information pertains to Ortiz Company. Assume that all balance sheet
amounts represent both average and ending balance figures. Assume that all sales were
on credit. Assets
Cash and short-term investments $ 45,000
Accounts receivable (net) 25,000
Inventory 12,000
Property, plant and equipment 210,000
Total Assets $292,000
Liabilities and Stockholders’ Equity
Current liabilities $ 50,000
Long-term liabilities 90,000
Stockholders’ equity—common 152,000
Total Liabilities and Stockholders’ Equity $292,000
Income Statement
Sales $ 120,000
Cost of goods sold 66,000
Gross profit 54,000
Operating expenses 30,000
Net income $ 24,000
Number of shares of common stock 6,000
Market price of common stock $20
Dividends per share .50
Test Bank for Financial Accounting, Ninth Edition
14 – 26
MC 121. (Cont.)
What is the inventory turnover for Ortiz?
a. 3,2 times
b. 5.5 times
c. 11 times
d. 0.18 times
122. The following information pertains to Ortiz Company. Assume that all balance sheet
amounts represent both average and ending balance figures. Assume that all sales were
on credit. Assets
Cash and short-term investments $ 45,000
Accounts receivable (net) 30,000
Inventory 40,000
Property, plant and equipment 310,000
Total Assets $425,000
Liabilities and Stockholders’ Equity
Current liabilities $ 55,000
Long-term liabilities 110,000
Stockholders’ equity—common 260,000
Total Liabilities and Stockholders’ Equity $425,000
Income Statement
Sales $ 120,000
Cost of goods sold 65,000
Gross profit 55,000
Operating expenses 29,500
Net income $ 25,500
Number of shares of common stock 6,000
Market price of common stock $20
Dividends per share .50
What is the return on assets for Ortiz?
a. 6.0%
b. 5.0%
c. 10.0%
d. 12.0%
Financial Statement Analysis
FOR INSTRUCTOR USE ONLY
14 – 27
123. The following information pertains to Ortiz Company. Assume that all balance sheet
amounts represent both average and ending balance figures. Assume that all sales were
on credit. Assets
Cash and short-term investments $ 45,000
Accounts receivable (net) 25,000
Inventory 20,000
Property, plant and equipment 310,000
Total Assets $400,000
Liabilities and Stockholders’ Equity
Current liabilities $ 50,000
Long-term liabilities 90,000
Stockholders’ equity—common 260,000
Total Liabilities and Stockholders’ Equity $400,000
Income Statement
Sales $ 300,000
Cost of goods sold 66,000
Gross profit 234,000
Operating expenses 27,000
Net income $ 207,000
Number of shares of common stock 6,000
Market price of common stock $20
Dividends per share .50
What is the profit margin for Ortiz?
a. 113%
b. 28.2%
c. 69%
d. 78%
124. The following information pertains to Ortiz Company. Assume that all balance sheet
amounts represent both average and ending balance figures. Assume that all sales were
on credit. Assets
Cash and short-term investments $ 45,000
Accounts receivable (net) 25,000
Inventory 20,000
Property, plant and equipment 270,000
Total Assets $360,000
Liabilities and Stockholders’ Equity
Current liabilities $ 50,000
Long-term liabilities 90,000
Stockholders’ equity—common 220,000
Total Liabilities and Stockholders’ Equity $360,000
Test Bank for Financial Accounting, Ninth Edition
FOR INSTRUCTOR USE ONLY
14 – 28
MC 124. (Cont.) Income Statement
Sales $ 150,000
Cost of goods sold 66,000
Gross profit 84,000
Operating expenses 29,000
Net income $ 55,000
Number of shares of common stock 6,000
Market price of common stock $20
Dividends per share .50
What is the return on common stockholders’ equity for Ortiz?
a. 25%
b. 50%
c. 12.5%
d. 15.3%
125. The following information pertains to Ortiz Company. Assume that all balance sheet
amounts represent both average and ending balance figures. Assume that all sales were
on credit. Assets
Cash and short-term investments $ 45,000
Accounts receivable (net) 25,000
Inventory 20,000
Property, plant and equipment 210,000
Total Assets $300,000
Liabilities and Stockholders’ Equity
Current liabilities $ 50,000
Long-term liabilities 90,000
Stockholders’ equity—common 160,000
Total Liabilities and Stockholders’ Equity $300,000
Income Statement
Sales $ 100,000
Cost of goods sold 55,000
Gross profit 45,000
Operating expenses 15,000
Net income $ 30,000
Number of shares of common stock 6,000
Market price of common stock $30
Dividends per share .50
Financial Statement Analysis
14 – 29
MC 125. (Cont.)
What is the price-earnings ratio for Ortiz?
a. 6.0 times
b. 1.1 times
c. 5 times
d. 5.5 times
126. The following information pertains to Rural Company. Assume that all balance sheet
amounts represent both average and ending balance figures. Assume that all sales were
on credit. Assets
Cash and short-term investments $ 40,500
Accounts receivable (net) 30,000
Inventory 27,000
Property, plant and equipment 215,000
Total Assets $312,500
Liabilities and Stockholders’ Equity
Current liabilities $ 60,000
Long-term liabilities 75,000
Stockholders’ equity—common 177,500
Total Liabilities and Stockholders’ Equity $312,500
Income Statement
Sales $ 90,000
Cost of goods sold 40,000
Gross profit 50,000
Operating expenses 25,000
Net income $ 25,000
Number of shares of common stock 5,000
Market price of common stock $22
Dividends per share 1.00
What is the return on assets for Rural?
a. 16%
b. 9.7%
c. 8%
d. 17%
Test Bank for Financial Accounting, Ninth Edition
FOR INSTRUCTOR USE ONLY
14 – 30
127. The following information pertains to Rural Company. Assume that all balance sheet
amounts represent both average and ending balance figures. Assume that all sales were
on credit. Assets
Cash and short-term investments $ 40,000
Accounts receivable (net) 30,000
Inventory 25,000
Property, plant and equipment 215,000
Total Assets $310,000
Liabilities and Stockholders’ Equity
Current liabilities $ 60,000
Long-term liabilities 75,000
Stockholders’ equity—common 175,000
Total Liabilities and Stockholders’ Equity $310,000
Income Statement
Sales $ 130,000
Cost of goods sold 45,000
Gross profit 85,000
Operating expenses 25,000
Net income $ 60,000
Number of shares of common stock 5,000
Market price of common stock $22
Dividends per share 1.00
What is the profit margin for Rural?
a. 27.8%
b. 70.6%
c. 65.4%
d. 46.2%
128. The following information pertains to Rural Company. Assume that all balance sheet
amounts represent both average and ending balance figures. Assume that all sales were
on credit. Assets
Cash and short-term investments $ 40,000
Accounts receivable (net) 30,000
Inventory 40,000
Property, plant and equipment 220,000
Total Assets $330,000
Liabilities and Stockholders’ Equity
Current liabilities $ 60,000
Long-term liabilities 70,000
Stockholders’ equity—common 200,000
Total Liabilities and Stockholders’ Equity $330,000
Financial Statement Analysis
FOR INSTRUCTOR USE ONLY
14 – 31
MC 128. (Cont.)
Income Statement
Sales $ 90,000
Cost of goods sold 44,000
Gross profit 46,000
Operating expenses 30,000
Net income $ 16,000
Number of shares of common stock 5,000
Market price of common stock $22
Dividends per share 1.00
What is the return on common stockholders’ equity for Rural?
a. 4.8%
b. 8%
c. 37.5%
d. 16%
129. The following information pertains to Rural Company. Assume that all balance sheet
amounts represent both average and ending balance figures. Assume that all sales were
on credit. Assets
Cash and short-term investments $ 40,000
Accounts receivable (net) 30,000
Inventory 25,000
Property, plant and equipment 215,000
Total Assets $310,000
Liabilities and Stockholders’ Equity
Current liabilities $ 60,000
Long-term liabilities 75,000
Stockholders’ equity—common 175,000
Total Liabilities and Stockholders’ Equity $310,000
Income Statement
Sales $ 95,000
Cost of goods sold 45,000
Gross profit 50,000
Operating expenses 15,000
Net income $ 35,000
Number of shares of common stock 5,000
Market price of common stock $21
Dividends per share 1.00
Test Bank for Financial Accounting, Ninth Edition
14 – 32
MC 129. (Cont.)
What is the price-earnings ratio for Rural?
a. 8 times
b. 4.0 times
c. 7.0 times
d. 3.0 times
130. The following information is available for Oakland Company:
2015 2014
Accounts receivable $ 430,000 $ 460,000
Inventory 280,000 320,000
Net credit sales 2,670,000 1,600,000
Cost of goods sold 1,860,000 1,060,000
Net income 300,000 170,000
The accounts receivable turnover ratio for 2015 is
a. 1.4 times.
b. 6.2 times.
c. 6.0 times.
d. 5.8 times.
131. The following information is available for Oakland Company:
2015 2014
Accounts receivable $ 360,000 $ 400,000
Inventory 340,000 400,000
Net credit sales 2,470,000 1,400,000
Cost of goods sold 1,850,000 1,060,000
Net income 300,000 170,000
The inventory turnover ratio for 2015 is
a. 6.7 times.
b. 5.0 times.
c. 5.4 times.
d. 4.6 times.
Financial Statement Analysis
FOR INSTRUCTOR USE ONLY
14 – 33
132. The following amounts were taken from the financial statements of Leaf Company:
2015 2014
Total assets $800,000 $880,000
Net sales 720,000 650,000
Gross profit 352,000 320,000
Net income 126,000 117,000
Weighted average number of common shares outstanding 90,000 90,000
Market price of common stock $35 $39
The return on assets ratio for 2015 is
a. 15.8%.
b. 15%.
c. 14.3%.
d. 14.5%.
133. The following amounts were taken from the financial statements of Leaf Company:
2015 2014
Total assets $900,000 $1,000,000
Net sales 840,000 650,000
Gross profit 352,000 320,000
Net income 138,600 117,000
Weighted average number of common shares outstanding 90,000 90,000
Market price of common stock $35 $39
The profit margin ratio for 2015 is
a. 15.4%.
b. 44.9%.
c. 16.5%.
d. 10.7%.
134. The following amounts were taken from the financial statements of Leaf Company:
2015 2014
Total assets $800,000 $1,000,000
Net sales 720,000 650,000
Gross profit 352,000 320,000
Net income 150,000 117,000
Weighted average number of common shares outstanding 50,000 90,000
Market price of common stock $64.50 $39
Test Bank for Financial Accounting, Ninth Edition
14 – 34
MC 134. (Cont.)
The price-earnings ratio for 2015 is
a. 21.5 times.
b. 36 times.
c. 4.5 times.
d. 3.0 times.
135. Quasar Corporation had net income of $300,000 and paid dividends to common
stockholders of $40,000 in 2015. The weighted average number of shares outstanding in
2015 was 60,000 shares. Quasar Corporation’s common stock is selling for $35 per share
on the New York Stock Exchange.
Quasar Corporation’s price-earnings ratio is
a. 5.7 times.
b. 7 times.
c. 14 times.
d. 8.1 times.
136. Quasar Corporation had net income of $210,000 and paid dividends to common
stockholders of $63,000 in 2015. The weighted average number of shares outstanding in
2015 was 50,000 shares. Quasar Corporation’s common stock is selling for $30 per share
on the New York Stock Exchange.
Quasar Corporation’s payout ratio for 2015 is
a. 24%.
b. 30%.
c. 26%.
d. $3.33 per share.
137. The following financial statement information is available for Buil Corporation:
2015 2014
Inventory $ 44,000 $ 43,000
Current assets 80,000 106,000
Total assets 432,000 358,000
Current liabilities 25,000 36,000
Total liabilities 102,000 88,000
The current ratio for 2015 is
a. .31:1.
b. 3.2:1.
c. 1.5:1.
d. 4.24:1.
Financial Statement Analysis
FOR INSTRUCTOR USE ONLY
14 – 35
138. The following financial statement information is available for James Corporation:
2015 2014
Net sales $780,000 $697,000
Cost of goods sold 406,000 377,000
Net income 120,000 80,000
Tax expense 48,000 29,000
Interest expense 14,000 14,000
The profit margin ratio for 2015 is
a. 15.4%.
b. 47.9%.
c. 32.1%.
d. 13.5%.
139. The following financial statement information is available for Penn Corporation:
2015 2014
Stockholders’ equity – common $350,000 $270,000
Net sales 784,000 697,000
Cost of goods sold 406,000 377,000
Net income 115,000 80,000
Inc tax expense 48,000 29,000
Interest expense 14,000 14,000
Dividends paid to preferred
stockholders 24,000 20,000
Dividends paid to common
stockholders 15,000 10,000
The return on common stockholders’ equity for 2015 is
a. 24.5%.
b. 32.9%.
c. 26%.
d. 29.4%.
140. The following financial statement information is available for Long Corporation:
2015 2014
Net income $115,000 $ 80,000
Income tax expense 30,000 29,000
Interest expense 18,000 14,000
Dividends paid to preferred
stockholders 22,000 20,000
Dividends paid to preferred
stockholders 15,000 10,000
Test Bank for Financial Accounting, Ninth Edition
14 – 36
MC 140. (Cont.)
The times interest earned for 2015 is
a. 7.4 times.
b. 6.4 times.
c. 9.1 times.
d. 7.8 times.
141. Dean Corporation reported net income $58,000, net sales $500,000, and average assets
$800,000 for 2015. The 2015 profit margin was:
a. 5.8%.
b. 11.6%.
c. 62.5%.
d. 160%.
142. North Company reports the following amounts for 2015:
Net income $ 160,000
Average stockholders’ equity 2,000,000
Preferred dividends 45,000
Par value preferred stock 250,000
The 2015 rate of return on common stockholders’ equity is:
a. 5.8%.
b. 6.6%.
c. 8.0%.
d. 9.1%.
143. Proctor Corporation had beginning inventory $100,000, cost of goods sold $750,000, and
ending inventory $150,000. What was Proctor’s inventory turnover?
a. 3 times.
b. 6 times.
c. 7.5 times.
d. 5 times.
144. In 2015 Rome Corporation reported net income $190,000, interest expense $60,000, and
income tax expense $40,000. Rome’s times interest earned ratio was:
a. 4.2 times.
b. 3.8 times.
c. 3.2 times.
d. 4.8 times.
Financial Statement Analysis
14 – 37
145. Wrapp Company has income before taxes of $350,000 and an extraordinary loss of
$70,000. If the income tax rate is 30% on all items, the income statement should show
income before irregular items and an extraordinary loss, respectively, of:
a. $350,000 and ($70,000)
b. $245,000 and ($24,000)
c. $245,000 and ($49,000)
d. $105,000 and ($21,000)
146. All of the following statements regarding changes in accounting principles are true except:
a. Most changes in accounting principles are only reported in current periods when the
principle change takes place.
b. Changes in accounting principles are allowed when new principles are preferable to
old ones.
c. Most changes in accounting principles are retroactively reported.
d. Consistency is one of the biggest concerns when a change in accounting principle is
undertaken.
147. Beta’s Bunny Barn has experienced a $80,000 loss due to tornado damage to its
inventory. Tornados have never before occurred in this area. Assuming that the
company’s tax rate is 30%, what amount will be reported for this loss on the income
statement?
a. $80,000
b. $56,000
c. $24,000
d. $72,000
148. Flite Company reported income before taxes of $900,000 and an extraordinary loss of
$250,000. Assume that the company’s tax rate is 35%. What amounts will be reported on
the income statement for income before irregular items and extraordinary items,
respectively?
a. $585,000 and $250,000
b. $585,000 and $162,500
c. $650,000 and $250,000
d. $650,000 and $162,500
Test Bank for Financial Accounting, Ninth Edition
14 – 38
149. Kreig Corporation has income before taxes of $900,000 and an extraordinary gain of
$300,000. If the income tax rate is 35% on all items, the income statement should show
income before irregular items and extraordinary items, respectively, of
a. $600,000 and $300,000.
b. $600,000 and $195,000.
c. $585,000 and $300,000.
d. $585,000 and $195,000.
150. Pan Inc. has an investment in available-for-sale securities of $70,000. This investment
experienced an unrealized loss of $6,000 during the current year. Assuming a 35% tax
rate, the effect of this loss on comprehensive income will be
a. no effect.
b. $70,000 increase.
c. $24,500 decrease.
d. $6,000 decrease.
151. The disposal of a significant component of a business is called
a. a change in accounting principle.
b. an extraordinary item.
c. an other expense.
d. discontinued operations.
152. MECHE Company reports income before income taxes of $2,500,000 and had an extra-
ordinary loss of $800,000. If the tax rate is 35%,
a. the income before the extraordinary item is $1,190,000.
b. the extraordinary loss would be reported on the income statement at $800,000.
c. the income before the extraordinary item is $1,625,000.
d. the extraordinary loss will be reported at $280,000.
153. Beacon, Inc. disposes of an unprofitable segment of its business. The operation of the
segment suffered a $350,000 loss in the year of disposal. The loss on disposal of the
segment was $150,000. If the tax rate is 30%, and income before income taxes was
$2,300,000,
a. the income tax expense on the income before discontinued operations is $540,000.
b. the income from continuing operations is $1,610,000.
c. net income is $1,800,000.
d. the losses from discontinued operations are reported net of income taxes at $150,000.
Financial Statement Analysis
14 – 39
154. Each of the following is an extraordinary item except the
a. effects of major casualties, if rare in the area.
b. effects of a newly enacted law or regulation.
c. expropriation of property by a foreign government.
d. losses attributable to labor strikes.
155. The discontinued operations section of the income statement refers to
a. discontinuance of a product line.
b. the income or loss on products that have been completed and sold.
c. obsolete equipment and discontinued inventory items.
d. the disposal of a significant component of a business.
156. Which one of the following would be classified as an extraordinary item?
a. Expropriation of property by a foreign government
b. Losses attributed to a labor strike
c. Write-down of inventories
d. Gains or losses from sales of equipment
157. A loss on the write down of obsolete inventory should be reported as
a. “other expenses and losses.”
b. part of discontinued operations.
c. an operating expense.
d. an extraordinary item.
158. If an item meets one (but not both) of the criteria for an extraordinary item, it
a. only needs to be disclosed in the footnotes of the financial statements.
b. may be treated as sales revenue (if it is a gain) and as an operating expense (if it is a
loss).
c. is reported as an “other revenue or gain” or “other expense and loss,” net of tax.
d. is reported at its gross amount as an “other revenue or gain” or “other expense or
loss.”
159. The order of presentation of nontypical items that may appear on the income statement is
a. Extraordinary items, Discontinued operations, Other revenues and expenses.
b. Discontinued operations, Extraordinary items, Other revenues and expenses.
c. Other revenues and expenses, Discontinued operations, Extraordinary items.
d. Other revenues and expenses, Extraordinary items, Discontinued operations.
160. Each of the following is a factor affecting quality of earnings except
a. alternative accounting methods.
b. improper recognition.
c. pro forma income.
d. extraordinary items.
Test Bank for Financial Accounting, Ninth Edition
14 – 40
161. Comparisons can be made on each of the following bases except
a. industry averages.
b. intercompany basis.
c. intracompany basis.
d. Each of these is a basis for comparison.
162. Comparisons of data within a company are an example of the following comparative
basis:
a. Industry averages
b. Intercompany
c. Intracompany
d. Interregional
163. Carter Corporation reported net sales of $250,000, $400,000, and $600,000 in the years
2013, 2014, and 2015 respectively. If 2013 is the base year, what is the trend percentage
for 2015?
a. 100%
b. 40%
c. 140%
d. 240%
164. In vertical analysis, the base amount for each income statement item is
a. gross profit.
b. net income.
c. net sales.
d. sales.
165. When performing vertical analysis, the base amount for administrative expense is
generally
a. administrative expense in a previous year.
b. net sales.
c. gross profit.
d. fixed assets.
166. Ratios that measure the short-term ability of the company to pay its maturing obligations
are
a. liquidity ratios.
b. profitability ratios.
c. solvency ratios.
d. trend ratios.
Financial Statement Analysis
14 – 41
167. What type of ratios best measure the short-term ability of the enterprise to pay its
maturing obligations and to meet unexpected needs for cash?
a. Leverage
b. Solvency
c. Profitability
d. Liquidity
168. The acid-test ratio is also known as the
a. current ratio.
b. quick ratio.
c. fast ratio.
d. times interest earned ratio.
169. The debt to assets ratio
a. is a solvency ratio.
b. is computed by dividing total assets by total debt.
c. measures the total assets provided by stockholders.
d. is a profitability ratio.
170. An extraordinary item is one that
a. occurs infrequently and is uncontrollable in nature.
b. occurs infrequently and is unusual in nature.
c. is material and is unusual in nature.
d. is material and is uncontrollable in nature.
171. Troy, Inc. decided on January 1 to discontinue its telescope manufacturing division. On
July 1, the division’s assets with a book value of $1,260,000 are sold for $840,000.
Operating income from January 1 to June 30 for the division amounted to $130,000.
Ignoring income taxes, what total amount should be reported on Troy’s income statement
for the current year under the caption, Discontinued Operations?
a. $130,000
b. $290,000 loss
c. $420,000 loss
d. $550,000
172. When there has been a change in accounting principle,
a. the old principle should be used in reporting the results of operations for the current
year.
b. the cumulative effect of the change should be reported in the current year’s retained
earnings statement.
c. the change should be reported retroactively.
d. the new principle should be used in reporting the results of operations of the current
year, but there is no change to prior years.
Test Bank for Financial Accounting, Ninth Edition
14 – 42
173. Under IFRS, there is no classification for
a. changes in accounting estimates.
b. changes in accounting principles.
c. discontinued operations.
d. extraordinary items.
174. The accounting for each of the following is the same under IFRS and GAAP except for
a. extraordinary items.
b. discontinued operations.
c. changes in accounting principles.
d. changes in accounting estimates.
175. Distinguishing normal levels of income from irregular items is of interest for the
FASB IASB
a. no no
b. no yes
c. yes no
d. yes yes
176. All revenue and expense items are considered ordinary in nature under
a. both IFRS and GAAP.
b. GAAP.
c. IFRS.
d. neither IFRS or GAAP.
177. Under IFRS, the statement of comprehensive income can be prepared under
a. the one-statement approach only.
b. the two-statement approach only.
c. either the one-statement approach or the two-statement approach
d. either the two-statement approach or the stockholders’ equity statement approach.
178. Under IFRS, the components of other comprehensive income can be reported in each of
the following ways except
a. the one-statement approach.
b. the two-statement approach.
c. the statement of stockholders’ equity approach.
d. All of these answer choices are correct.
Financial Statement Analysis
FOR INSTRUCTOR USE ONLY
14 – 43
179. Under IFRS, which of the following is not an acceptable way of displaying the
components of other comprehensive income?
a. Combined statement of retained earnings
b. One-statement approach
c. Two-statement approach
d. All of these answer choices are correct.
180. Under IFRS, comprehensive income may be displayed (reported) in
a. the equity section of the statement of financial position.
b. the one-statement or the two-statement approach.
c. two-statement approach only.
d. the retained earnings statement.
Answers to Multiple Choice Questions
Item
Ans.
Item
Ans.
Item
Ans.
Item
Ans.
Item
Ans.
Item
Ans.
Item
Ans.
Test Bank for Financial Accounting, Ninth Edition
FOR INSTRUCTOR USE ONLY
14 – 44
BRIEF EXERCISES
BE 181
The following items were taken from the financial statements of Henager, Inc., over a three–year
period:
Item 2016 2015 2014
Net Sales $355,000 $340,000 $300,000
Cost of Goods Sold 214,000 202,000 186,000
Gross Profit $141,000 $138,000 $114,000
Instructions
Compute the following for each of the above time periods.
a. The amount and percentage change from 2014 to 2015.
b. The amount and percentage change from 2015 to 2016.
BE 182
If Dolly Company had net income of $550,000 in 2016 and it experienced a 25% increase in net
income over 2015, what was its 2015 net income?
BE 183
Horizontal analysis (trend analysis) percentages for Staas Company’s sales, cost of goods sold,
and expenses are listed here.
Horizontal Analysis 2016 2015 2014
Sales 98.2% 104.8% 100.0%
Cost of goods sold 102.5 98.0 100.0
Expenses 108.6 96.4 100.0
Financial Statement Analysis
14 – 45
BE 183 (Cont.)
Instructions
Explain whether Staas’ net income increased, decreased, or remained unchanged over the 3–
year period.
BE 184
Using the following operating data for Complex Corporation, illustrate horizontal analysis.
2015 2014
Net sales $350,000 $300,000
Cost of goods sold 240,000 160,000
Operating expenses 80,000 120,000
Net income 30,000 20,000
BE 185
Using the following operating data for Complex Corporation, prepare a schedule showing a
vertical analysis for 2015.
2015 2014
Net sales $360,000 $320,000
Cost of goods sold 210,000 180,000
Operating expenses 112,000 100,000
Net income 38,000 40,000
Test Bank for Financial Accounting, Ninth Edition
FOR INSTRUCTOR USE ONLY
14 – 46
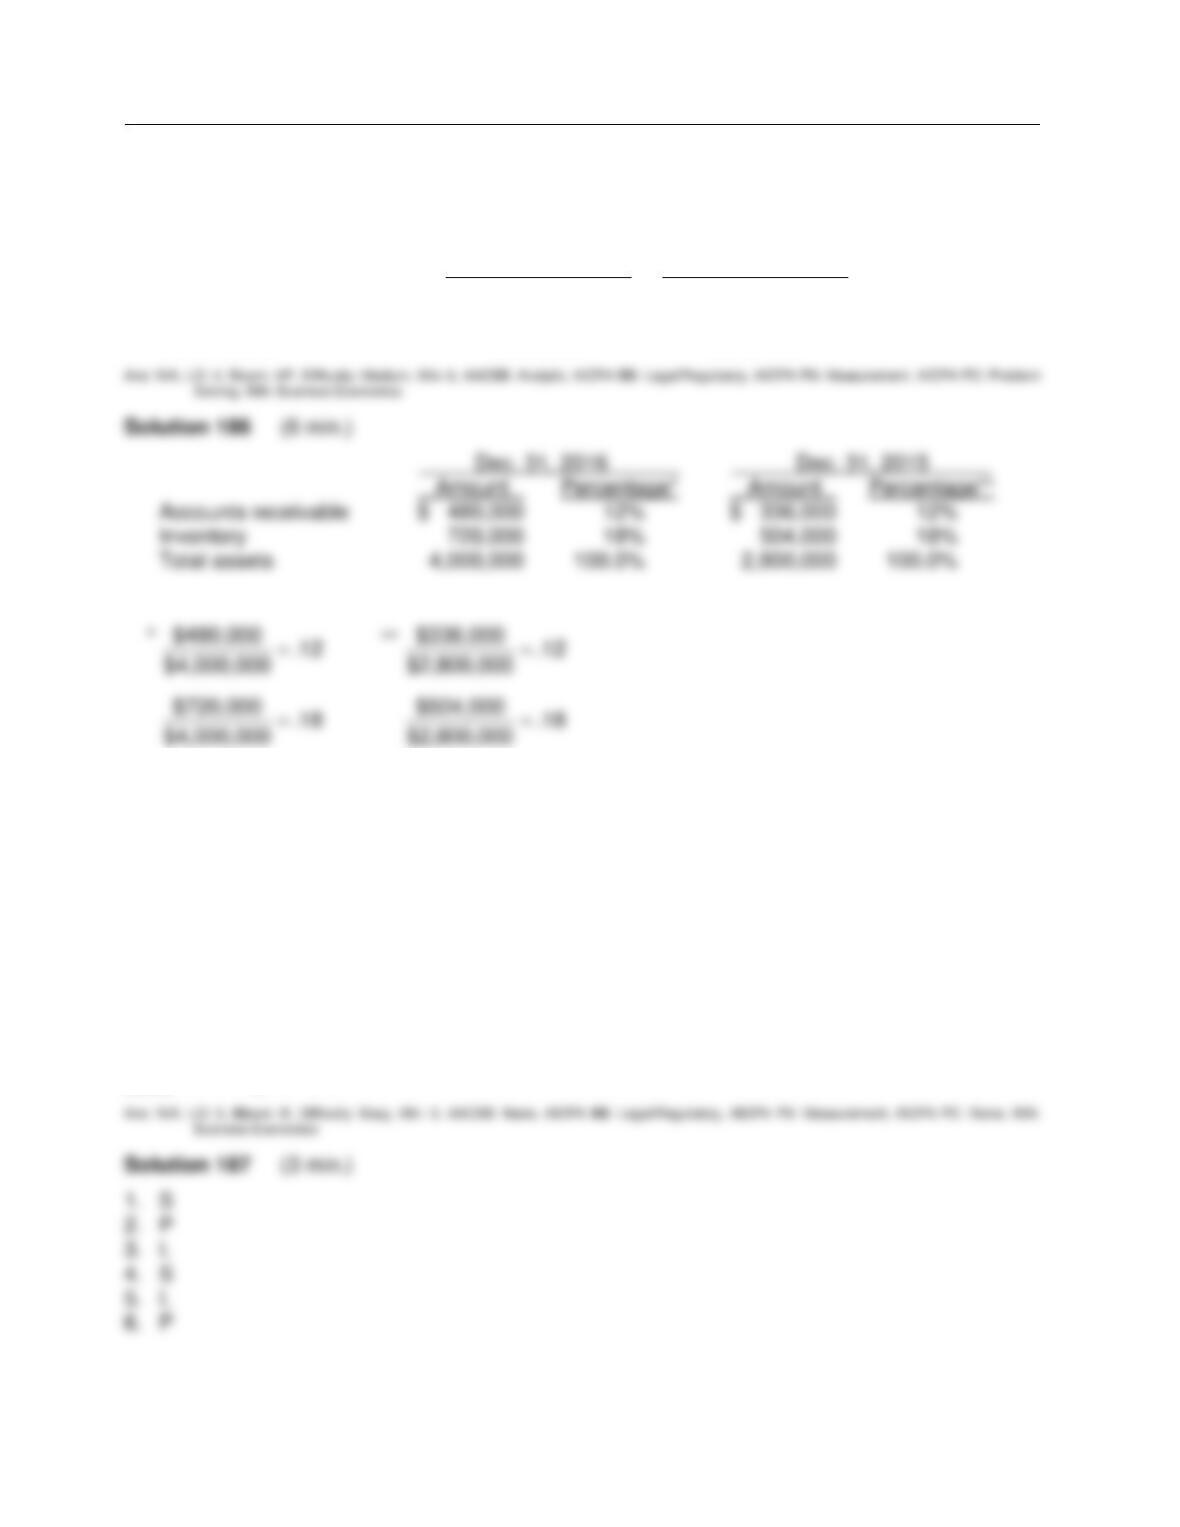
BE 186
Using these data from the comparative balance sheet of Banner Company, perform vertical
analysis.
December 31, 2016 December 31, 2015
Accounts receivable $ 480,000 $ 336,000
Inventory 720,000 504,000
Total assets 4,000,000 2,800,000
BE 187
For each of the ratios listed below, indicate by the appropriate code letter, whether it is a liquidity
ratio (L), a profitability ratio (P), or a solvency ratio (S).
____ 1. Times interest earned ratio
____ 2. Asset turnover
____ 3. Accounts receivable turnover
____ 4. Debt to assets ratio
____ 5. Current ratio
____ 6. Payout ratio
Financial Statement Analysis
FOR INSTRUCTOR USE ONLY
14 – 47
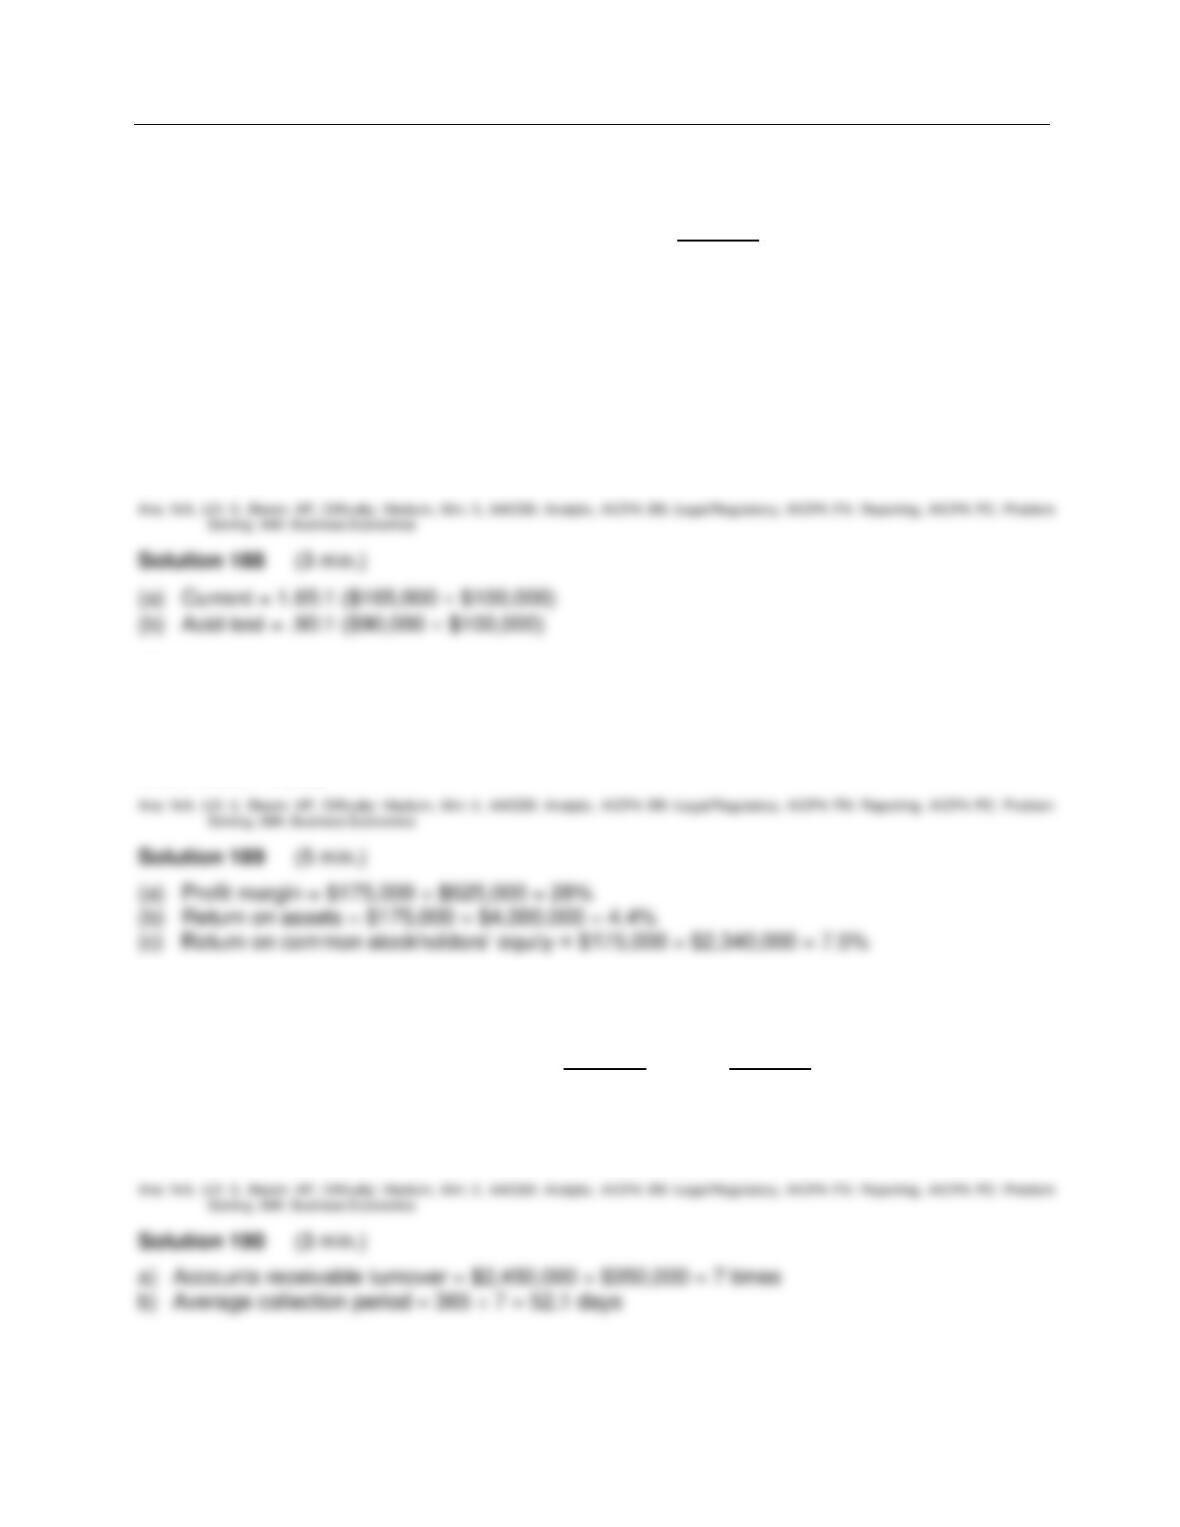
BE 188
Selected financial statement data for Freeman Company are presented below.
12/31/15
Cash $ 10,000
Short-term investments 20,000
Accounts receivable 60,000
Inventories 75,000
Total current liabilities 100,000
Instructions
Compute the following ratios at December 31, 2015:
(a) Current.
(b) Acid-test.
BE 189
Noble Company had net income of $175,000 and net sales of $625,000 in 2015. The company’s
total assets for 2014/2015 averaged $4,000,000. Its common stockholders’ equity for the period
averaged $2,340,000. Calculate (a) profit margin, (b) return on assets, and (c) return on common
stockholders’ equity.
BE 190
Shelly Company reported the following financial information:
12/31/15 12/31/14
Accounts receivable $ 340,000 $ 360,000
Net credit sales 2,450,000 2,420,000
Compute (a) the accounts receivable turnover and (b) the average collection period for 2015.
Test Bank for Financial Accounting, Ninth Edition
FOR INSTRUCTOR USE ONLY
14 – 48
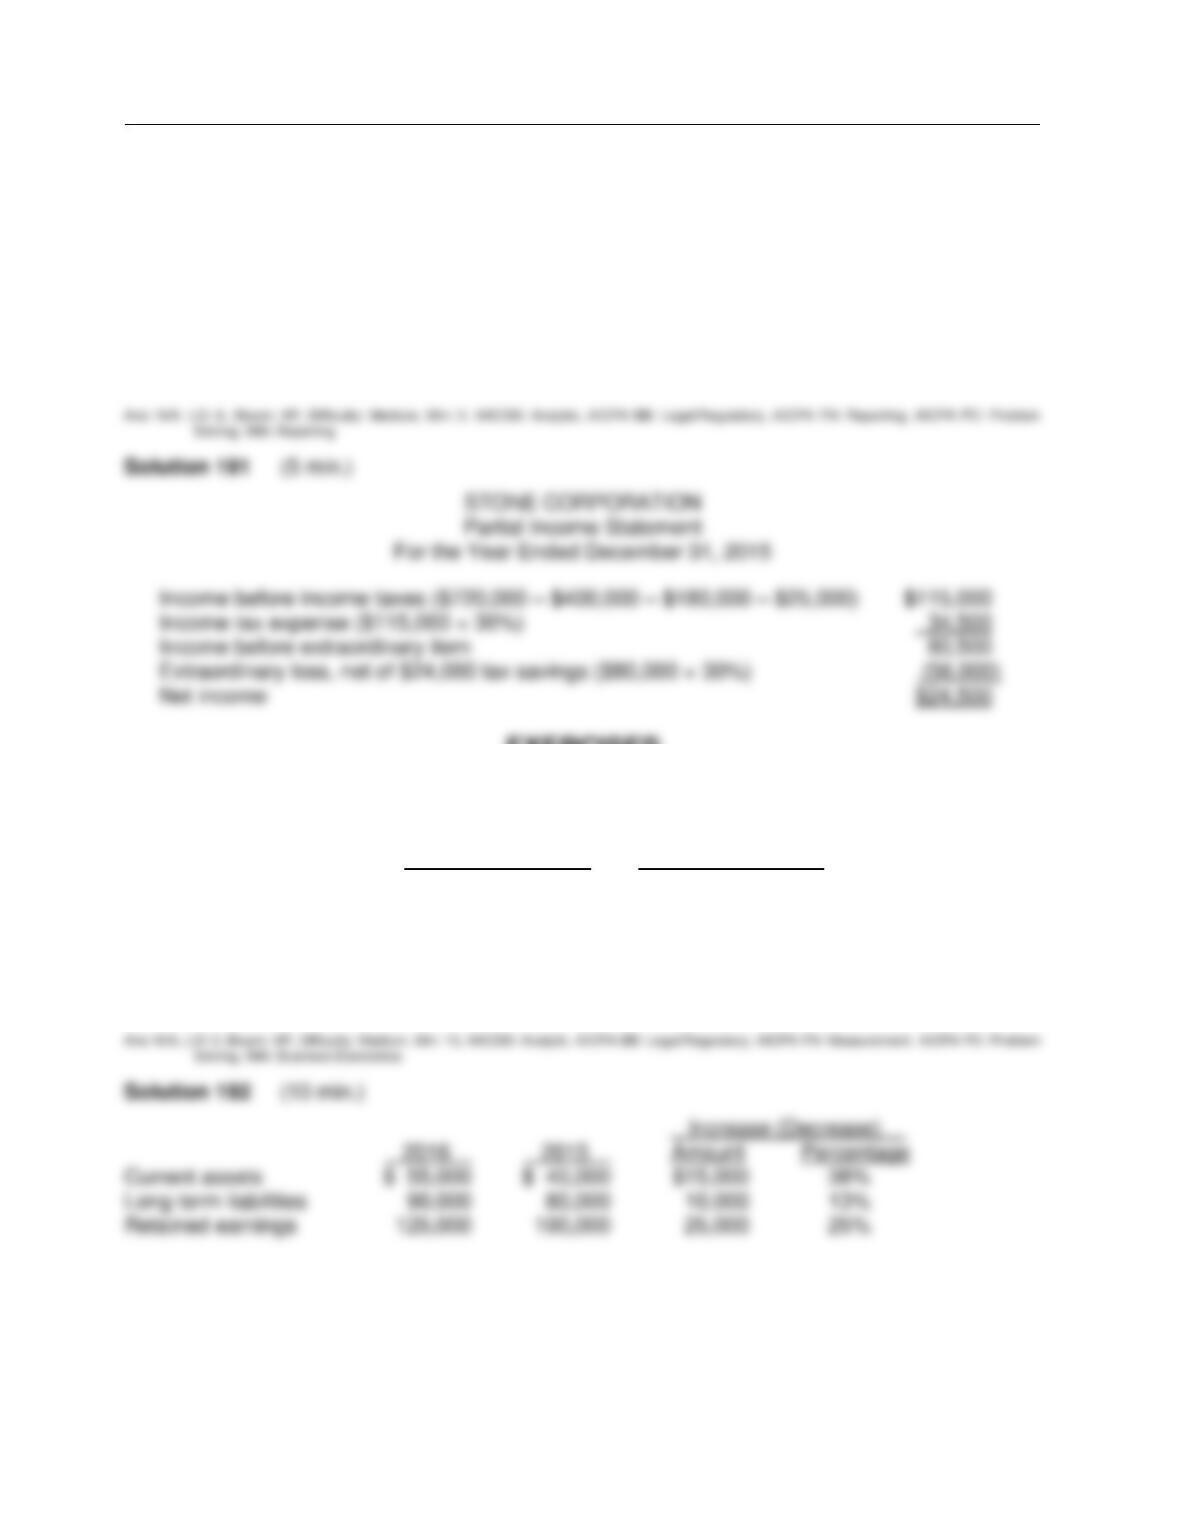
BE 191
Prepare a partial income statement, beginning with income before income taxes using the
following information for Stone Corporation for the fiscal year ended December 31, 2015:
Sales $720,000
Extraordinary loss 80,000
Operating expenses 180,000
Cost of goods sold 400,000
Loss on sale of land 25,000
Stone Corporation is subject to a 30% income tax rate.
Ex. 192
Selected financial information for Trant Corporation is presented below.
December 31, 2016 December 31, 2015
Current assets $ 55,000 $ 40,000
Long-term liabilities 90,000 80,000
Retained earnings 125,000 100,000
Instructions
Prepare a schedule showing a horizontal analysis for 2016 using 2015 as the base year.
Financial Statement Analysis
FOR INSTRUCTOR USE ONLY
14 – 49
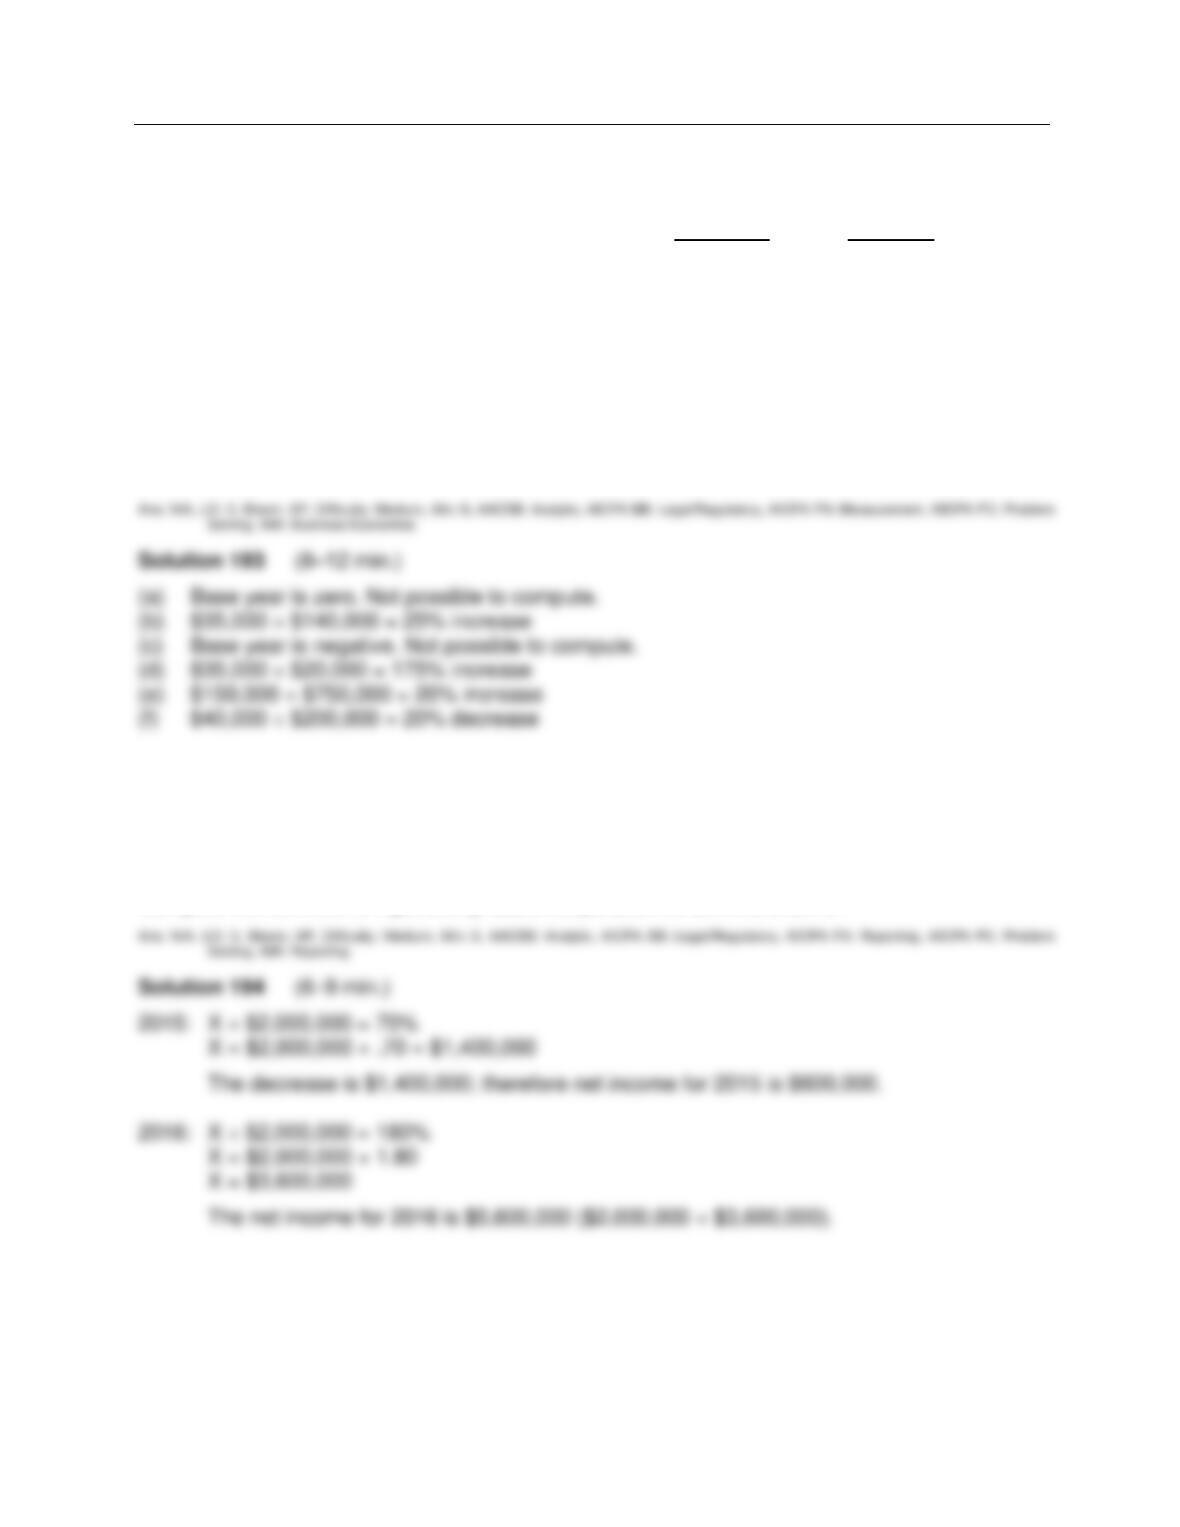
Ex. 193
Comparative information taken from the Foren Company financial statements is shown below:
2016 2015
(a) Notes receivable $ 20,000 $ -0-
(b) Accounts receivable 175,000 140,000
(c) Retained earnings 30,000 (40,000)
(d) Income taxes payable 55,000 20,000
(e) Sales 900,000 750,000
(f) Operating expenses 160,000 200,000
Instructions
Using horizontal analysis, show the percentage change from 2015 to 2016 with 2015 as the base
year.
Ex. 194
Ladle Corporation had net income of $2,000,000 in 2014. Using 2014 as the base year, net
income decreased by 70% in 2015 and increased by 180% in 2016.
Instructions
Compute the net income reported by Ladle Corporation for 2015 and 2016.
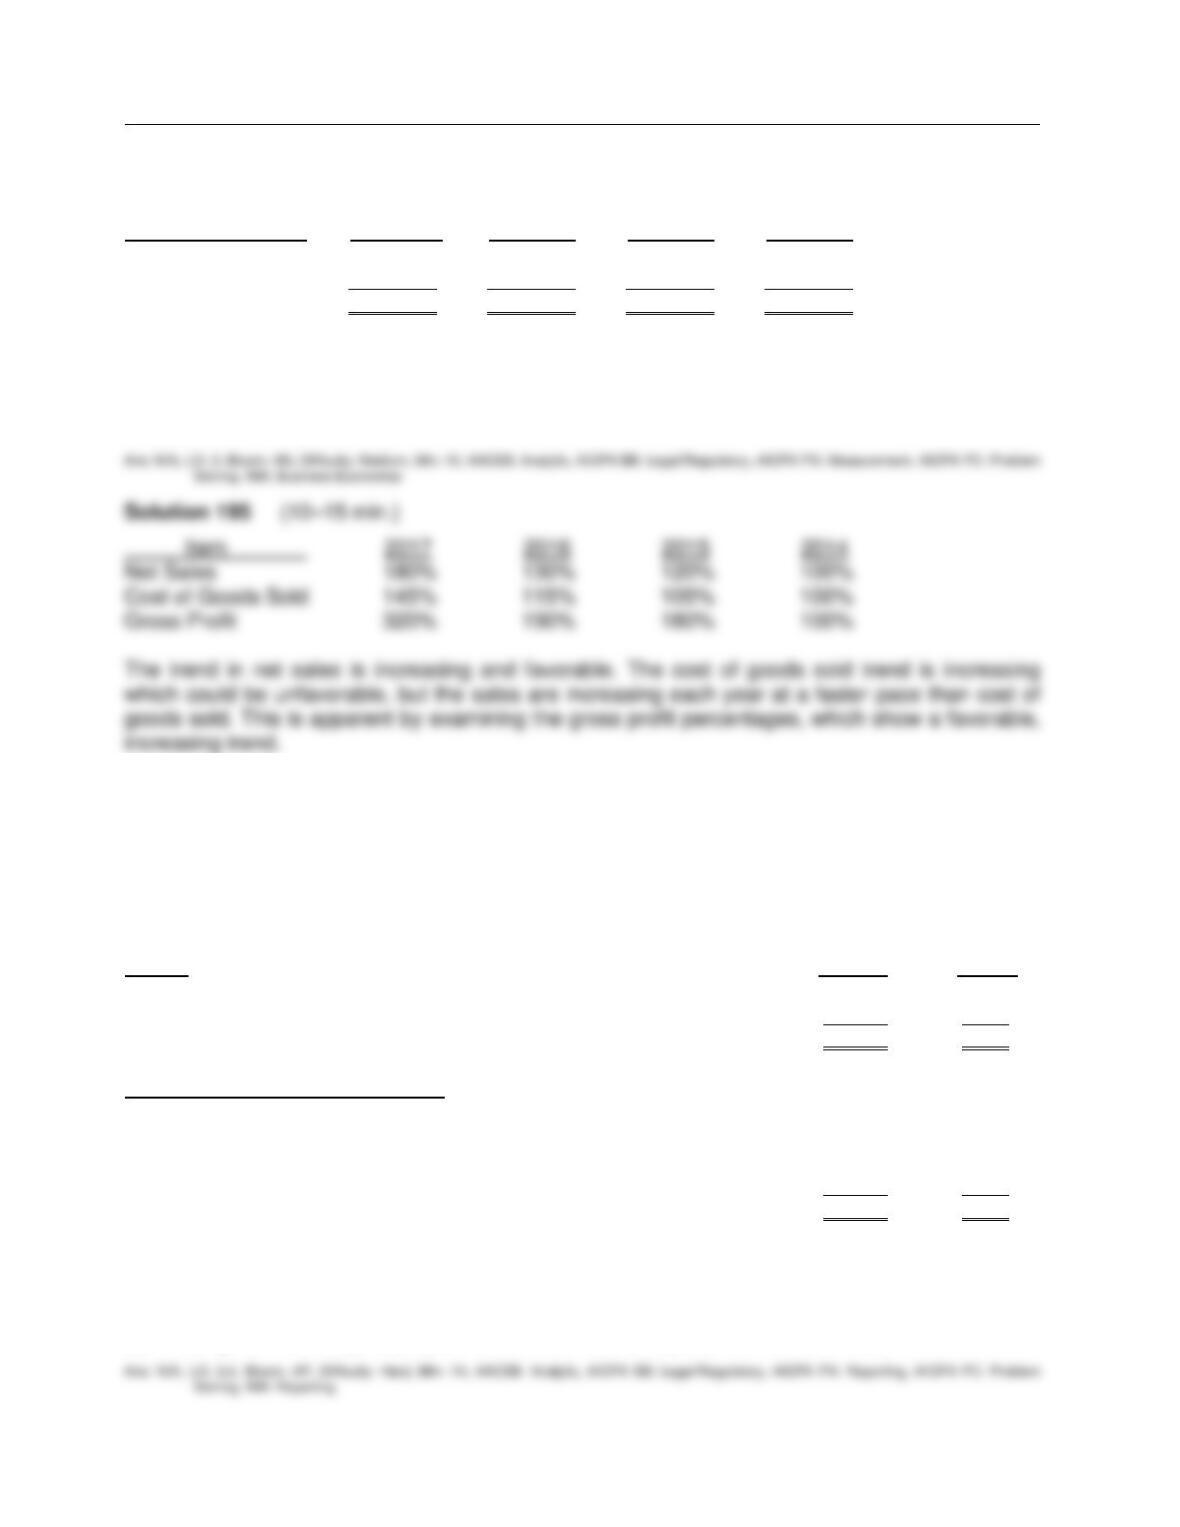
Test Bank for Financial Accounting, Ninth Edition
FOR INSTRUCTOR USE ONLY
14 – 50
Ex. 195
The following items were taken from the financial statements of Rug, Inc., over a four-year period:
Item 2017 2016 2015 2014
Net Sales $900,000 $650,000 $600,000 $500,000
Cost of Goods Sold 580,000 460,000 420,000 400,000
Gross Profit $320,000 $190,000 $180,000 $100,000
Instructions
Using horizontal analysis and 2014 as the base year, compute the trend percentages for net
sales, cost of goods sold, and gross profit. Explain whether the trends are favorable or
unfavorable for each item.
Ex. 196
The comparative balance sheet of Nathan Company appears below:
NATHAN COMPANY
Comparative Balance Sheet
December 31
———————————————————————————————————————————
Assets 2016 2015
Current assets …………………………………………………………………………. $ 420 $333
Plant assets …………………………………………………………………………….. 780 567
Total assets …………………………………………………………………………….. $1,200 $900
Liabilities and stockholders’ equity
Current liabilities ………………………………………………………………………. $ 168 $144
Long-term debt ………………………………………………………………………… 300 162
Common stock ………………………………………………………………………… 432 306
Retained earnings ……………………………………………………………………. 300 288
Total liabilities and stockholders’ equity ………………………………….. $1,200 $900
Instructions
(a) Using horizontal analysis, show the percentage change for each balance sheet item using
2015 as a base year.
(b) Using vertical analysis, prepare a common size comparative balance sheet.
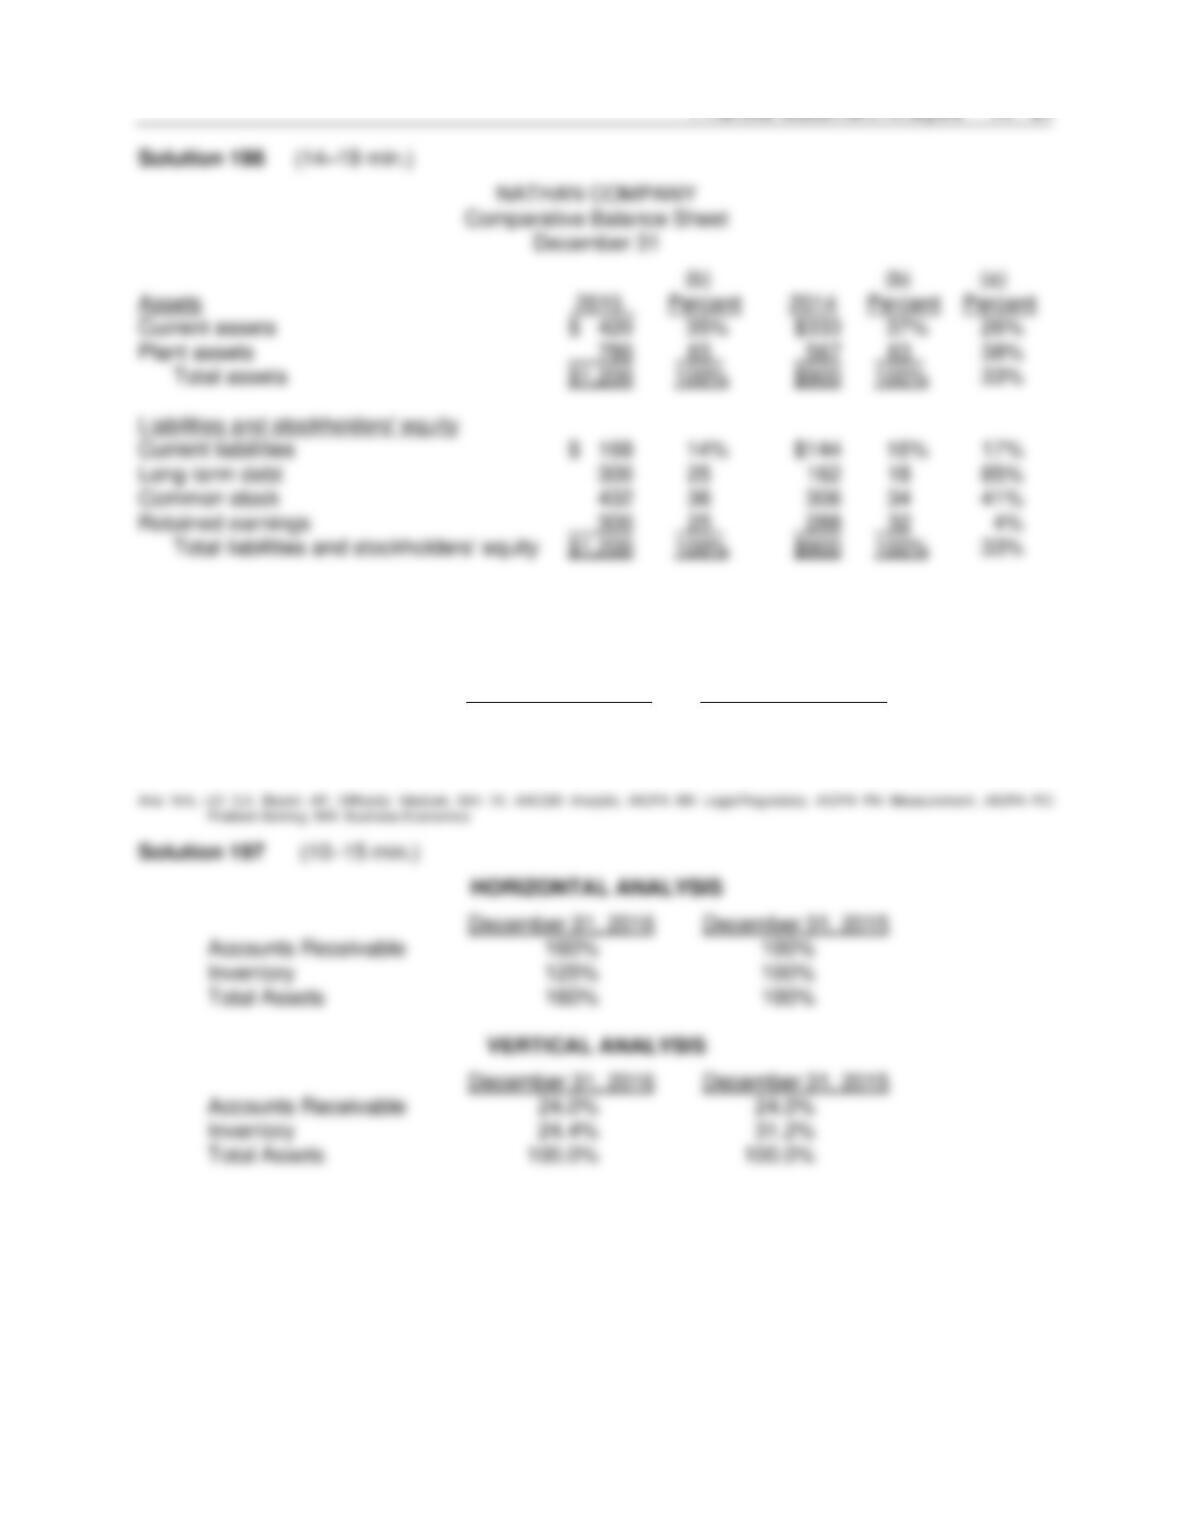
Financial Statement Analysis
FOR INSTRUCTOR USE ONLY
14 – 51
Ex. 197
Using the following selected items from the comparative balance sheet of Ames Company,
illustrate horizontal and vertical analysis.
December 31, 2016 December 31, 2015
Accounts Receivable $ 960,000 $ 600,000
Inventory 975,000 780,000
Total Assets 4,000,000 2,500,000
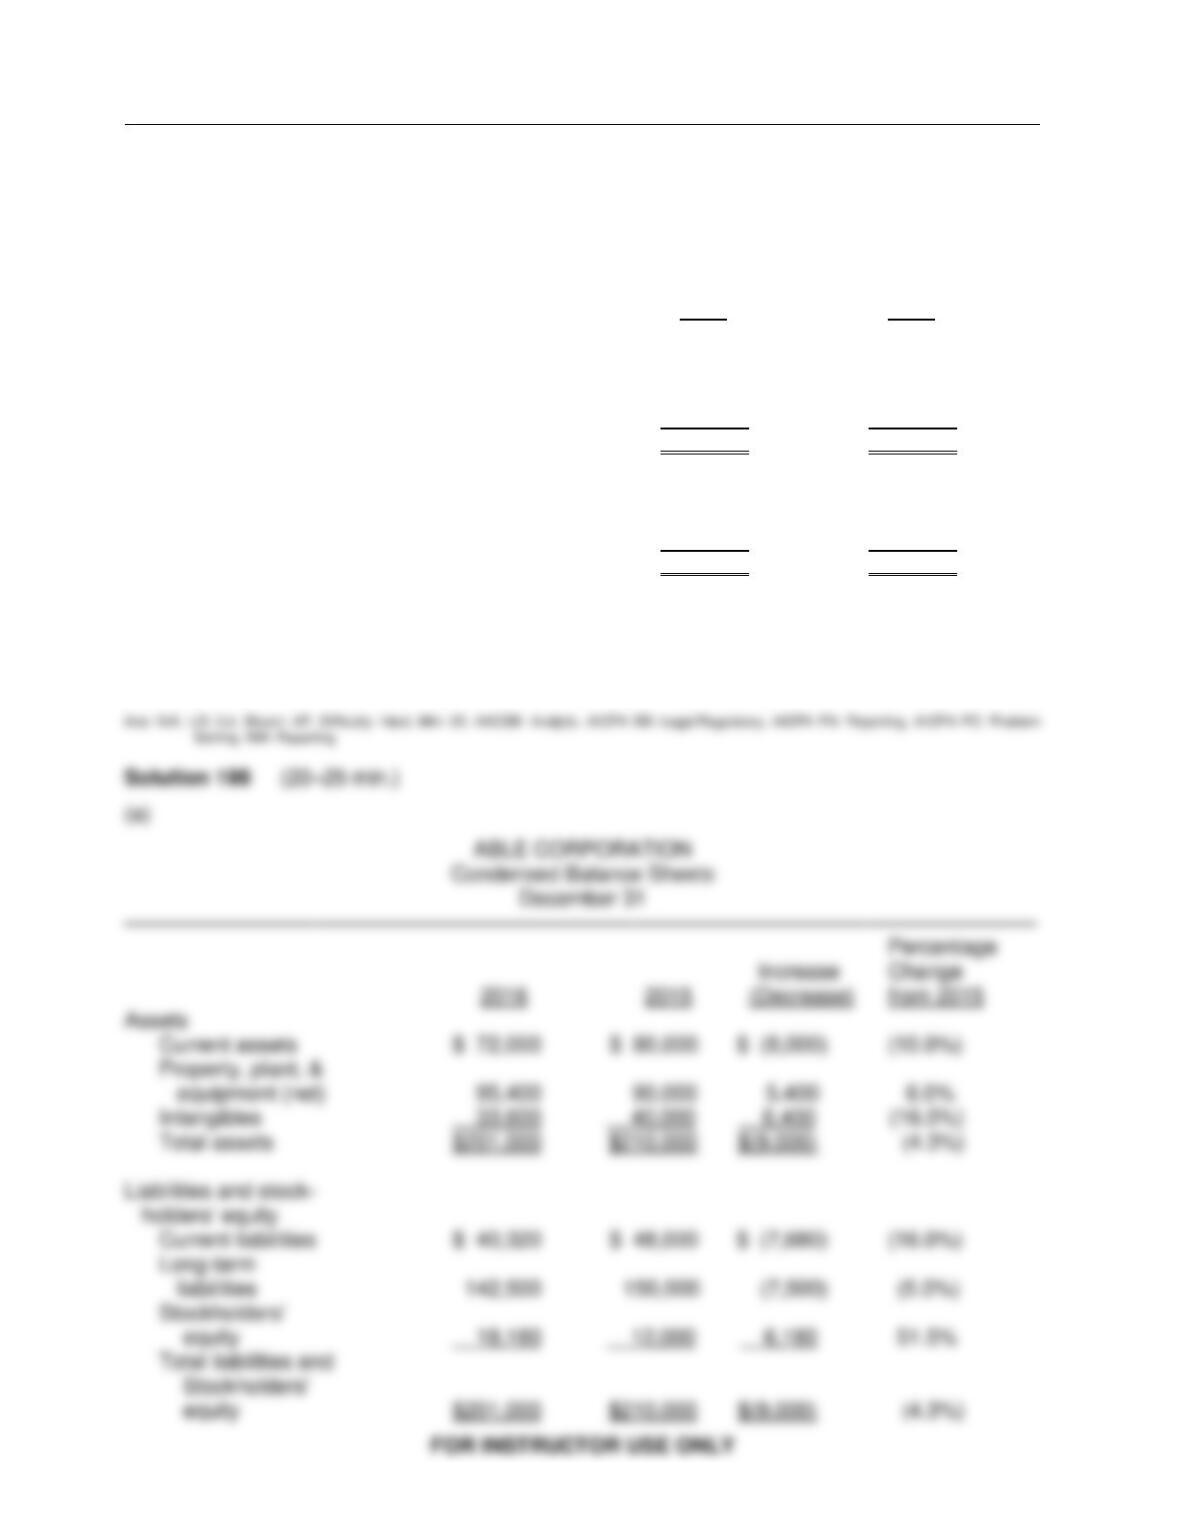
Test Bank for Financial Accounting, Ninth Edition
14 – 52
Ex. 198
The comparative condensed balance sheets of Able Corporation are presented below.
ABLE CORPORATION
Comparative Condensed Balance Sheets
December 31
2016 2015
Assets
Current assets $ 72,000 $ 80,000
Property, plant, and equipment (net) 95,400 90,000
Intangibles 33,600 40,000
Total assets $201,000 $210,000
Liabilities and stockholders’ equity
Current liabilities $ 40,320 $ 48,000
Long-term liabilities 142,500 150,000
Stockholders’ equity 18,180 12,000
Total liabilities and stockholders’ equity $201,000 $210,000
Instructions
(a) Prepare a horizontal analysis of the balance sheet data for Able Corporation using 2015 as a
base.
(b) Prepare a vertical analysis of the balance sheet data for Able Corporation in columnar form
for 2016.
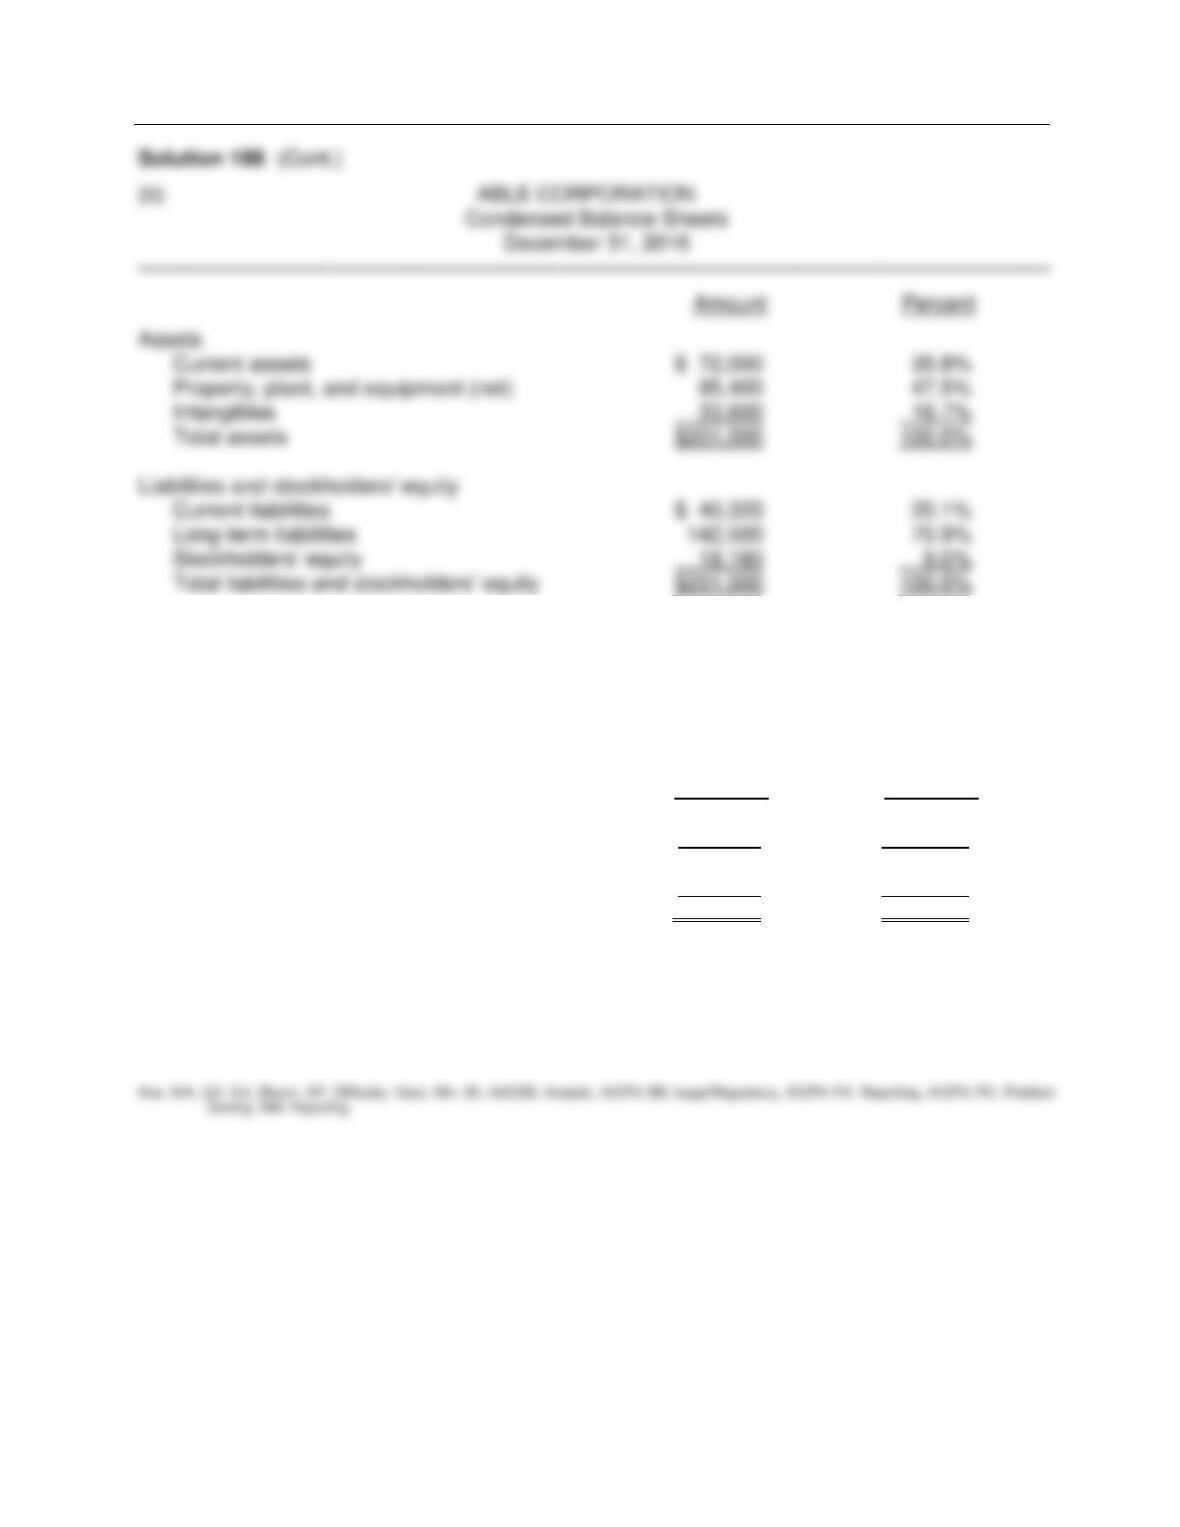
Financial Statement Analysis
FOR INSTRUCTOR USE ONLY
14 – 53
Ex. 199
The comparative condensed income statements of Marks Corporation are shown below.
MARKS CORPORATION
Comparative Condensed Income Statements
For the Years Ended December 31
2016 2015
Net sales $620,000 $500,000
Cost of goods sold 450,000 400,000
Gross profit 170,000 100,000
Operating expenses 54,000 40,000
Net income $116,000 $ 60,000
Instructions
(a) Prepare a horizontal analysis of the income statement data for Marks Corporation using
2015 as a base. (Show the amounts of increase or decrease.)
(b) Prepare a vertical analysis of the income statement data for Marks Corporation in columnar
form for both years.
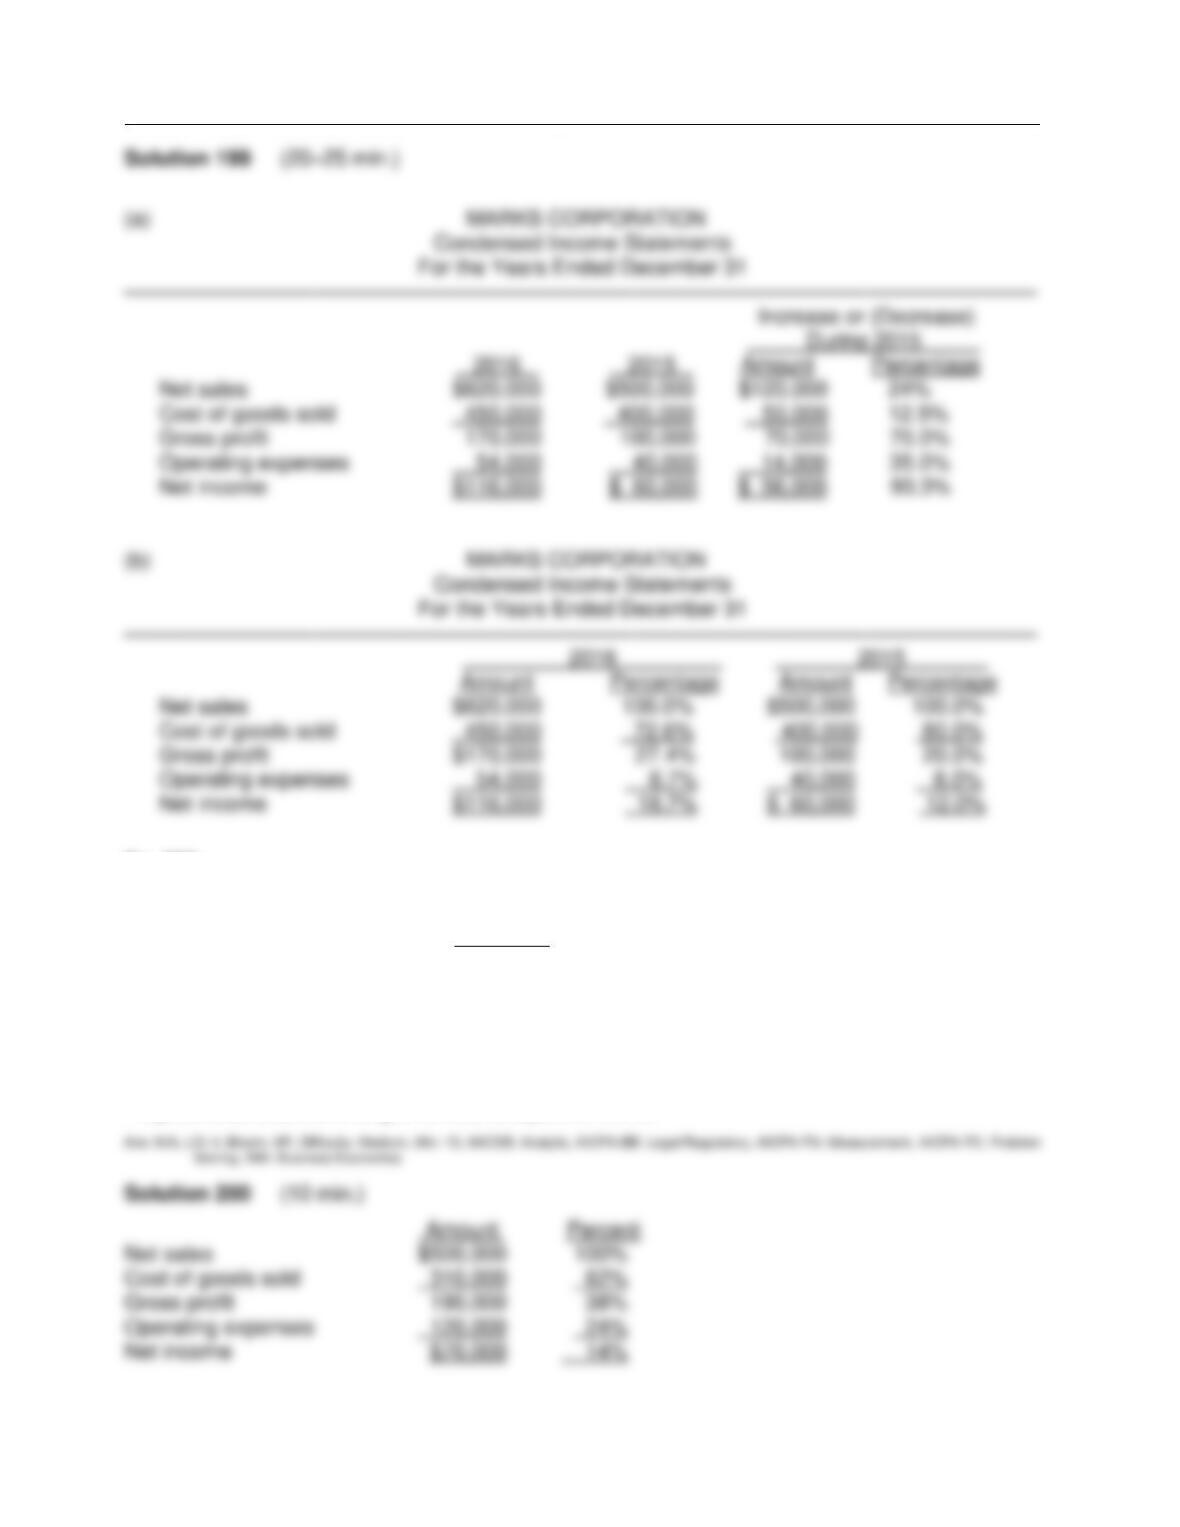
Test Bank for Financial Accounting, Ninth Edition
FOR INSTRUCTOR USE ONLY
14 – 54
Ex. 200
Operating data for Lewis Corporation are presented below.
2015
Net sales $500,000
Cost of goods sold 310,000
Operating expenses 120,000
Net income 70,000
Instructions
Prepare a schedule showing a vertical analysis for 2015.
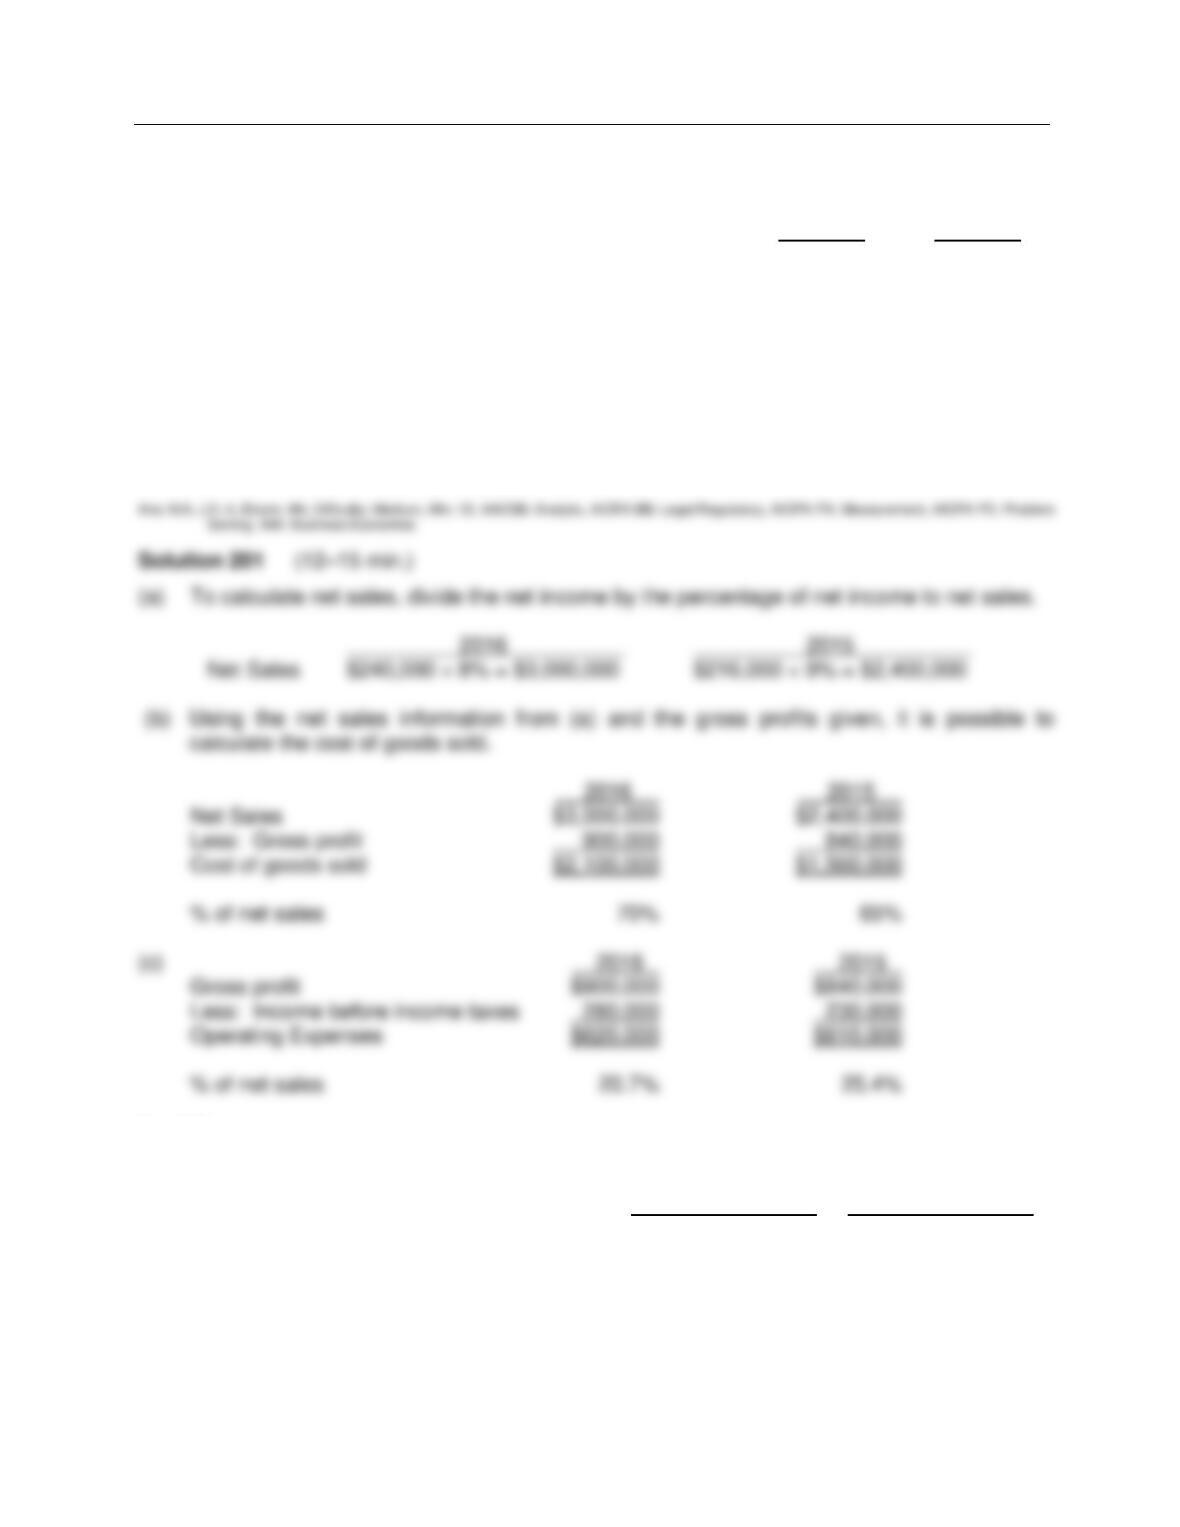
Financial Statement Analysis
FOR INSTRUCTOR USE ONLY
14 – 55
Ex. 201
The following information was taken from the financial statements of Lawson Company:
2016 2015
Gross profit on sales ………………………………………………….. $900,000 $840,000
Income before income taxes ……………………………………….. 280,000 230,000
Net income ……………………………………………………………….. 240,000 216,000
Net income as a percentage of net sales ……………………….. 8% 9%
Instructions
(a) Compute the net sales for each year.
(b) Compute the cost of goods sold in dollars and as a percentage of net sales for each year.
(c) Compute operating expenses in dollars and as a percentage of net sales for each year.
(Income taxes are not operating expenses).
Ex. 202
Selected financial statement data for Mure Company are presented below.
December 31, 2016 December 31, 2015
Cash $ 40,000 $30,000
Short-term investments 20,000 18,000
Receivables (net) 100,000 90,000
Inventories 80,000 60,000
Total current liabilities 100,000 90,000
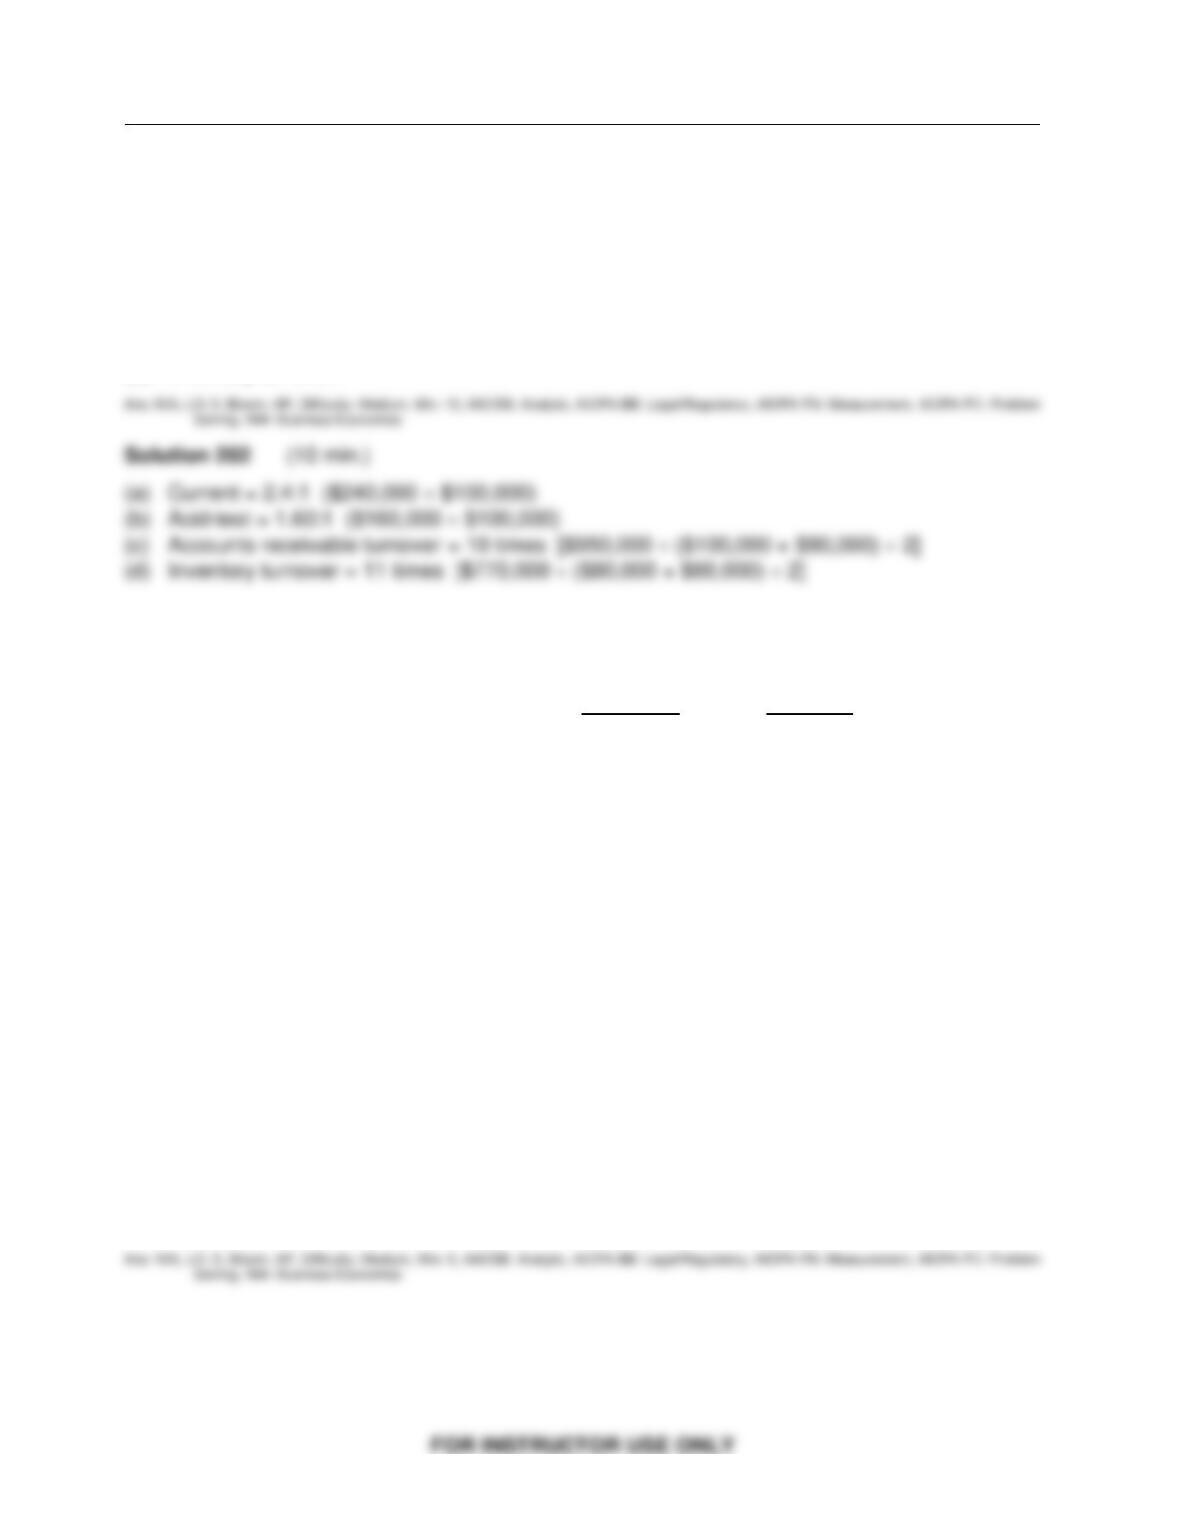
Test Bank for Financial Accounting, Ninth Edition
14 – 56
Ex. 202 (Cont.)
During 2016, net sales were $950,000, and cost of goods sold was $770,000.
Instructions
Compute the following ratios at December 31, 2016:
(a) Current.
(b) Acid-test.
(c) Accounts receivable turnover.
(d) Inventory turnover.
Ex. 203
Selected information from the comparative financial statements of Fava Company for the year
ended December 31, appears below:
2016 2015
Accounts receivable (net) $ 180,000 $200,000
Inventory 140,000 160,000
Total assets 1,200,000 800,000
Current liabilities 140,000 110,000
Long-term debt 400,000 300,000
Net credit sales 1,330,000 700,000
Cost of goods sold 900,000 530,000
Interest expense 50,000 25,000
Income tax expense 60,000 29,000
Net income 150,000 85,000
Instructions
Answer the following questions relating to the year ended December 31, 2016. Show computations.
1. Inventory turnover for 2016 is __________.
2. Times interest earned in 2016 is __________.
3. The debt to assets ratio for 2016 is __________.
4. Accounts receivable turnover for 2016 is __________.
5. Return on assets for 2016 is __________.
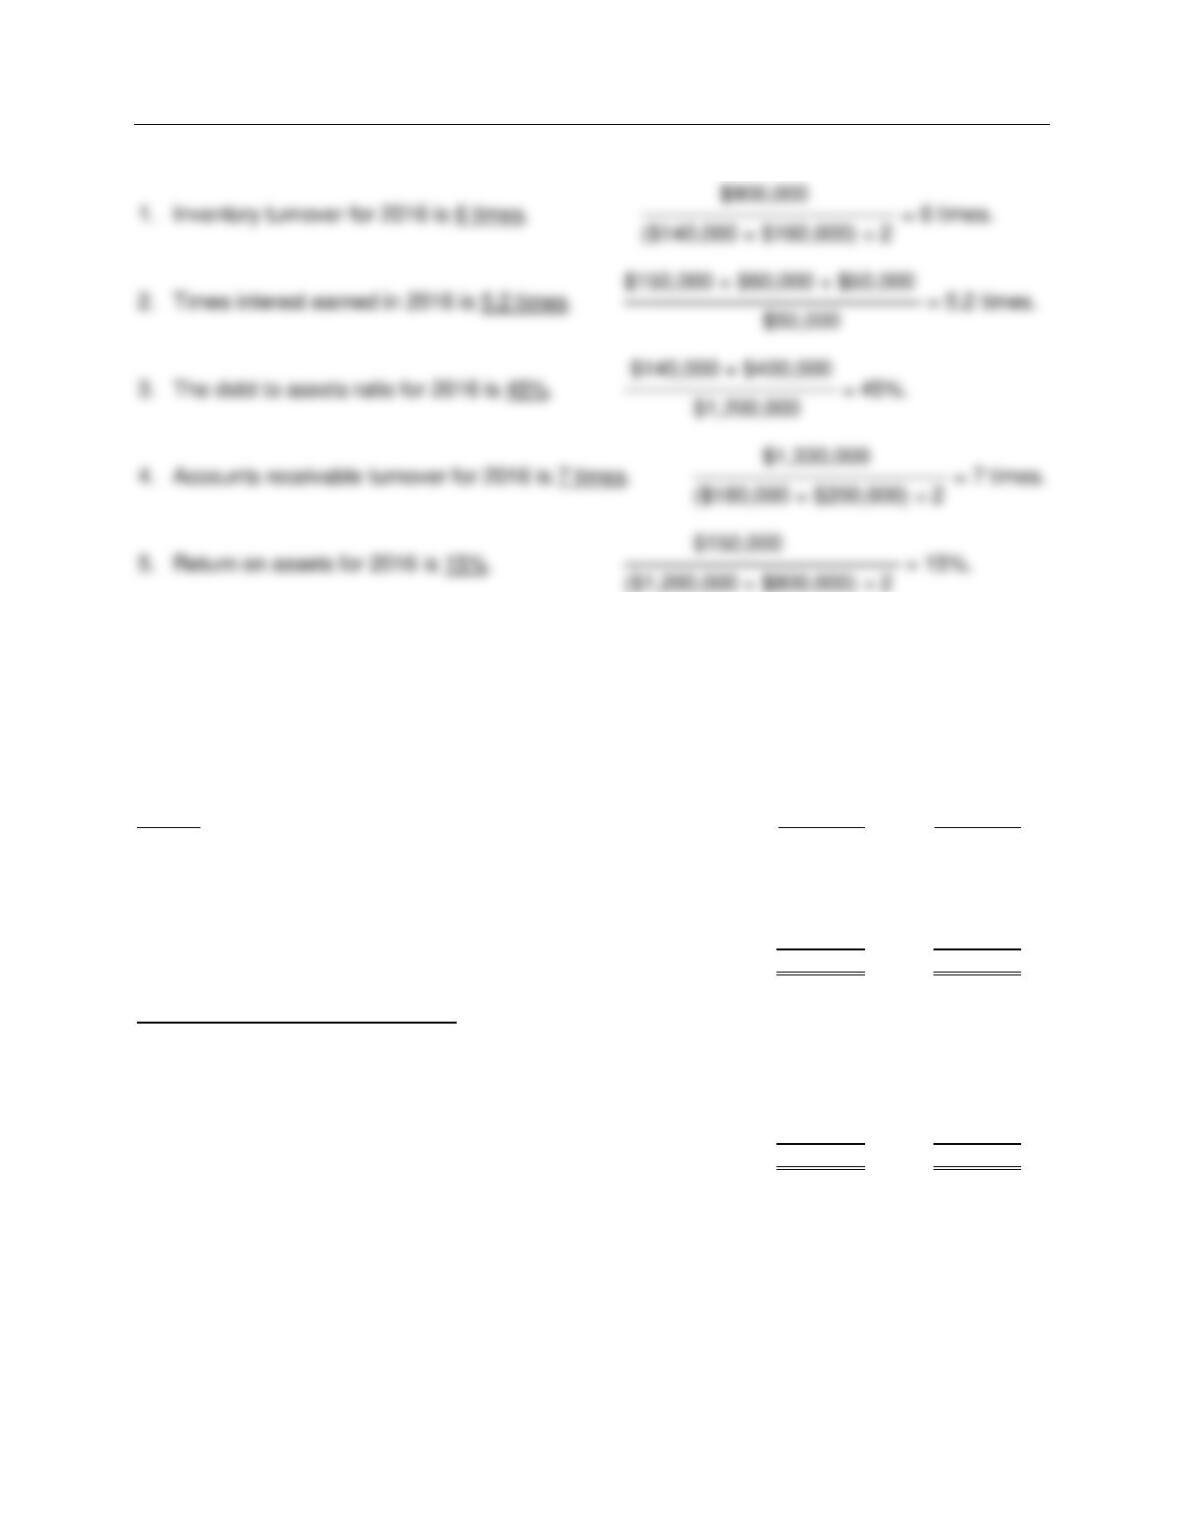
Financial Statement Analysis
FOR INSTRUCTOR USE ONLY
14 – 57
Solution 203 (9–14 min.)
Ex. 204
The financial statements of Hainz Company appear below:
HAINZ COMPANY
Comparative Balance Sheet
December 31
———————————————————————————————————————————
Assets 2016 2015
Cash …………………………………………………………………………………. $ 20,000 $ 40,000
Short-term investments …………………………..……………………………. 20,000 60,000
Accounts receivable (net) ……………………………………………………… 40,000 30,000
Inventory ……………………………………………………………………………. 60,000 70,000
Property, plant and equipment (net) ……………………………………….. 260,000 300,000
Total assets ………………………………………………………………….. $400,000 $500,000
Liabilities and stockholders’ equity
Accounts payable ………………………………………………………………… $ 20,000 $ 30,000
Short-term notes payable ……………………………………………………… 40,000 90,000
Bonds payable ……………………………………………………………………. 80,000 160,000
Common stock ……………………………………………………………………. 150,000 150,000
Retained earnings ……………………………………………………………….. 110,000 70,000
Total liabilities and stockholders’ equity ……………………………… $400,000 $500,000

Test Bank for Financial Accounting, Ninth Edition
14 – 58
Ex. 204 (cont.)
HAINZ COMPANY
Income Statement
For the Year Ended December 31, 2016
Net sales ……………………………………………………………………………. $400,000
Cost of goods sold …………………………..…………………………………… 250,000
Gross profit…………………………………………………………………………. 150,000
Expenses
Operating expenses ……………………………………………………….. $42,000
Interest expense …………………………………………………………….. 18,000
Total expenses …………………………………………………………. 60,000
Income before income taxes …………………………………………………. 90,000
Income tax expense …………………………………………………………….. 27,000
Net income …………………………………………………………………………. $ 63,000
Additional information:
a. Cash dividends of $23,000 were declared and paid in 2016.
b. Weighted-average number of shares of common stock outstanding during 2016 was 30,000
shares.
c. Market value of common stock on December 31, 2016, was $21 per share.
Instructions
Using the financial statements and additional information, compute the following ratios for Hainz
Company for 2016. Show all computations.
Computations
1. Current ratio _________.
2. Return on common stockholders’ equity _________.
3. Price-earnings ratio _________.
4. Acid-test ratio _________.
5. Accounts receivable turnover _________.
6. Times interest earned _________.
7. Profit margin _________.
8. Days in inventory _________.
9. Payout ratio _________.
10. Return on assets _________.
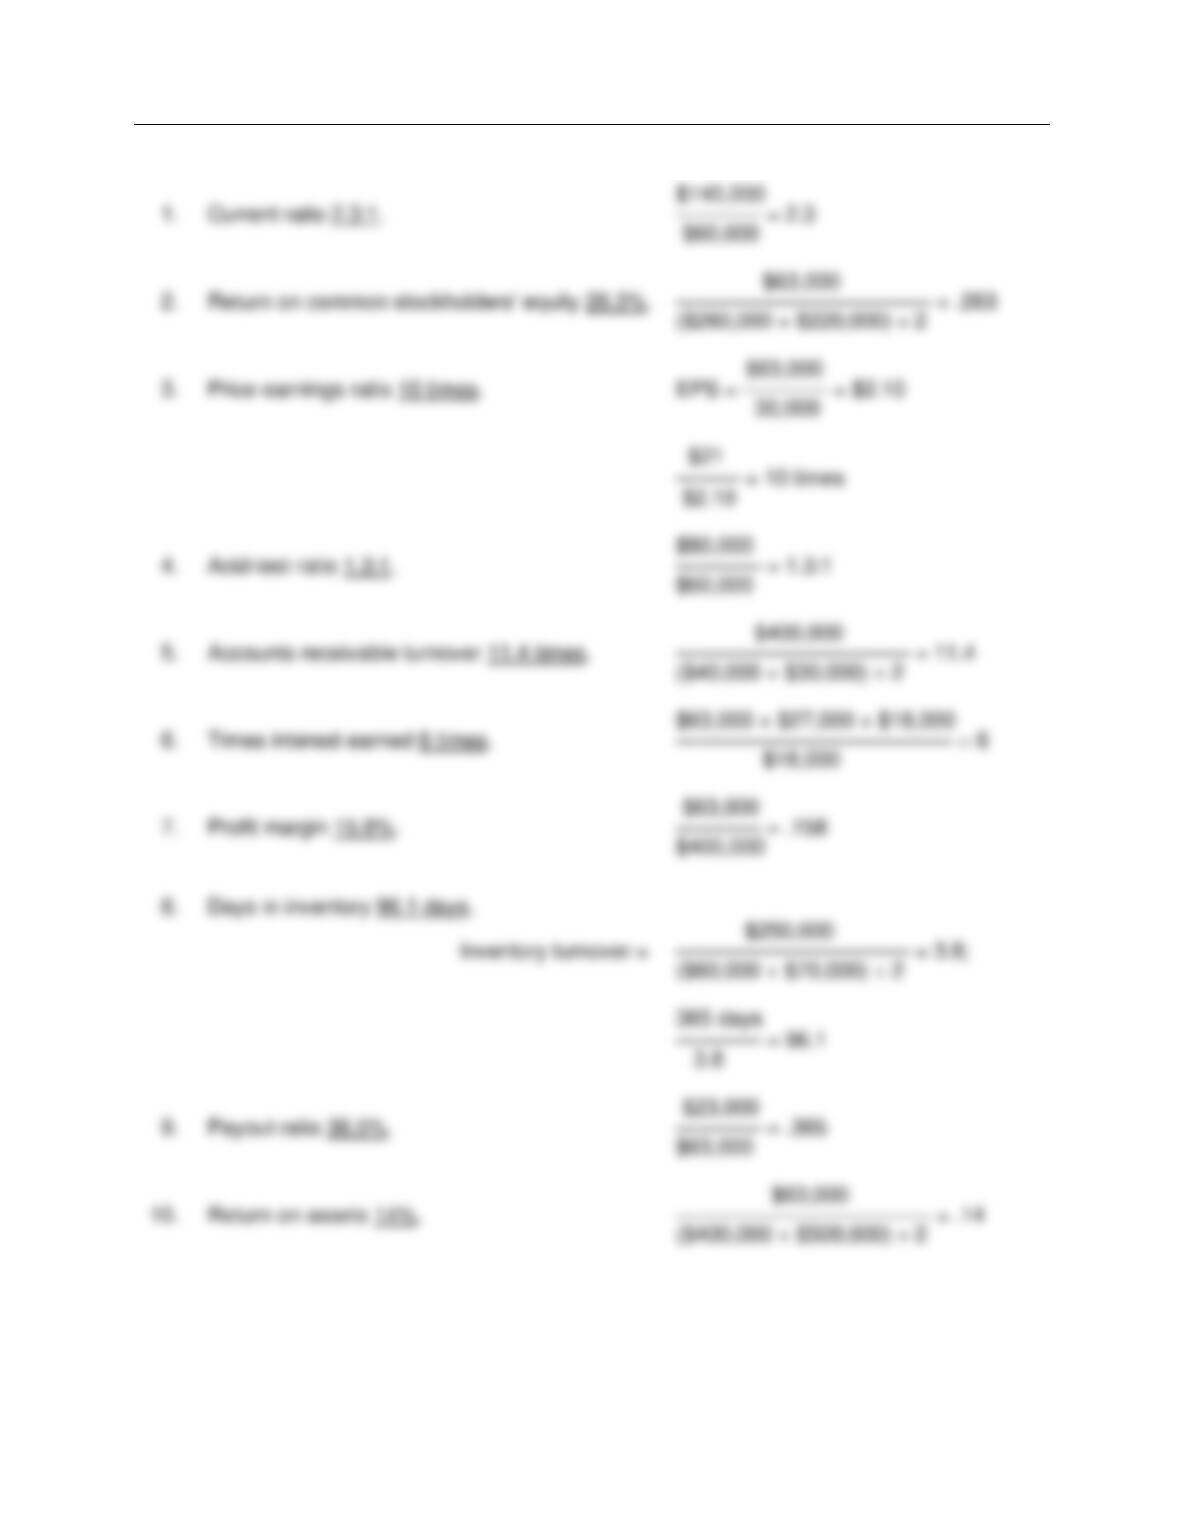
Financial Statement Analysis
FOR INSTRUCTOR USE ONLY
14 – 59
Solution 204 (15–20 min.)

Test Bank for Financial Accounting, Ninth Edition
FOR INSTRUCTOR USE ONLY
14 – 60
Ex. 205
The following ratios have been computed for Mason Company for 2016.
Profit margin 12.5%
Times interest earned 8 times
Receivables turnover 4 times
Acid-test ratio 2 : 1
Current ratio 3 : 1
Debt to total assets ratio 20%
Mason Company’s 2016 financial statements with missing information follow:
MASON COMPANY
Comparative Balance Sheet
December 31
———————————————————————————————————————————
Assets 2016 2015
Cash…………………………………………………………………………….. $ 30,000 $ 45,000
Short-term Investments …………………………………………………… 10,000 25,000
Accounts receivable (net) ………………………………………………… ? (6) 40,000
Inventory ………………………………………………………………………. ? (8) 50,000
Property, plant, and equipment (net) …………………………………. 200,000 160,000
Total assets…………………………………………………………….. $ ? (9) $320,000
Liabilities and stockholders’ equity
Accounts payable …………………………………………………………… $ ? (7) $ 30,000
Short-term notes payable ………………………………………………… 40,000 35,000
Bonds payable ………………………………………………………………. ? (10) 20,000
Common stock ………………………………………………………………. 220,000 200,000
Retained earnings ………………………………………………………….. 60,000 35,000
Total liabilities and stockholders’ equity ……………………….. $ ? (11) $320,000
MASON COMPANY
Income Statement
For the Year Ended December 31, 2016
———————————————————————————————————————————
Net sales ………………………………………………………………………. $200,000
Cost of goods sold …………………………..……………………………… 75,000
Gross profit……………………………………………………………………. 125,000
Expenses:
Depreciation expense ………………………………………………… $ ? (5)
Interest expense ……………………………………………………….. 5,000
Selling expenses ………………………………………………………. 8,000
Administrative expenses …………………………………………….. 12,000
Total expenses ……………………………………………………. ? (4)
Income before income taxes ……………………………………………. ? (2)
Income tax expense ………………………………………………….. ? (3)
Net income ……………………………………………………………………. $ ? (1)
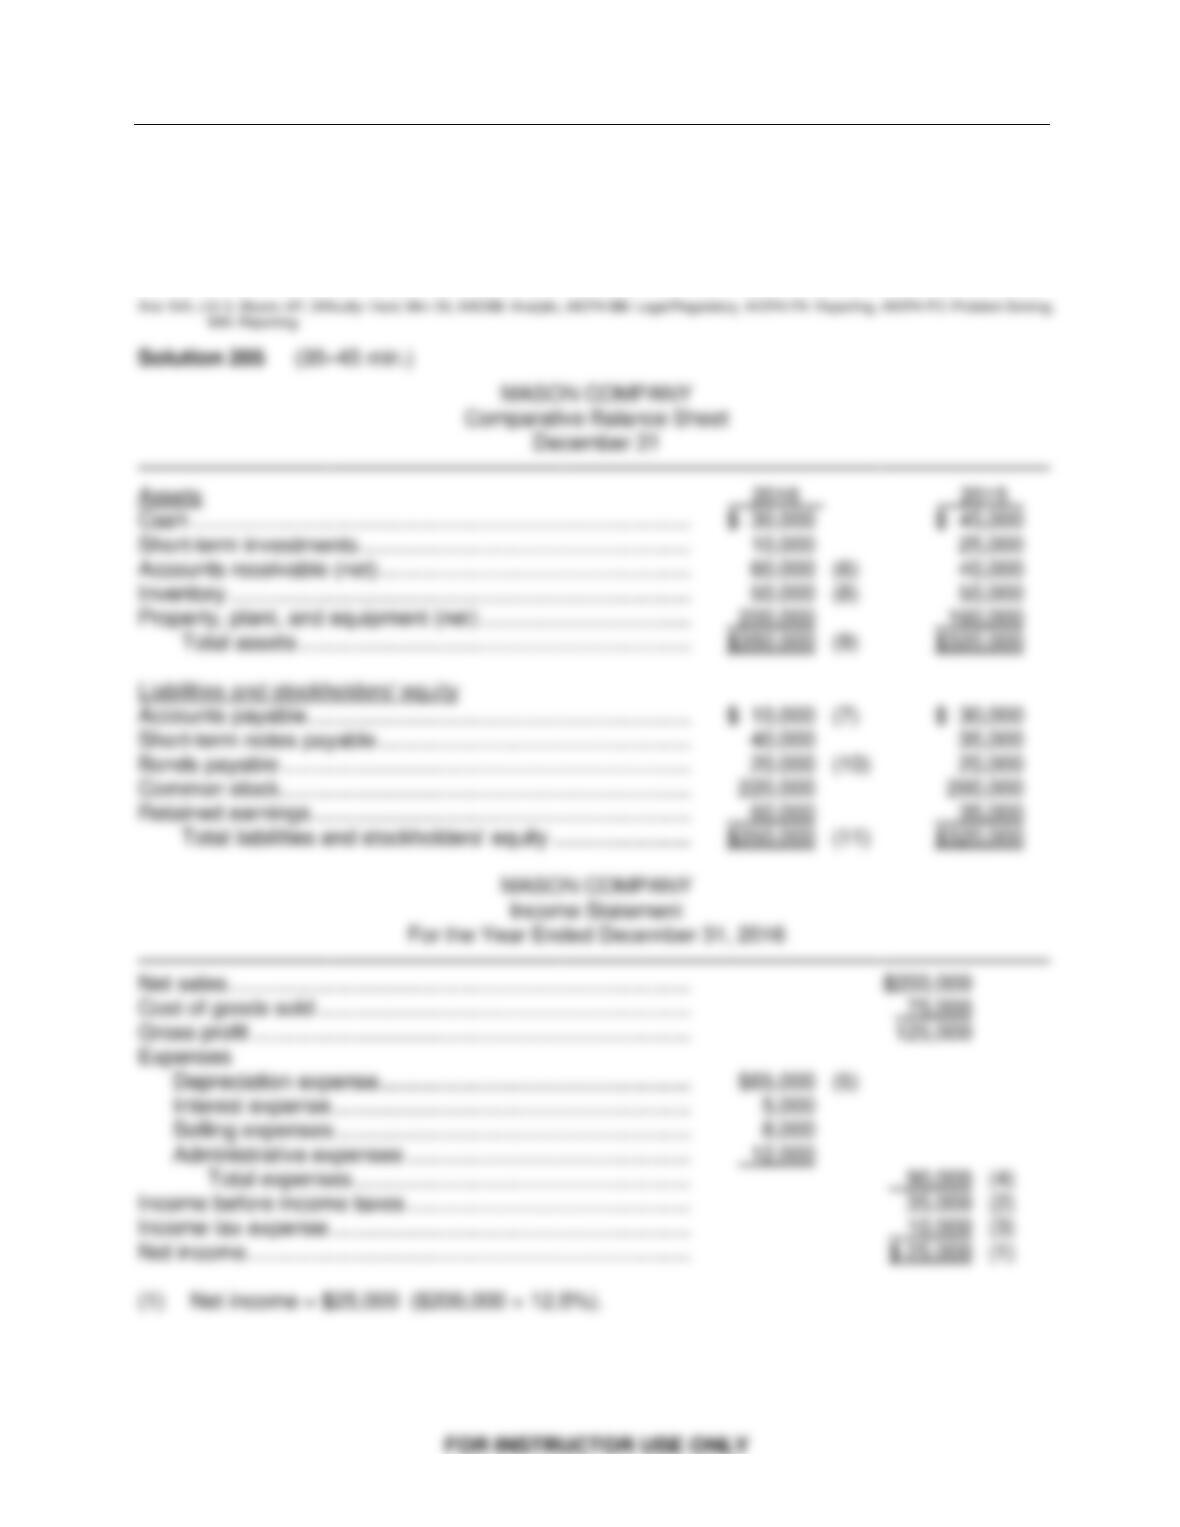
Financial Statement Analysis
14 – 61
Ex. 205 (Cont.)
Instructions
Use the above ratios and information from the Mason Company financial statements to fill in the
missing information on the financial statements. Follow the sequence indicated. Show
computations that support your answers.
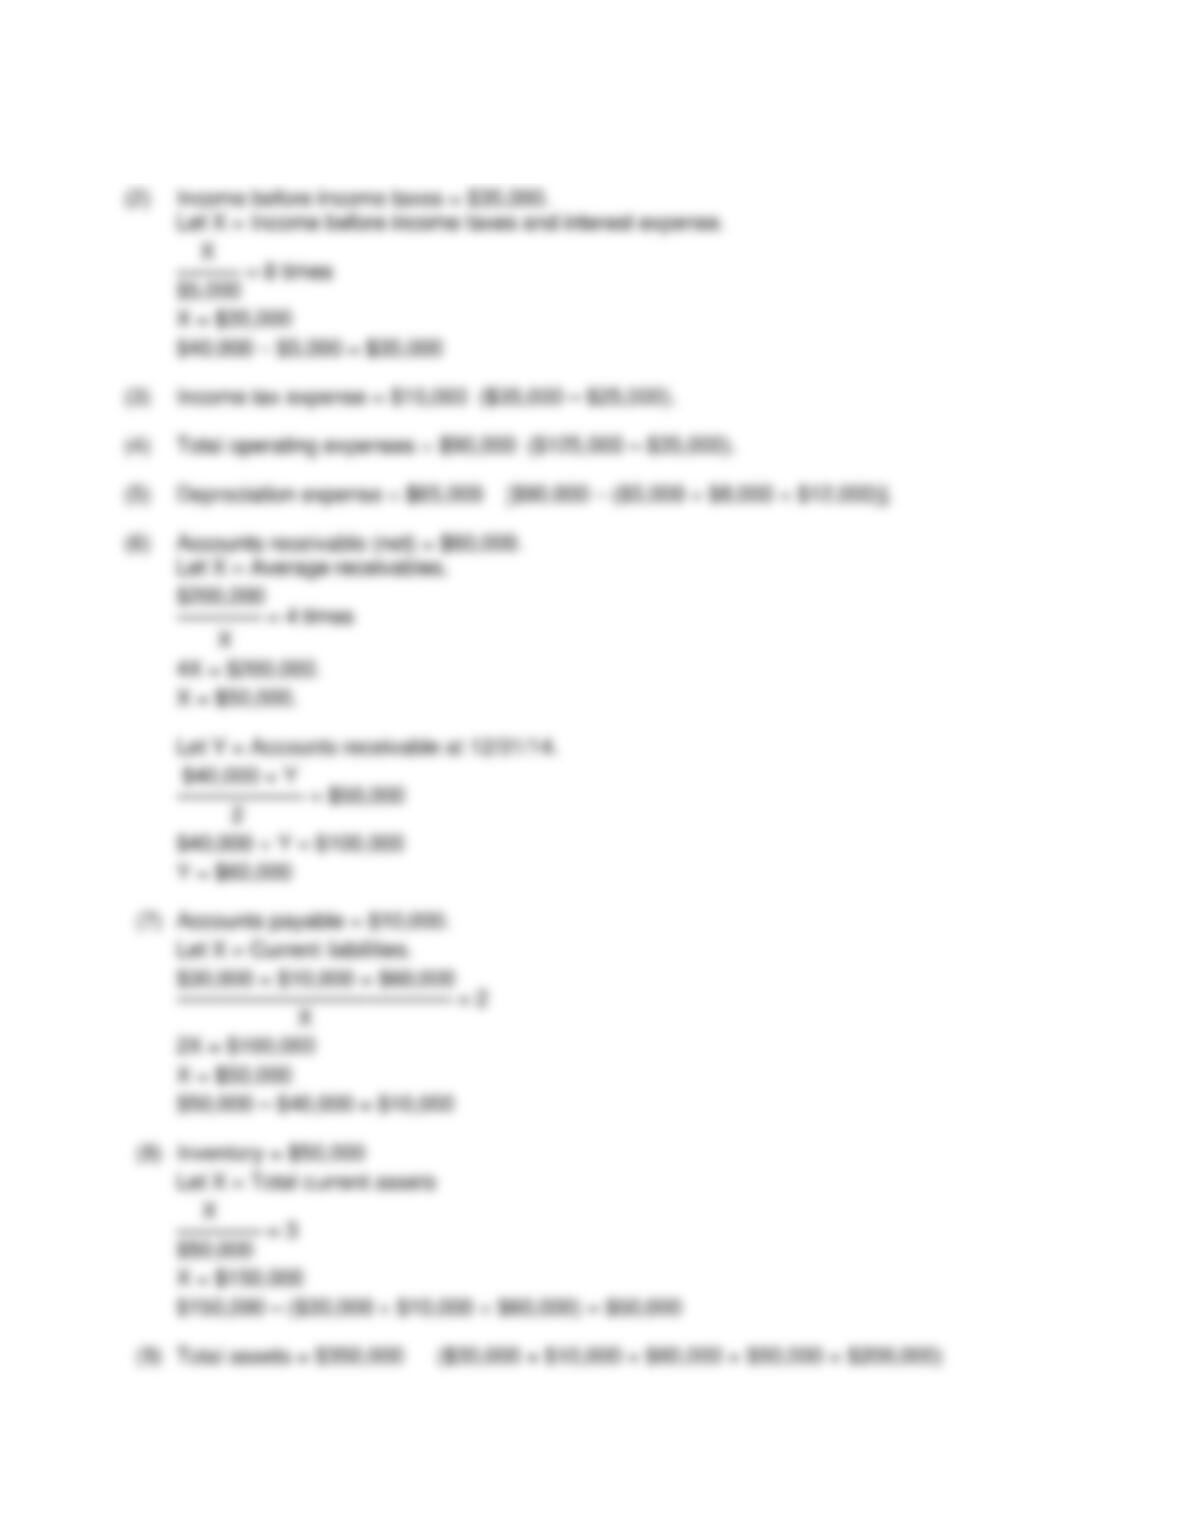
Test Bank for Financial Accounting, Ninth Edition
FOR INSTRUCTOR USE ONLY
14 – 62
Solution 205 (cont.)
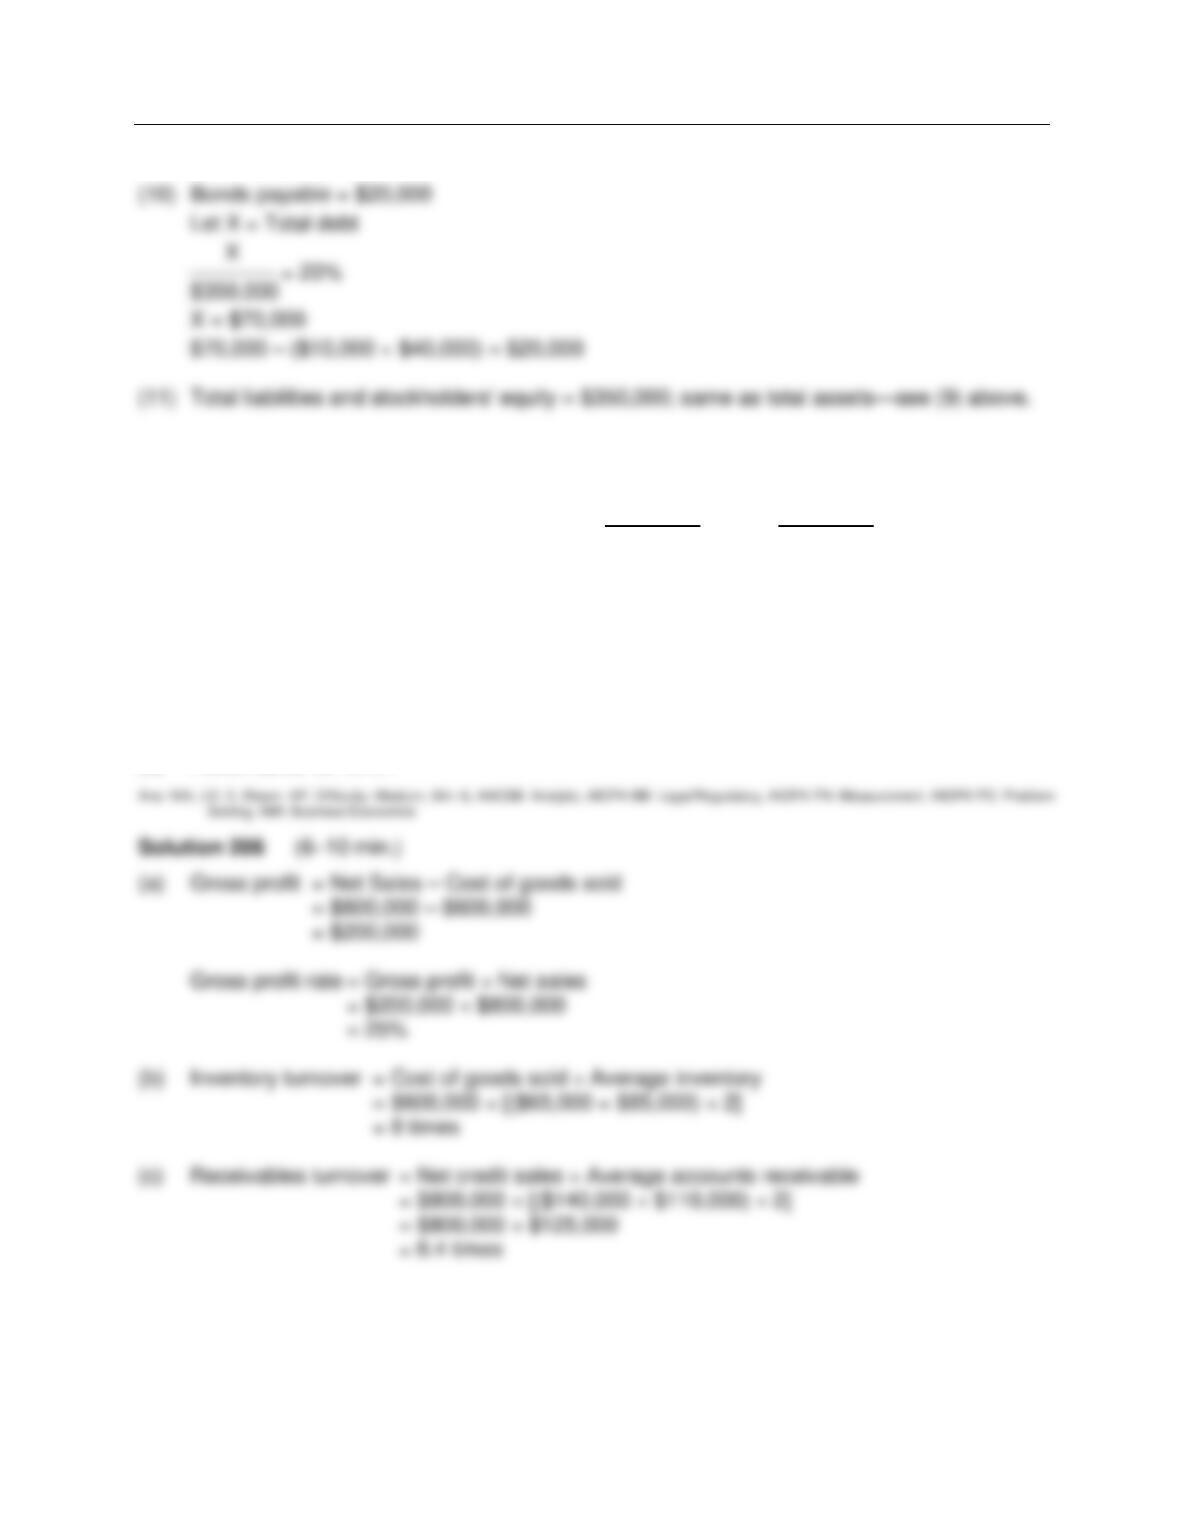
Financial Statement Analysis
FOR INSTRUCTOR USE ONLY
14 – 63
Solution 205 (cont.)
Ex. 206
Selected data for Irma’s Store appear below.
2016 2015
Net sales $800,000 $520,000
Cost of goods sold 600,000 345,000
Inventory at end of year 65,000 85,000
Accounts receivable at end of year 140,000 110,000
Instructions
Compute the following for 2016:
(a) Gross profit rate.
(b) Inventory turnover.
(c) Receivables turnover.
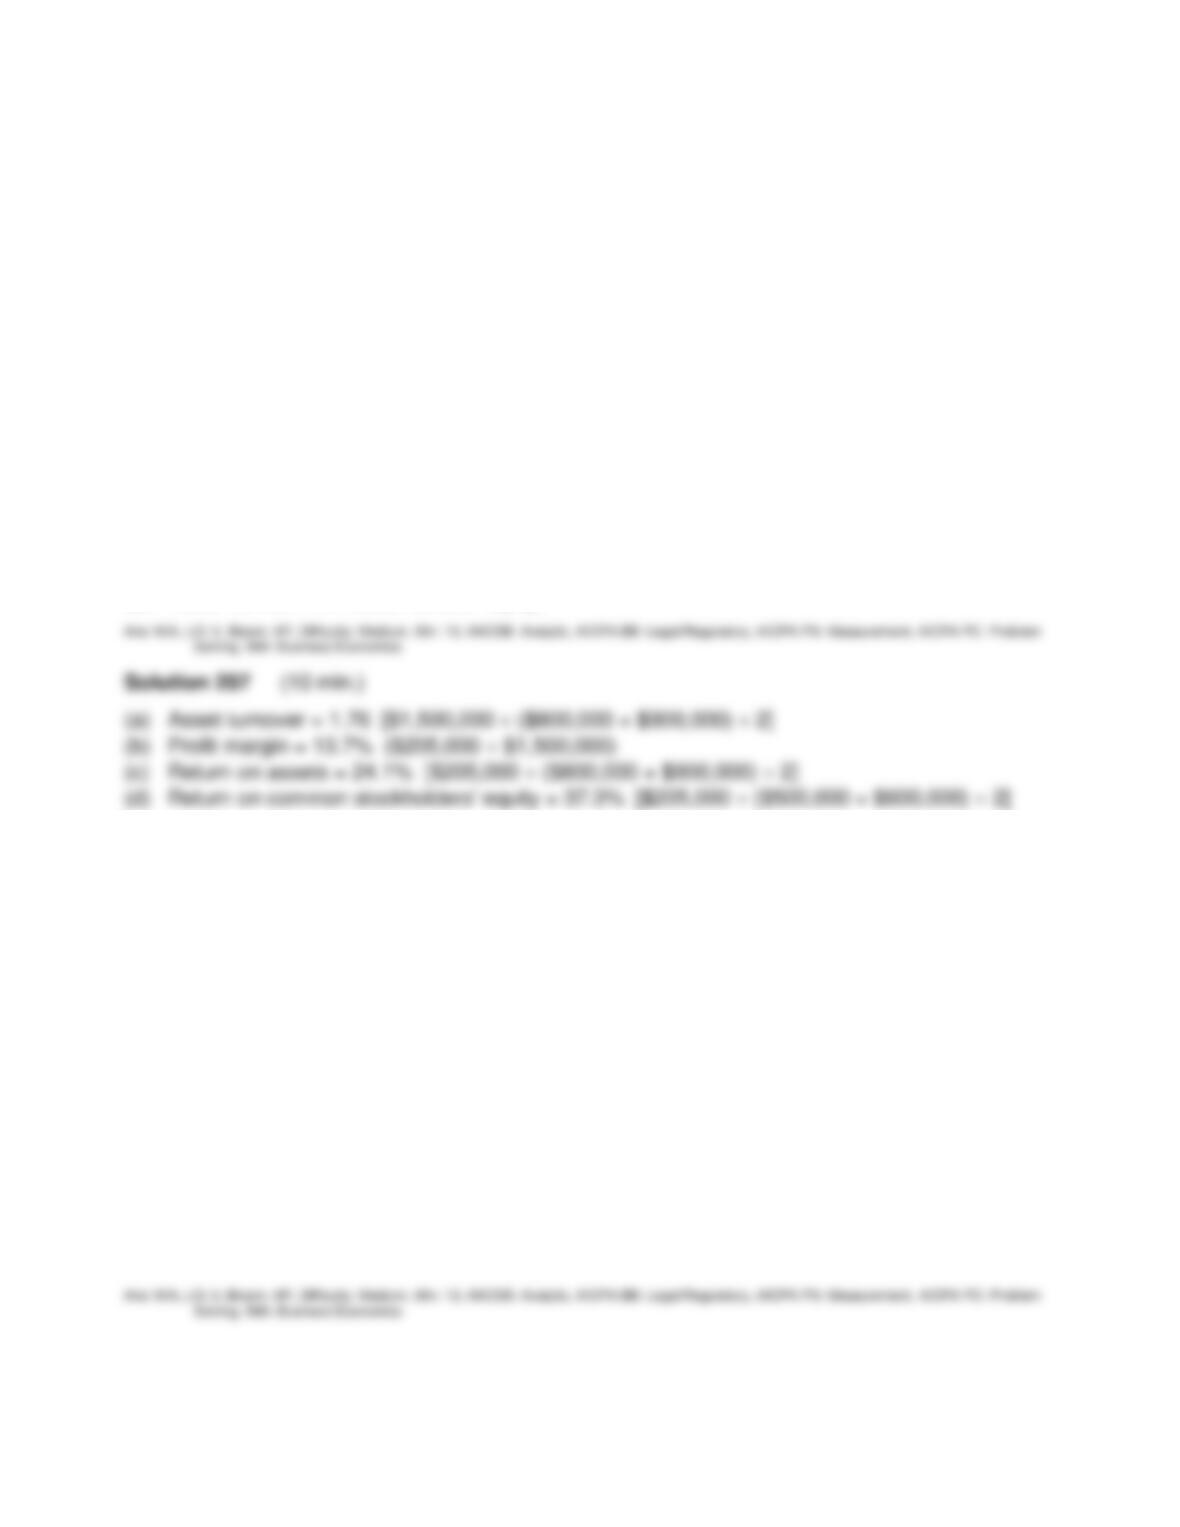
Test Bank for Financial Accounting, Ninth Edition
FOR INSTRUCTOR USE ONLY
14 – 64
Ex. 207
Selected financial statement data for Homer Company are presented below.
Net sales $1,500,000
Cost of goods sold 700,000
Interest expense 10,000
Net income 205,000
Total assets (ending) $900,000
Total common stockholders’ equity (ending) $600,000
Total assets at the beginning of the year were $800,000; total common stockholders’ equity was
$500,000 at the beginning of the period.
Instructions
Compute each of the following:
(a) Asset turnover
(b) Profit margin
(c) Return on assets
(d) Return on common stockholders’ equity
Ex. 208
Flite Corporation has issued common stock only. The company has been successful and has a
gross profit rate of 20%. The information shown below was taken from the company’s financial
statements.
Beginning inventory $ 482,000
Purchases 4,036,000
Ending inventory ?
Average accounts receivable 800,000
Average common stockholders’ equity 3,500,000
Sales (all on credit) 5,000,000
Net income 385,000
Instructions
Compute the following:
(a) Accounts receivable turnover and the average collection period.
(b) Inventory turnover and the days in inventory.
(c) Return on common stockholders’ equity.
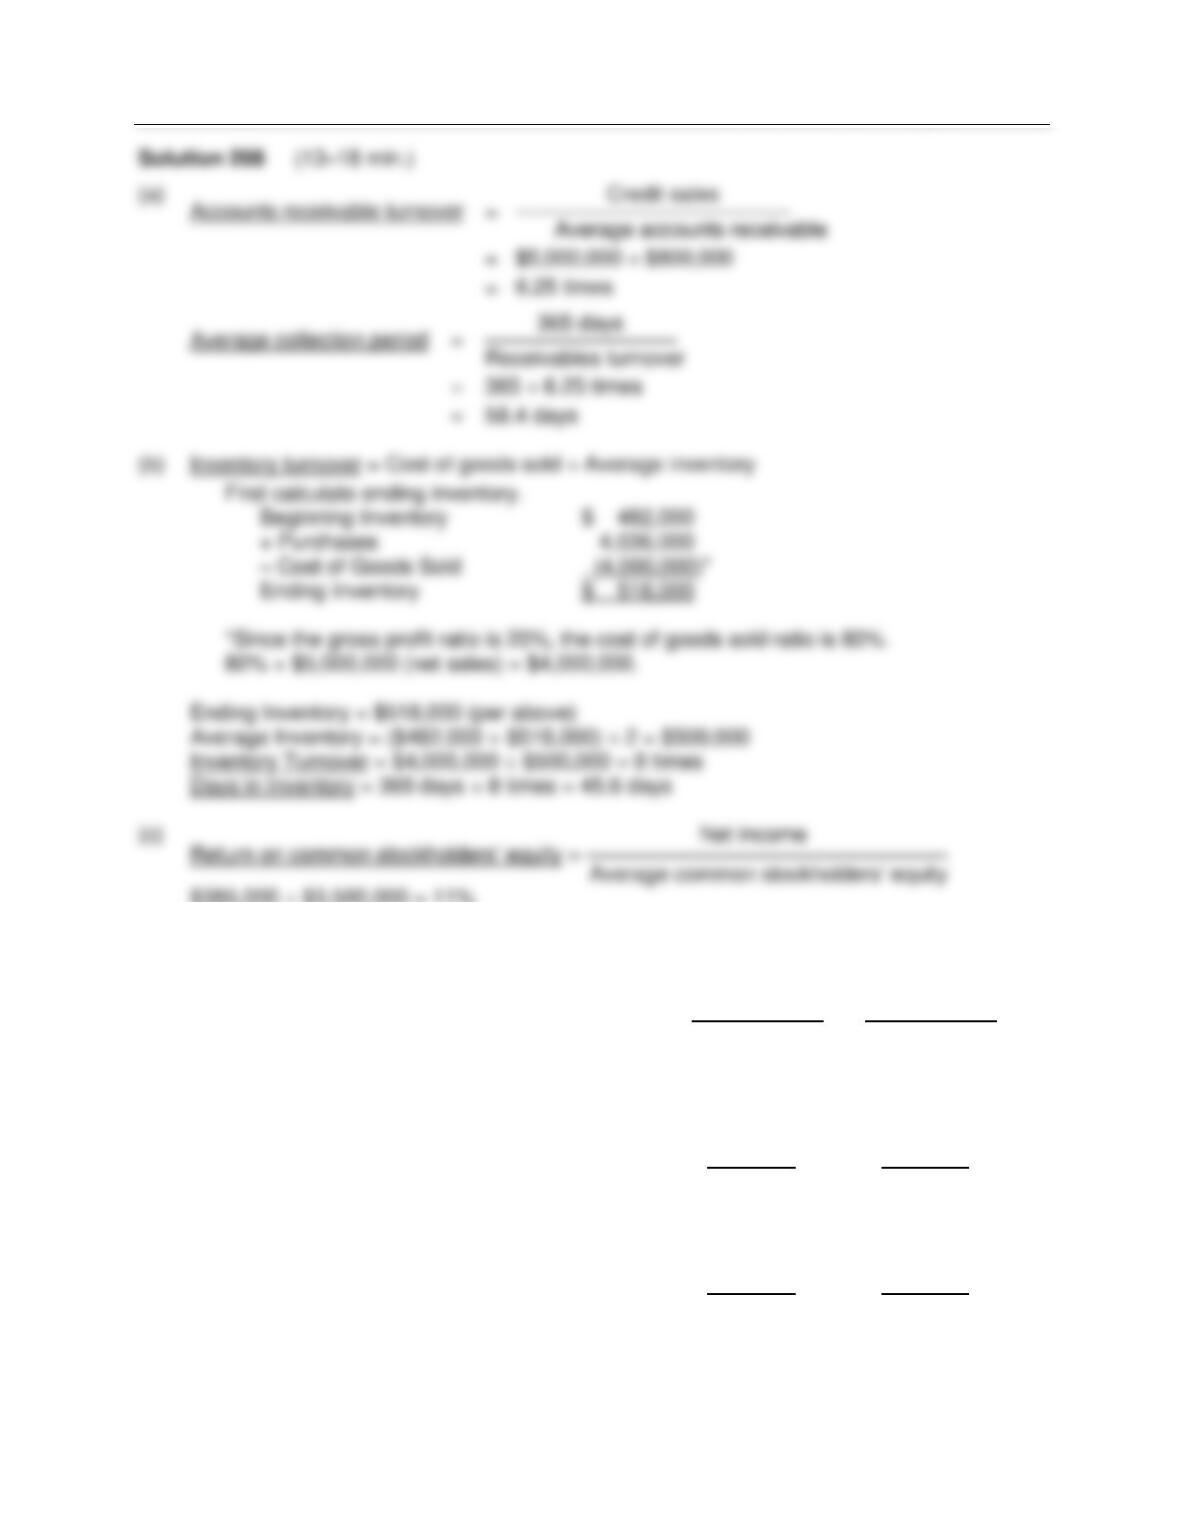
Financial Statement Analysis
FOR INSTRUCTOR USE ONLY
14 – 65
$385,000 ÷ $3,500,000 = 11%
Ex. 209
Booker Corporation had the following comparative current assets and current liabilities:
Dec. 31, 2016 Dec. 31, 2015
Current assets
Cash $ 60,000 $ 30,000
Short-term investments 40,000 10,000
Accounts receivable 55,000 95,000
Inventory 110,000 90,000
Prepaid expenses 35,000 20,000
Total current assets $300,000 $245,000
Current liabilities
Accounts payable $140,000 $110,000
Salaries payable 40,000 30,000
Income tax payable 20,000 15,000
Total current liabilities $200,000 $155,000
During 2016, credit sales and cost of goods sold were $750,000 and $400,000, respectively.
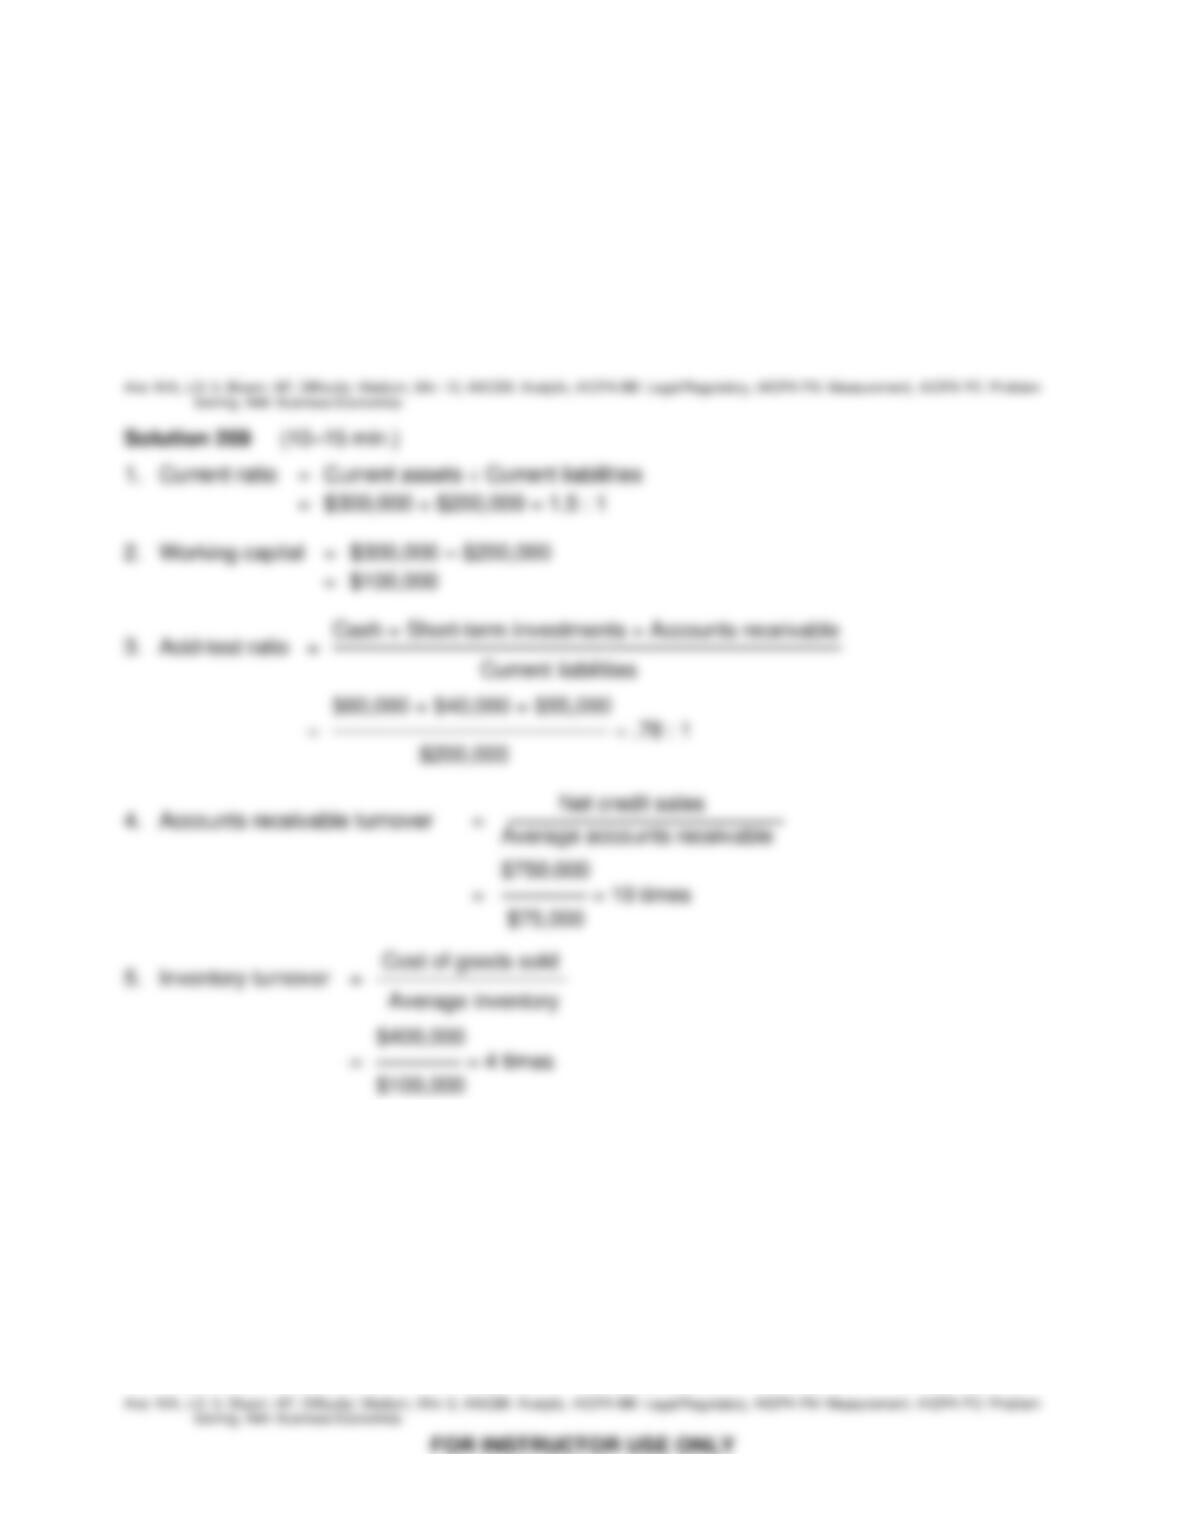
Test Bank for Financial Accounting, Ninth Edition
14 – 66
Ex. 209 (Cont.)
Instructions
Compute the following liquidity measures for 2016:
1. Current ratio.
2. Working capital.
3. Acid-test ratio.
4. Accounts receivable turnover.
5. Inventory turnover.
Ex. 210
Selected data from Decco Company are presented below:
Total assets $1,600,000
Average assets 2,000,000
Net income 380,000
Net sales 1,500,000
Average common stockholders’ equity 1,000,000
Instructions
Calculate the profitability ratios that can be computed from the above information.
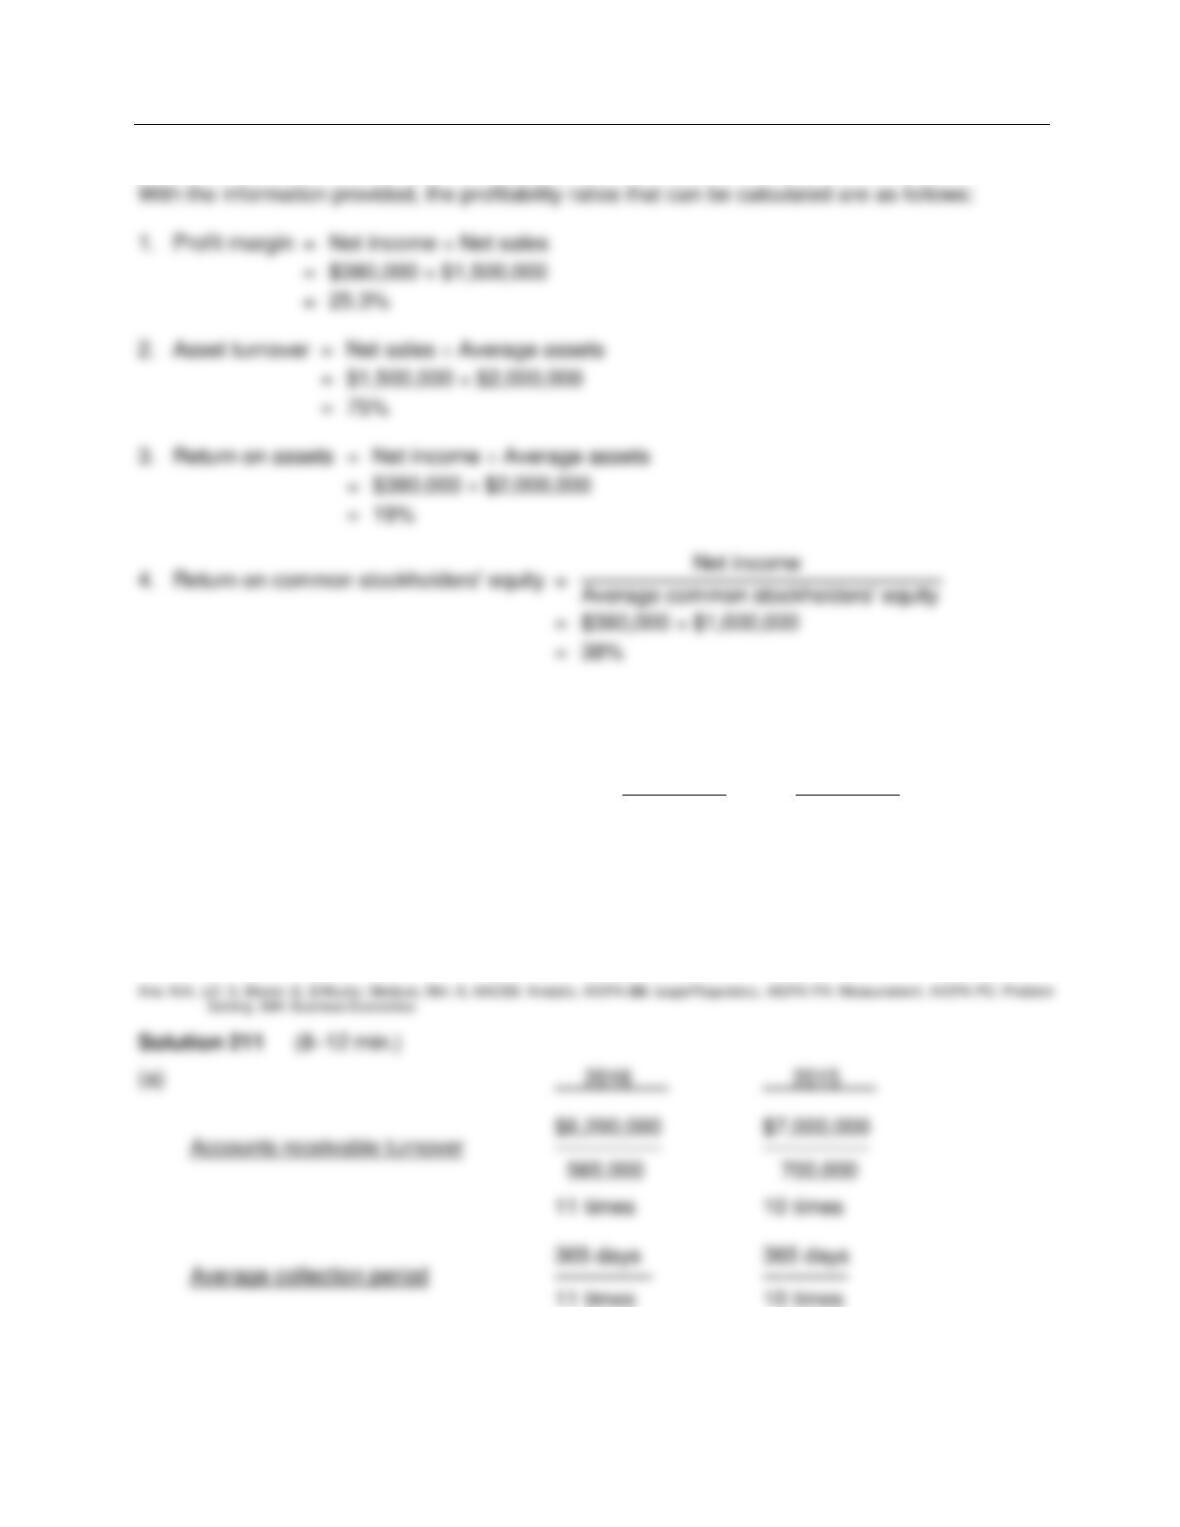
Financial Statement Analysis
FOR INSTRUCTOR USE ONLY
14 – 67
Solution 210 (9–13 min.)
Ex. 211
The following data are taken from the financial statements of Dands Company:
2016 2015
Monthly average accounts receivable $ 565,000 $ 700,000
Net sales on account $6,200,000 $7,000,000
Terms for all sales are 2/10, n/30
Instructions
(a) Compute the accounts receivable turnover and the average collection period for both years.
(b) What conclusion can an analyst draw about the management of the accounts receivable?
33.2 days 36.5 days
Test Bank for Financial Accounting, Ninth Edition
FOR INSTRUCTOR USE ONLY
14 – 68
Solution 211 (Cont.)
(b) The receivables are turning faster in 2016 than they did in 2015. There is still a problem
since the normal credit period is 30 days, and the average collection period for both years
exceeds this target. Therefore, improvement in the management of the receivables would
appear to be desirable.
Ex. 212
State the effect of the following transactions on the current ratio. Use increase, decrease, or no
effect for your answer.
(a) Collection of an accounts receivable.
(b) Declaration of cash dividends.
(c) Additional stock is sold for cash.
(d) Short-term investments are purchased for cash.
(e) Equipment is purchased for cash.
(f) Inventory purchases are made for cash.
(g) Accounts payable are paid.
Ex. 213
The balance sheet for Tyde Corporation at the end of the current year indicates the following:
Bonds payable, 6% ……………………………………………………. $4,000,000
5% Preferred stock, $100 par ………………………………………. 1,000,000
Common stock, $10 par ……………………………………………… 2,000,000
Income before income taxes was $480,000 and income taxes expense for the current year
amounted to $144,000. Cash dividends paid on common stock were $300,000, and the common
stock was selling for $22.88 per share at the end of the year. There were no ownership changes
during the year.
Instructions
Determine each of the following:
(a) Times that bond interest was earned.
(b) Earnings per share for common stock.
(c) Price-earnings ratio.
Ans: N/A, LO: 5, Bloom: AP, Difficulty: Medium, Min: 9, AACSB: Analytic, AICPA BB: Legal/Regulatory, AICPA FN: Measurement, AICPA PC: Problem
Solving, IMA: Business Economics
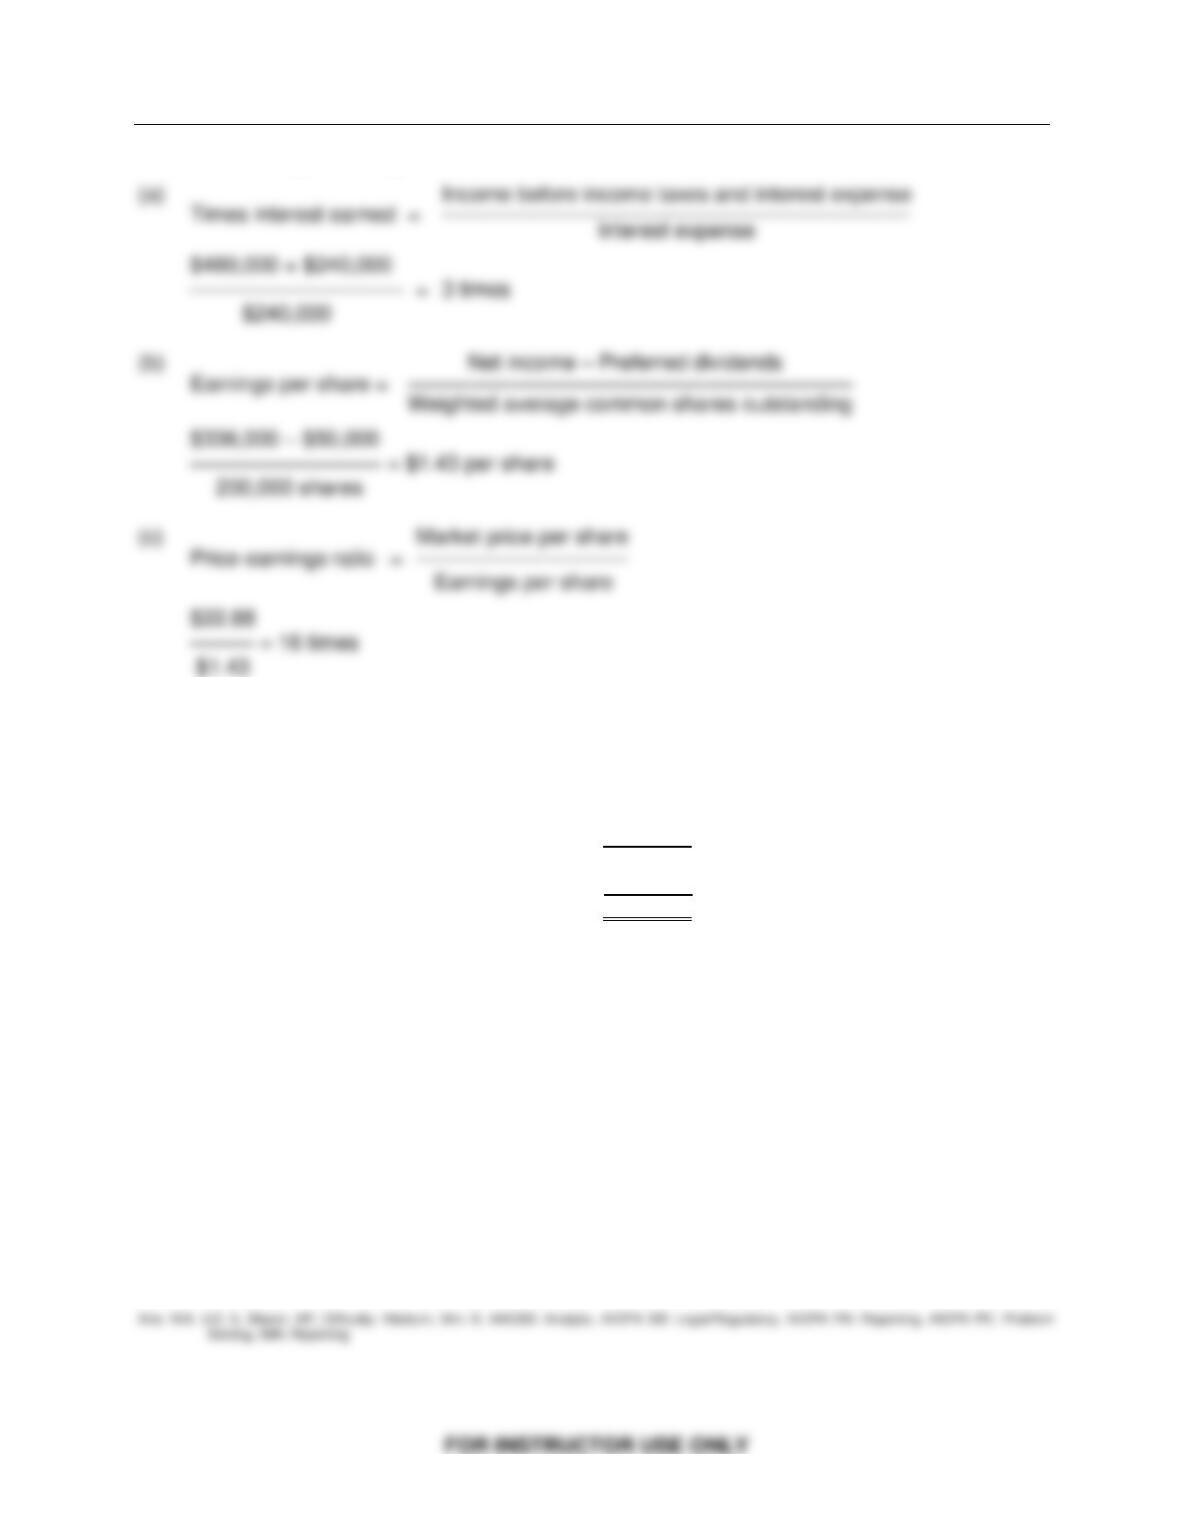
Financial Statement Analysis
14 – 69
Solution 213 (9–14 min.)
Ex. 214
The income statement for Pointe Company for the year ended December 31, 2015 appears
below.
Sales $720,000
Cost of goods sold 380,000
Gross profit 340,000
Expenses 190,000*
Net income $150,000
*Includes $20,000 of interest expense and $25,000 of income tax expense.
Additional information:
1. Common stock outstanding on January 1, 2015 was 50,000 shares. On July 1, 2015, 10,000
more shares were issued.
2. The market price of Pointe’s stock was $11.70 at the end of 2015.
3. Cash dividends of $30,000 were paid, $7,000 of which were paid to preferred stockholders.
Instructions
Compute the following ratios for 2015:
(a) Earnings per share.
(b) Price-earnings.
(c) Times interest earned.
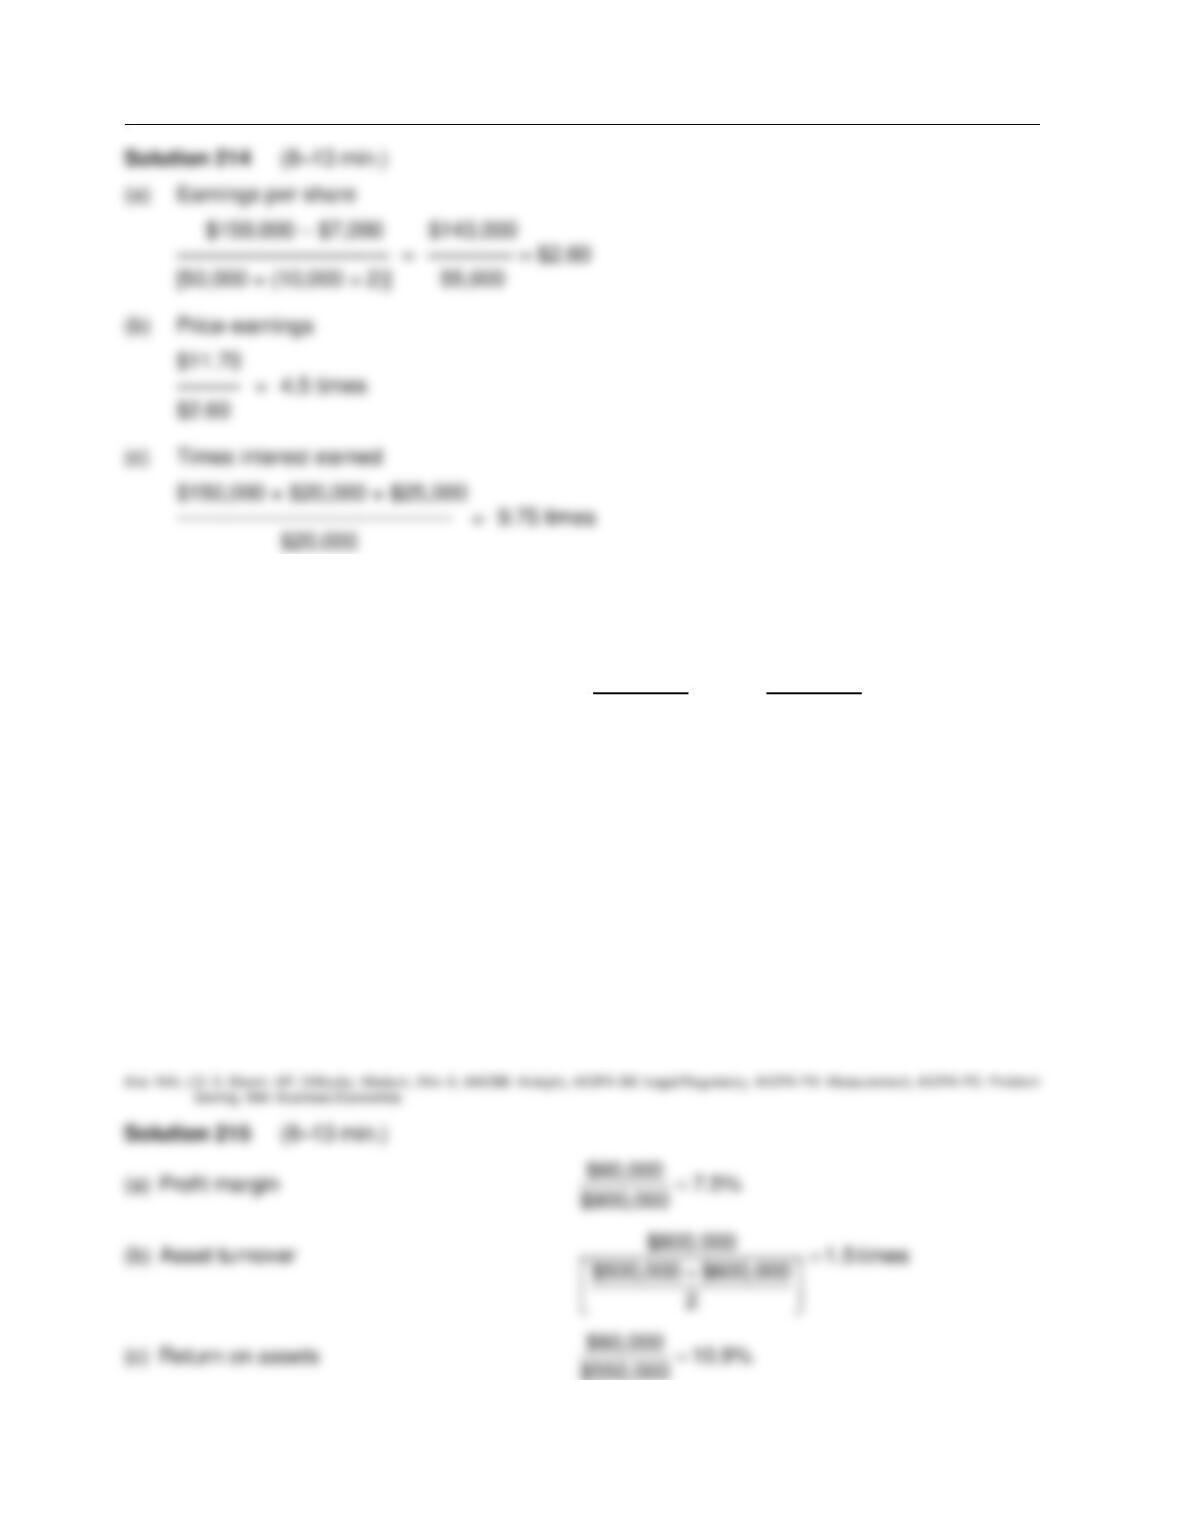
Test Bank for Financial Accounting, Ninth Edition
FOR INSTRUCTOR USE ONLY
14 – 70
Ex. 215
Selected comparative statement data for Willow Products Company are presented below. All
balance sheet data are as of December 31.
2016 2015
Net sales $800,000 $720,000
Cost of goods sold 480,000 440,000
Interest expense 7,000 5,000
Net income 60,000 42,000
Accounts receivable 120,000 100,000
Inventory 85,000 75,000
Total assets 600,000 500,000
Total common stockholders’ equity 430,000 320,000
Instructions
Compute the following ratios for 2016:
(a) Profit margin.
(b) Asset turnover.
(c) Return on assets.
(d) Return on common stockholders’ equity.
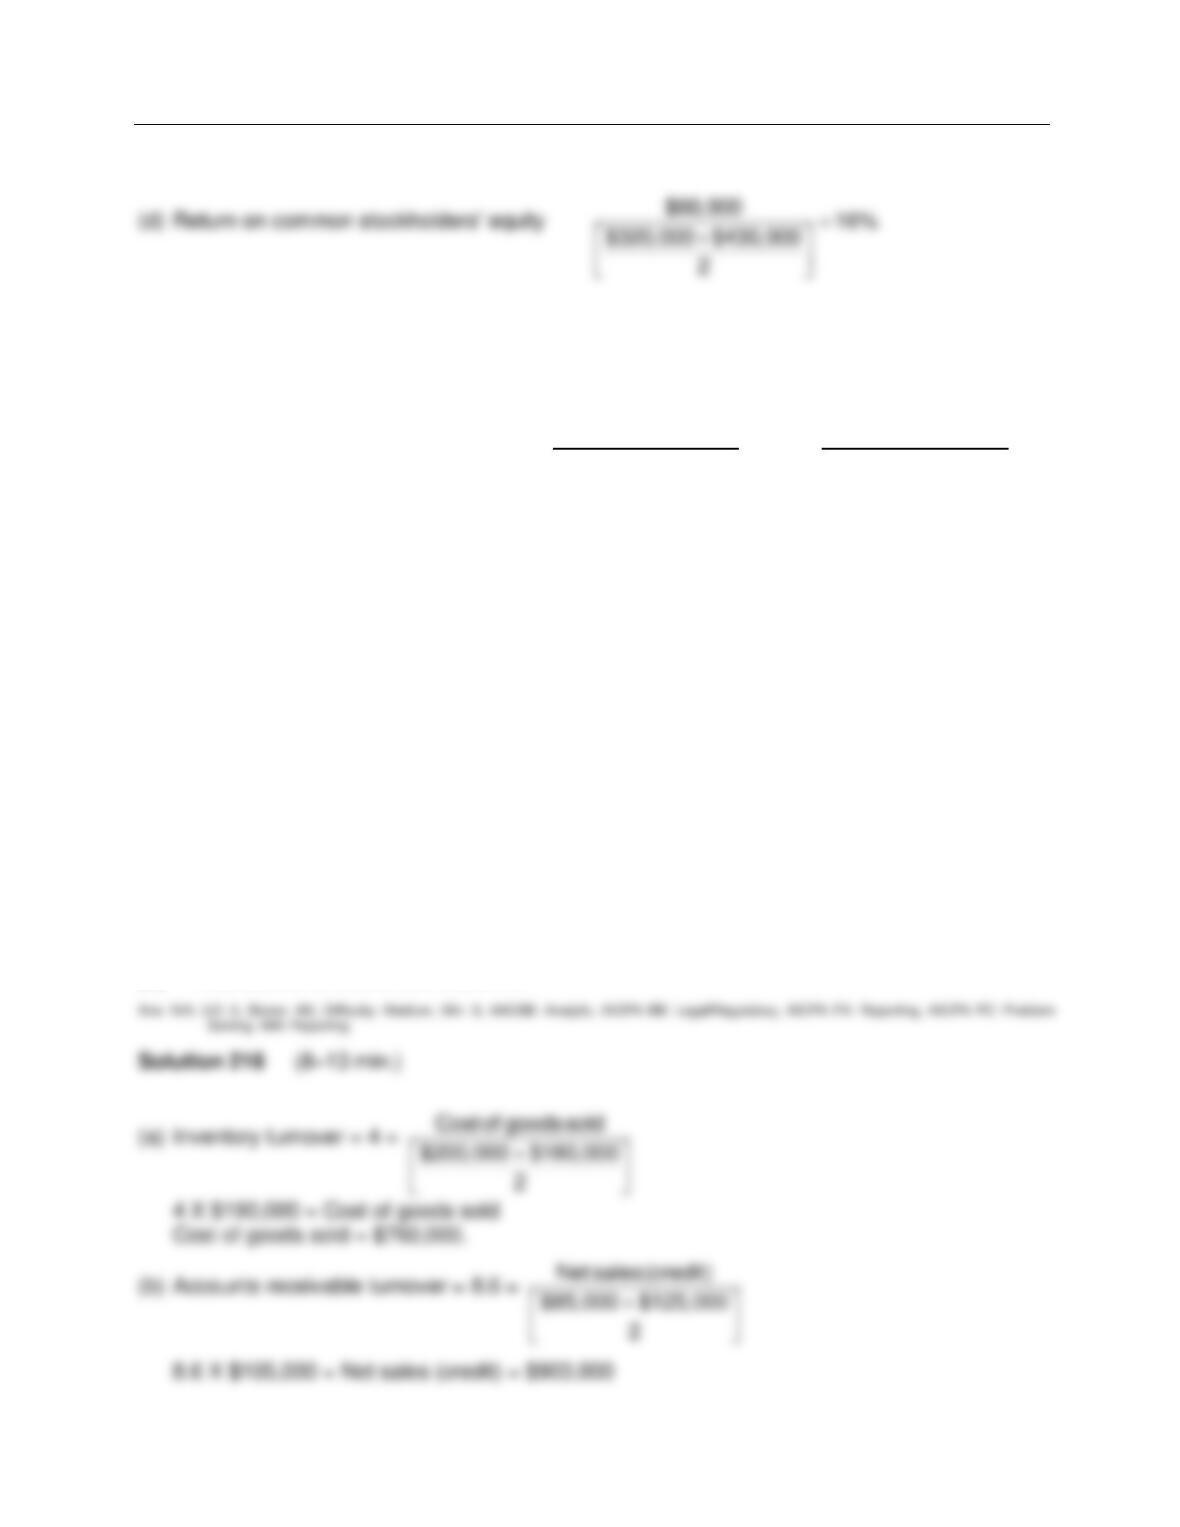
Financial Statement Analysis
FOR INSTRUCTOR USE ONLY
14 – 71
Solution 215 (Cont.)
Ex. 216
Lewis Corporation experienced a fire on December 31, 2016, in which its financial records were
partially destroyed. It has been able to salvage some of the records and has ascertained the
following balances.
December 31, 2016 December 31, 2015
Cash $ 30,000 $ 10,000
Receivables (net) 85,000 125,000
Inventory 200,000 180,000
Accounts payable 50,000 90,000
Notes payable 30,000 60,000
Common stock, $100 par 400,000 400,000
Retained earnings 130,000 101,000
Additional information:
1. The inventory turnover is 4 times
2. The return on common stockholders’ equity is 20%. The company had no additional paid-in
capital.
3. The accounts receivable turnover is 8.6 times.
4. The return on assets is 16%.
5. Total assets at December 31, 2015, were $685,000.
Instructions
Compute the following for Lewis Corporation.
(a) Cost of goods sold for 2016.
(b) Net sales (credit) for 2016.
(c) Net income for 2016.
(d) Total assets at December 31, 2016.
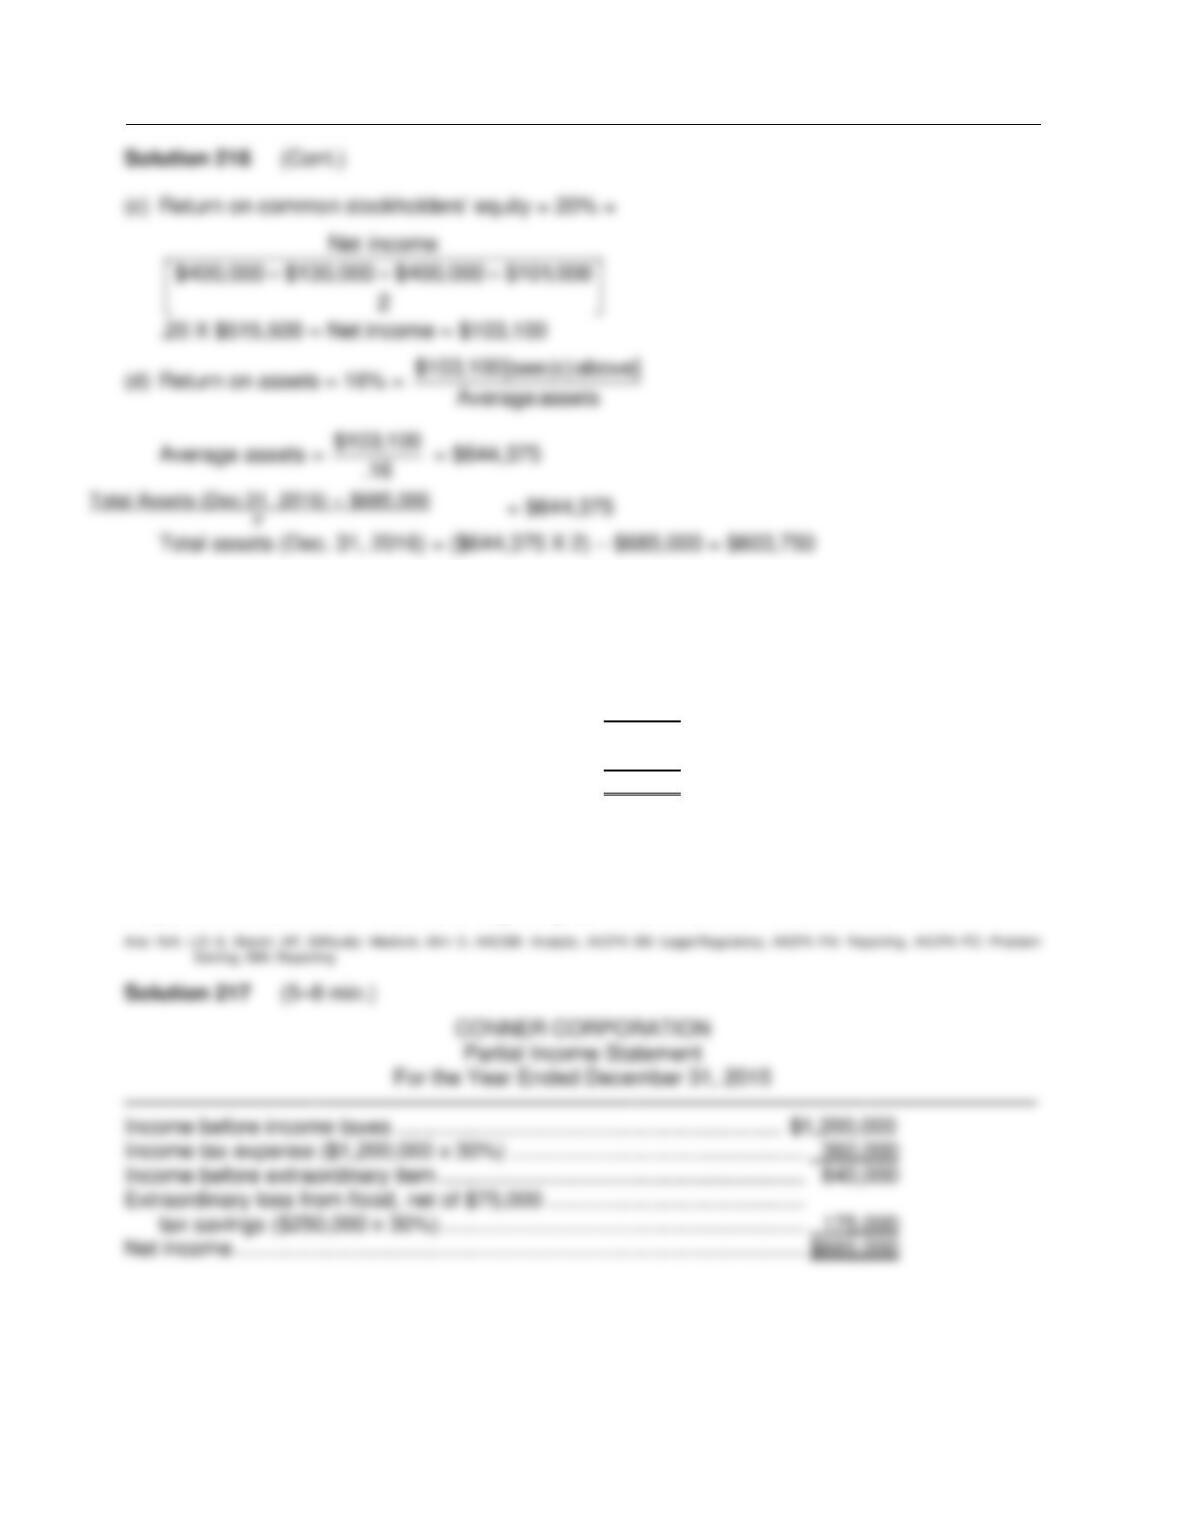
Test Bank for Financial Accounting, Ninth Edition
FOR INSTRUCTOR USE ONLY
14 – 72
Ex. 217
For its fiscal year ending December 31, 2015, Conner Corporation reported the following partial
data
Income before income taxes $1,200,000
Income tax expense (30% x 950,000) 285,000
Income before extraordinary items 915,000
Extraordinary loss from flood 250,000
Net income $665,000
The flood loss is considered an extraordinary item. The income tax rate is 30% on all items.
Instructions
Prepare a correct income statement, beginning with income before income taxes.
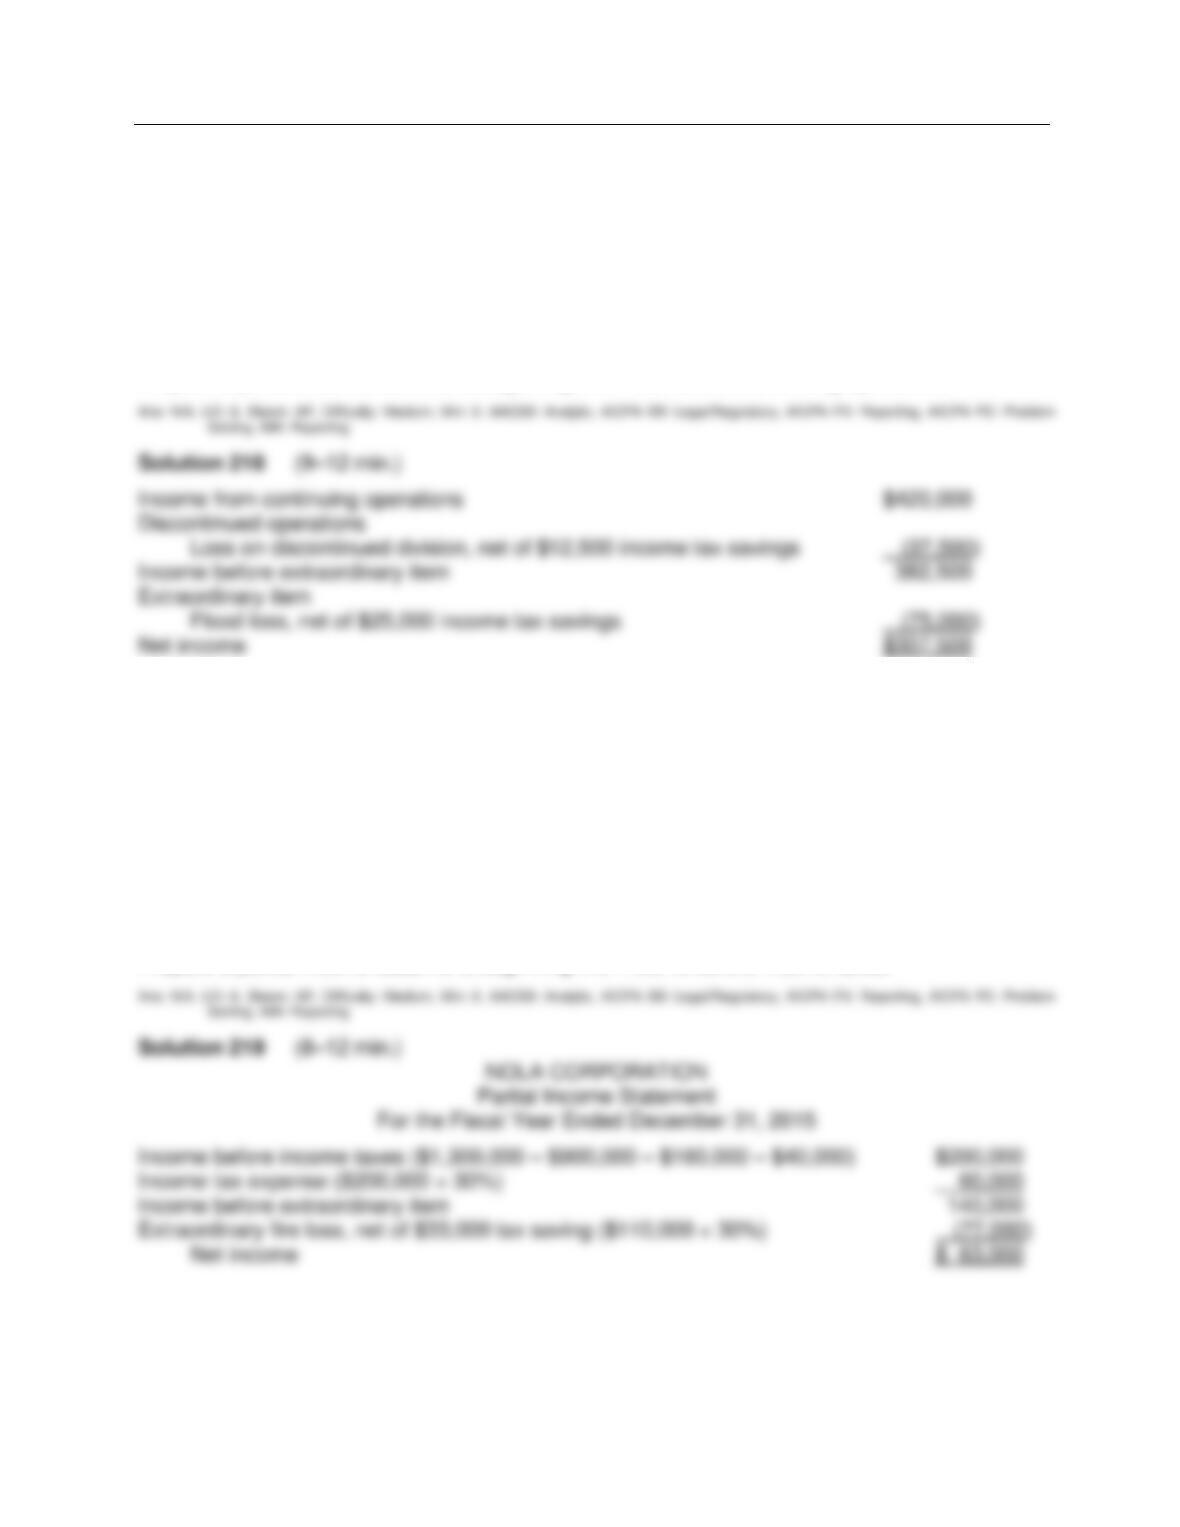
Financial Statement Analysis
FOR INSTRUCTOR USE ONLY
14 – 73
Ex. 218
Venti Corporation had income from continuing operations of $420,000 for the year ended
December 31, 2015. It also had the following items (before income taxes):
1. Extraordinary flood loss of $100,000.
2. Loss of $50,000 on discontinuance of a division.
All items are subject to income taxes at a 25% tax rate.
Instructions
Prepare a partial income statement, beginning with income from continuing operations.
Ex. 219
Nola Corporation gathered the following information for the fiscal year ended December 31, 2015:
Sales $1,300,000
Extraordinary fire loss 110,000
Selling and administrative expenses 160,000
Cost of goods sold 900,000
Loss on sale of equipment 40,000
Nola Corporation is subject to a 30% income tax rate.
Instructions
Prepare a partial income statement, beginning with income before income taxes.
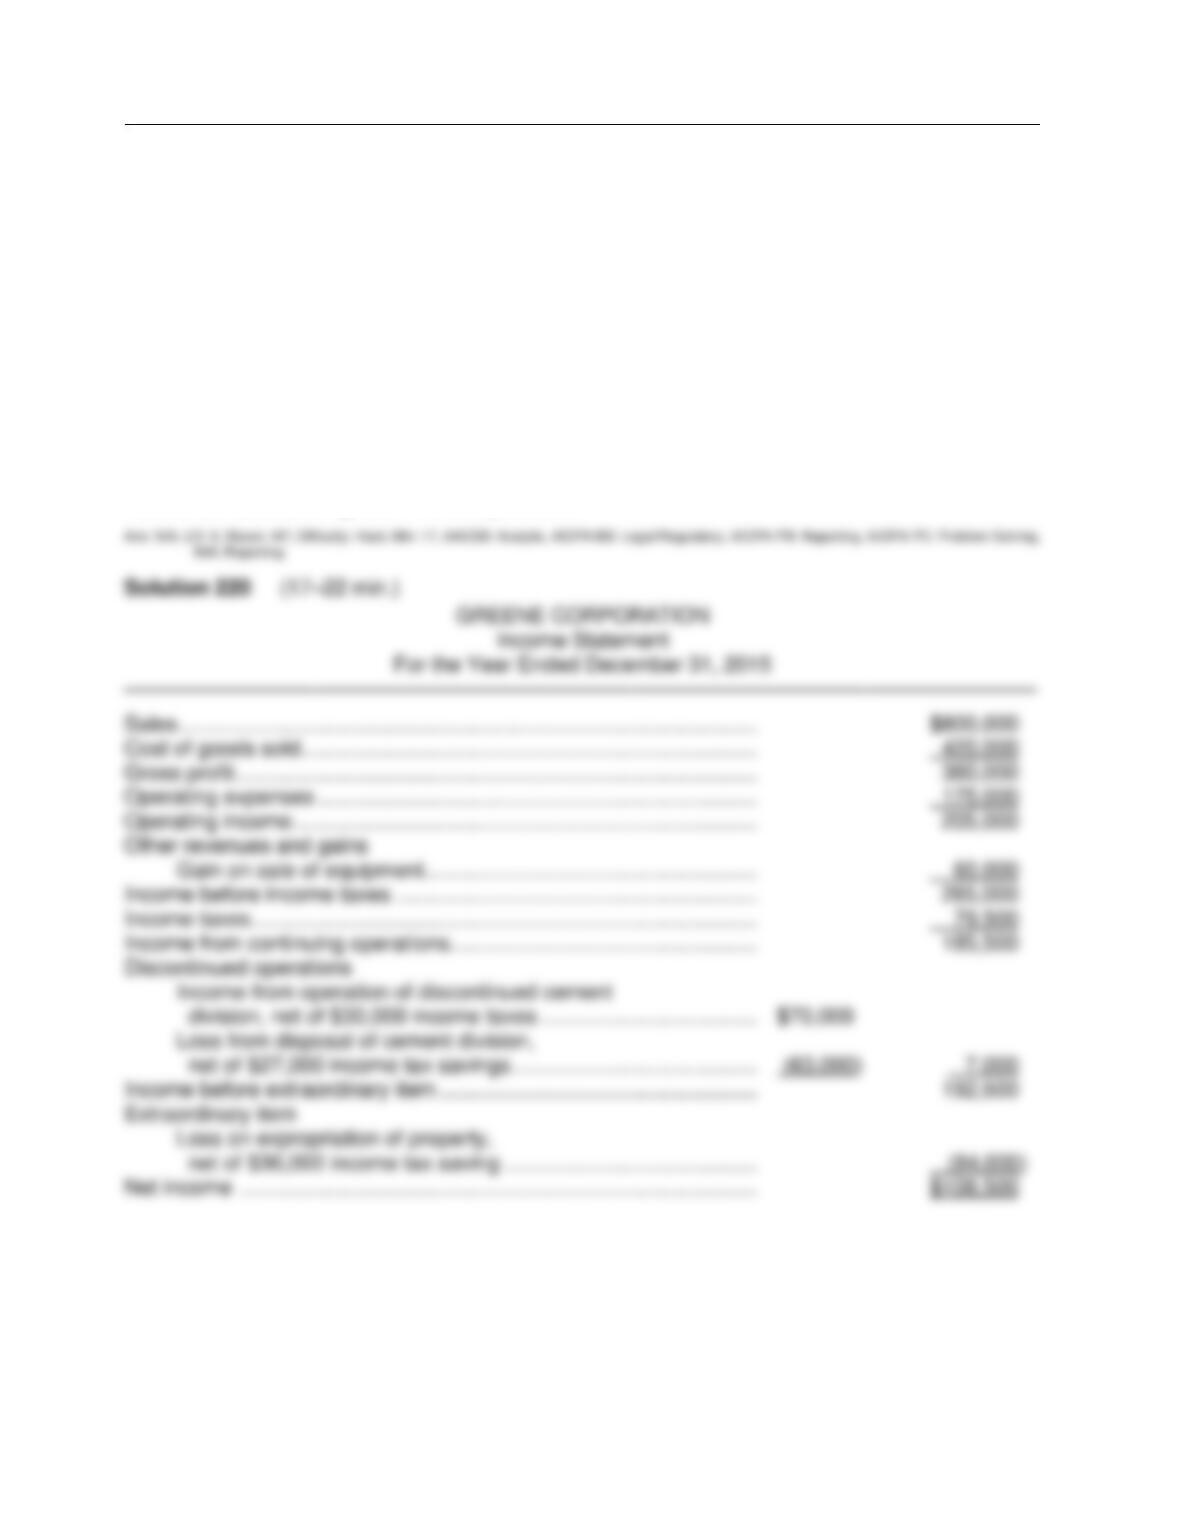
Test Bank for Financial Accounting, Ninth Edition
FOR INSTRUCTOR USE ONLY
14 – 74
Ex. 220
Greene Corporation had the information listed below available in preparing an income statement
for the year ended December 31, 2015. All amounts are before income taxes. Assume a 30%
income tax rate for all items.
Sales $ 800,000
Expropriation of property by a foreign government (loss) $ (120,000)
Income from operation of discontinued cement division $ 100,000
Loss from disposal of cement division $ (90,000)
Operating expenses $ 175,000
Gain on sale of equipment $ 60,000
Cost of goods sold $ 420,000
Instructions
Prepare a multiple-step income statement in good form which takes into account intraperiod
income tax allocation. Ignore EPS computations.
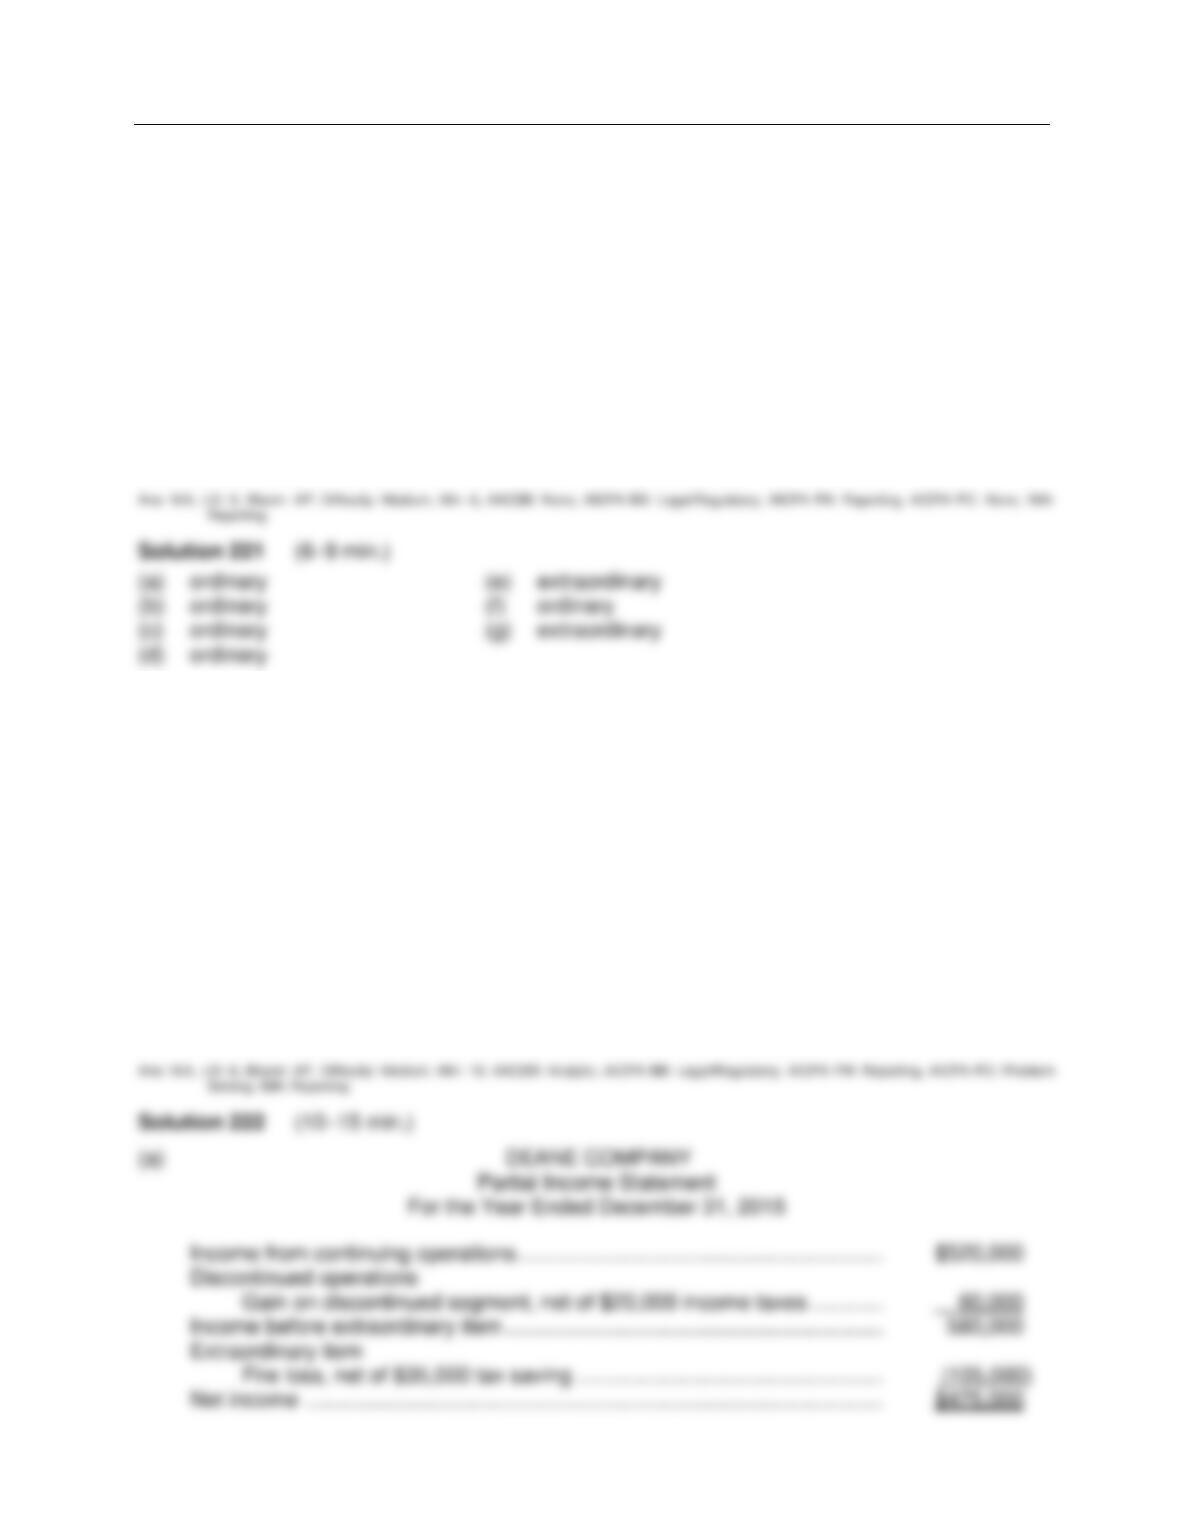
Financial Statement Analysis
FOR INSTRUCTOR USE ONLY
14 – 75
Ex. 221
Indicate whether the following items would be reported as an ordinary or an extraordinary item in
Mallak Corporation‘s income statement.
(a) Loss attributable to labor strike.
(b) Gain on sale of fixed assets.
(c) Loss from fire. Mallak is a chemical company.
(d) Loss from sale of short-term investments.
(e) Expropriation of property by a foreign government.
(f) Loss from hurricane damage. Mallak Corporation is located in the New Orleans area.
(g) Loss from government condemnation of property through newly enacted law.
Ex. 222
Deane Company has income from continuing operations of $520,000 for the year ended
December 31, 2015. It also has the following items (before considering income taxes):
(1) An extraordinary fire loss of $140,000.
(2) A gain of $80,000 on the discontinuance of a major segment.
(3) A correction of an error in last year’s financial statement that resulted in a $60,000
overstatement of 2014 net income.
Assume all items are subject to income taxes at a 25% tax rate.
Instructions
(a) Prepare an income statement, beginning with income from continuing operations.
(b) Indicate the statement presentation of any item not included in (a) above.
Test Bank for Financial Accounting, Ninth Edition
14 – 76
Solution 222 (Cont.)
COMPLETION STATEMENTS
223. In analyzing and interpreting financial statement information, three major characteristics
are generally evaluated: (1)____________, (2)_____________, and (3)_____________.
224. ______________ analysis, also called trend analysis, is a technique for evaluating a
percentage increase or decrease for a financial statement item over a period of time.
225. Expressing each item within a financial statement as a percentage of a base amount is
called ______________ analysis.
226. The ratios used in evaluating a company’s liquidity and short-term debt paying ability that
complement each other are the ______________ ratio and the ______________ ratio.
227. The accounts receivable turnover is calculated by dividing _________________ by
average ___________________.
228. If inventory turnover is 8 times, and the average inventory was $400,000, the cost of
goods sold during the year was $______________ and the days in inventory was
______________ days.
229. Stanton Corporation had net income for the year of $200,000 and a profit margin of 20%.
If total average assets were $400,000, the asset turnover ratio was ____________ times.
Financial Statement Analysis
FOR INSTRUCTOR USE ONLY
14 – 77
230. The ______________ ratio measures the percentage of earnings distributed in the form of
cash dividends.
231. The lower the ______________ to ______________ ratio, the more equity “buffer” there
is available to the creditors.
232. Times interest earned is calculated by dividing _____________ before _______________
and ________________ by interest expense.
233. Discontinued operations refers to the disposal of a ______________ of a business.
234. The two criteria necessary for an item to be classified as an extraordinary item are that the
transaction or event must be (1) __________________ and (2) ___________________.
235. A change in inventory methods during the year would be classified as a change in
__________________.
Test Bank for Financial Accounting, Ninth Edition
14 – 78
MATCHING
SET A
236. For each of the ratios listed below, indicate by the appropriate code letter, whether it is a
liquidity ratio, a profitability ratio, or a solvency ratio.
Code:
L = Liquidity ratio
P = Profitability ratio
S = Solvency ratio
____ 1. Price-earnings ratio
____ 2. Asset turnover
____ 3. Accounts receivable turnover
____ 4. Earnings per share
____ 5. Payout ratio
____ 6. Current ratio
____ 7. Acid-test ratio
____ 8. Debt to assets ratio
____ 9. Times interest earned
____ 10. Inventory turnover

Financial Statement Analysis
14 – 79
SET B
237. Match the ratios with the appropriate ratio computation by entering the appropriate letter in
the space provided.
A. Current ratio F. Times interest earned
B. Acid-test ratio G. Inventory turnover
C. Profit margin H. Average collection period
D. Asset turnover I. Days in inventory
E. Price-earnings ratio J. Payout ratio
Cost of goods sold
____ 1. —————————
Average inventory
Net income
____ 2. —————
Net sales
Cash dividends
____ 3. ———————
Net income
Net sales
____ 4. ———————
Average assets
Current assets
____ 5. ————————
Current liabilities
365 days
____ 6. ——————————
Accounts receivable turnover
Market price per share of stock
____ 7. ——————————————
Earnings per share
365 days
____ 8. ————————
Inventory turnover
Income before income taxes and interest expense
____ 9. ——————————————————————
Interest expense
Cash + short-term investments + receivables (net)
____ 10. ———————————————————————
Current liabilities
Test Bank for Financial Accounting, Ninth Edition
FOR INSTRUCTOR USE ONLY
14 – 80
SHORT-ANSWER ESSAY QUESTIONS
S-A E 238
Horizontal and vertical analyses are analytical tools frequently used to analyze financial
statements. What type of information or insights can be obtained by using these two techniques?
Explain how the output of horizontal analysis and vertical analysis can be compared to industry
averages and/or competitive companies.
S-A E 239
Harve Reardon, the CEO of Mythic Products, is a successful entrepreneur but a poor student of
accounting. He asks you to explain to him, in a memo, the bases of comparison for ratio analysis.
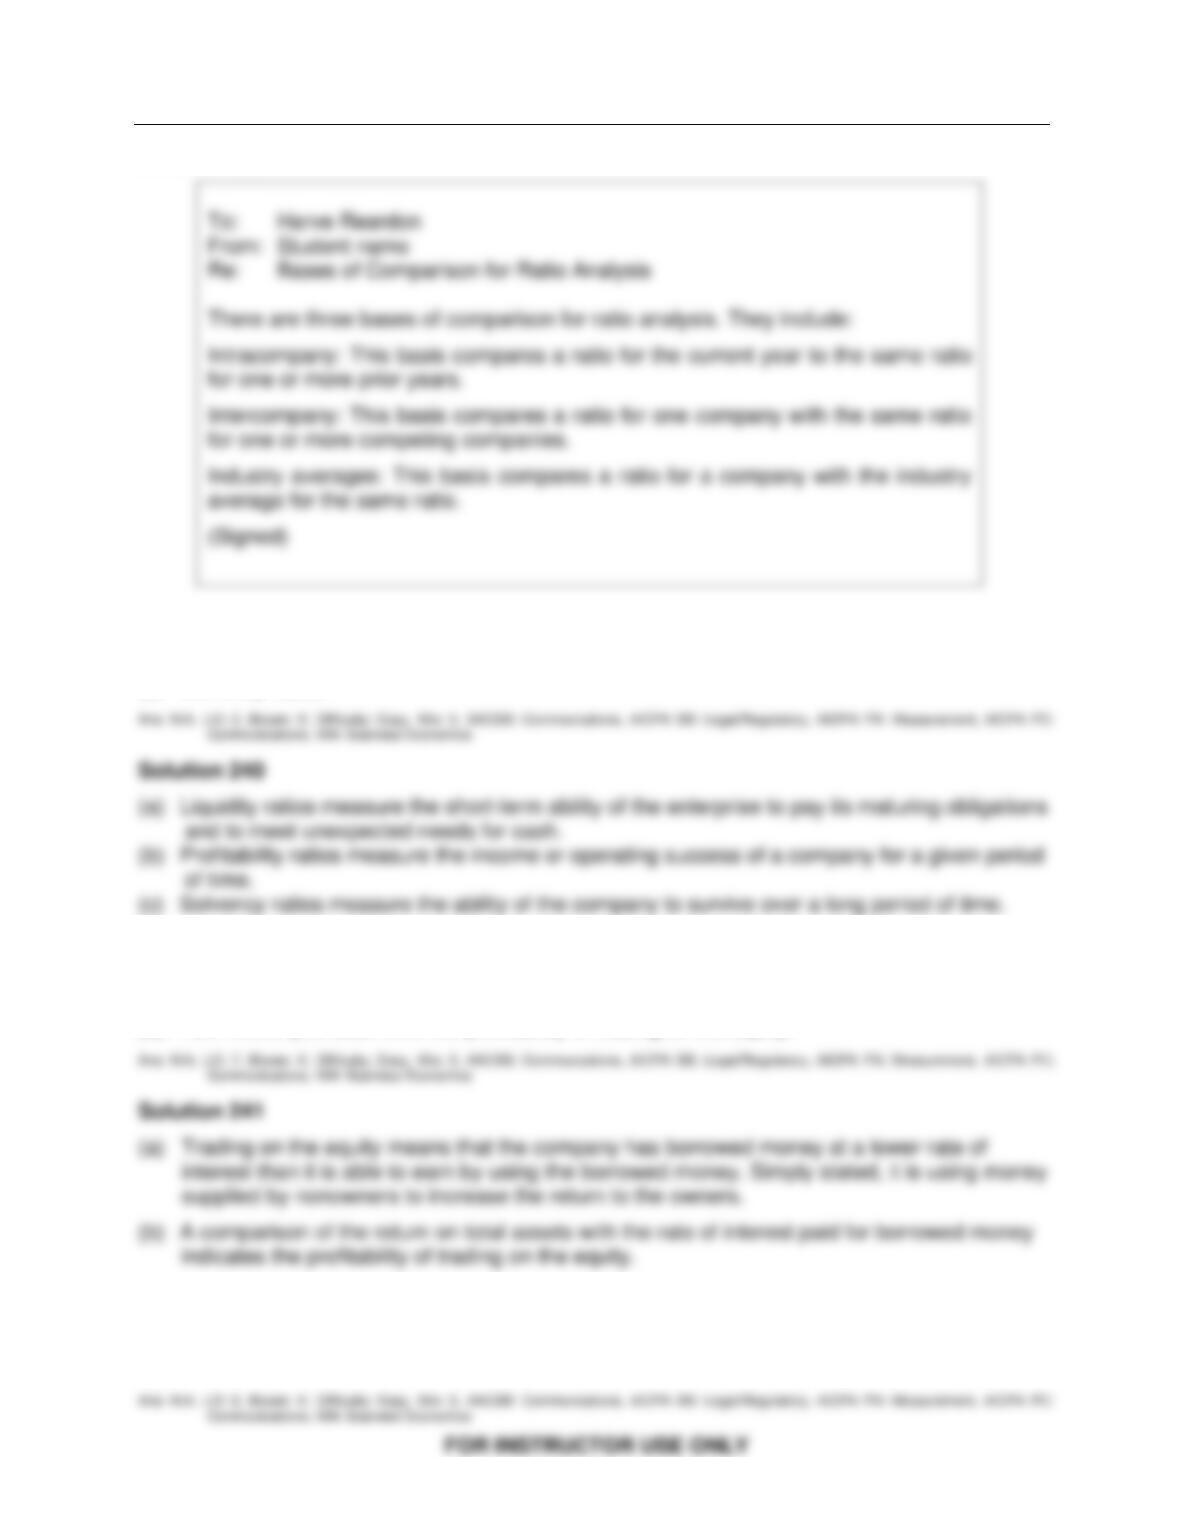
Financial Statement Analysis
14 – 81
Solution 239
S-A E 240
What do the following classes of ratios measure? (a) Liquidity ratios. (b) Profitability ratios.
(c) Solvency ratios.
S-A E 241
(a) What is meant by trading on the equity?
(b) How would you determine the profitability of trading on the equity?
S-A E 242
Why is it important to report discontinued operations separately from income from continuing
operations?
Test Bank for Financial Accounting, Ninth Edition
FOR INSTRUCTOR USE ONLY
14 – 82
Solution 242
S-A E 243 (Ethics)
A trusted employee of Outback Tours was caught in the act of embezzling funds. He confessed to
earlier embezzlements, but retracted the confession on the advice of his attorney. Over the
course of the most recent quarter, it has been determined that $20,000 was embezzled.
Outback Tours has suffered adverse publicity in the recent past because of serious injury to five
tourists that occurred during a two week “Winter Wilds Adventure” tour. The company has
therefore decided to avoid publicity and has agreed to drop all charges against the embezzling
employee. In return, the employee has agreed to a notation of “Terminated—Not to be Rehired”
to be appended to his personnel file.
Required:
1. Who are the stakeholders in the decision not to prosecute?
2. Was it ethical for the company to decide not to prosecute? Explain.
Financial Statement Analysis
14 – 83
S-A E 244 (Communication)
Phast Express specializes in the overnight transportation of medical equipment and laboratory
specimens. The company has selected the following information from its most recent annual
report to be the subject of an immediate press release.
• The financial statements are being released.
• Net income this year was $2.12 million. Last year’s net income had been $2.0 million.
• The current ratio has changed to 2:1 from last year’s 1.4:1
• The debt/assets ratio has changed to 3:5 from last year’s 2:5
• The company expanded its truck fleet substantially by purchasing ten new delivery vans. The
company already had twelve delivery vans.
• The company is now the largest medical courier in the mid-Atlantic region.
Required:
Prepare a brief press release incorporating the information above. Include all information. Think
carefully which information (if any) is good news for the company, and which (if any) is bad news.
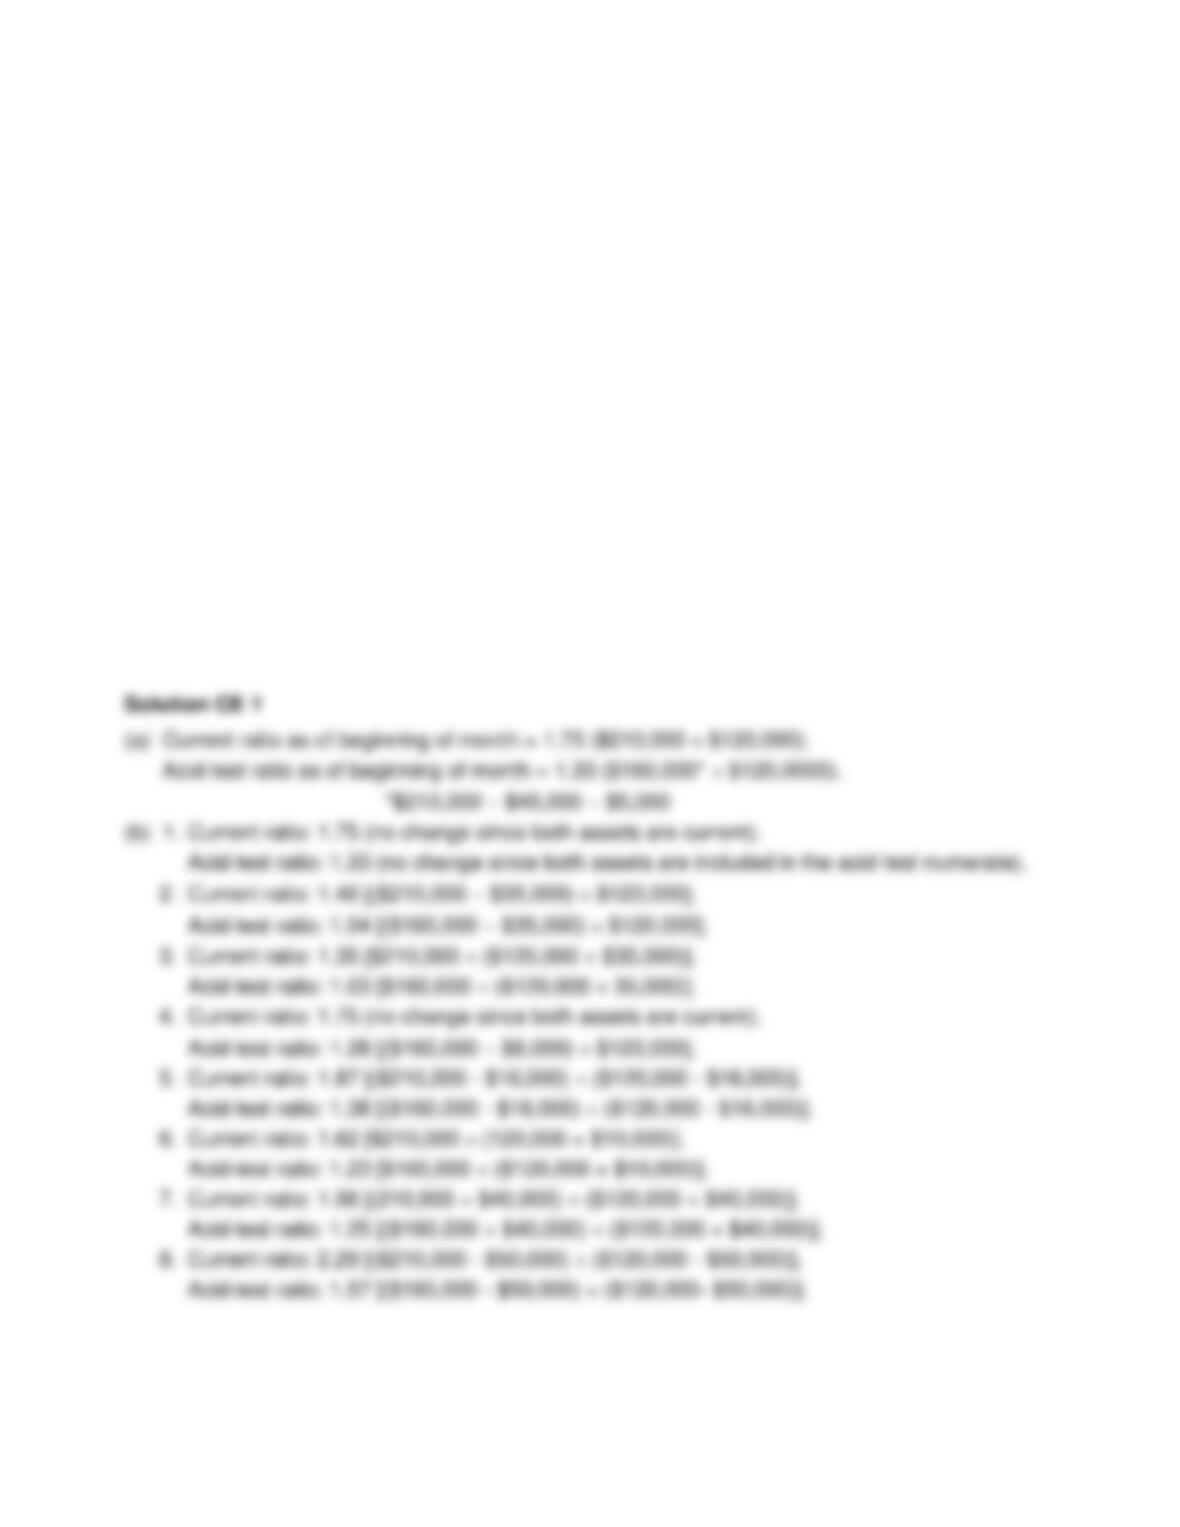
Test Bank for Financial Accounting, Ninth Edition
FOR INSTRUCTOR USE ONLY
14 – 84
CHALLENGE EXERCISES
CE 1
Stine Company has the following potential transaction involving current assets and current
liabilities.
1. Accounts receivable of $20,000 are collected.
2. Equipment is purchased for $35,000 cash.
3. Equipment is purchased by signing a 1-year, 35,000 note.
4. Paid $6,000 for a 3-year insurance policy.
5. Paid $16,000 of accounts payable.
6. Cash dividends of $10,000 are declared.
7. Borrowed $40,000 by signing a short-term note payable.
8. Paid a $50,000 short-term note payable.
As of the beginning of the month, current assets were $210,000, and current liabilities were
$120,000. Current assets included $45,000 of inventory and $5,000 of prepaid expenses.
Instructions
(a) Compute the current ratio and acid-test ratio as of the beginning of the month.
(b) Compute the current ratio and acid-test ratio after each transaction. Treat each transaction
independently (assume each occurs on the first day of the month, and no other transaction have
affected the beginning-of -month balances.
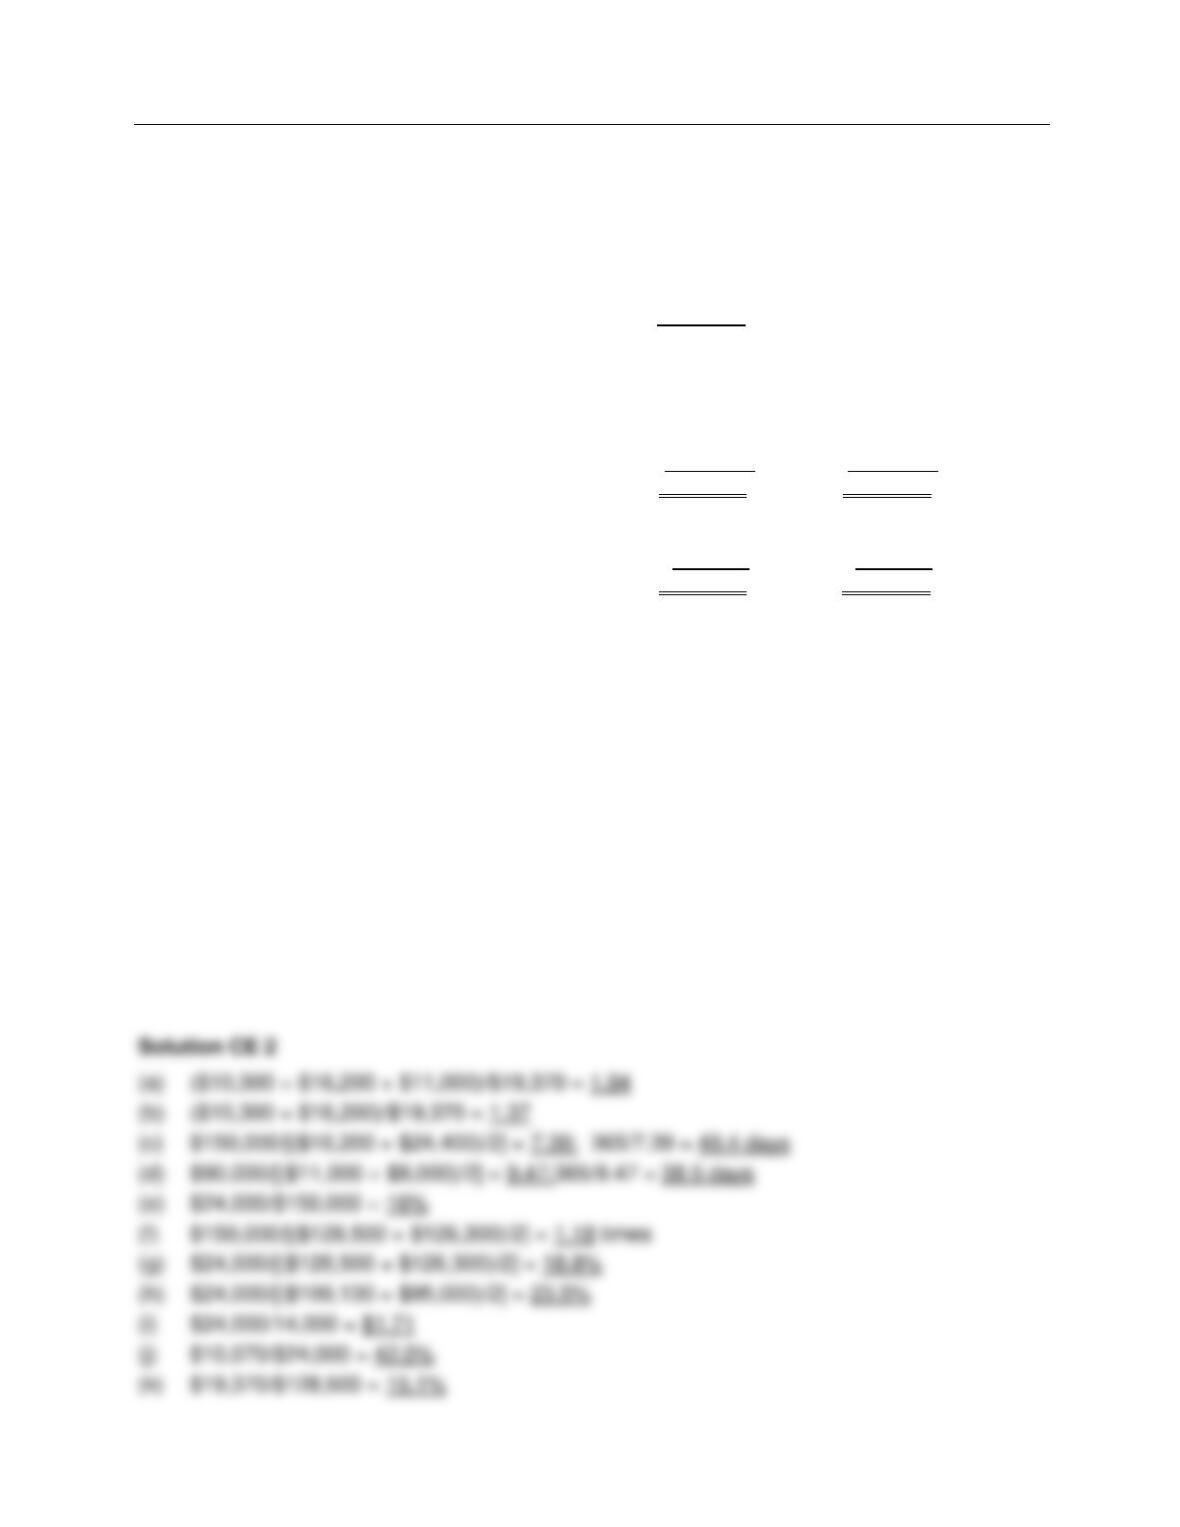
Financial Statement Analysis
FOR INSTRUCTOR USE ONLY
14 – 85
CE 2
Nyland Corporation‘s comparative balance sheets are presented below.
NYLAND CORPORATION
Balance Sheets
December 31
2015 2014
Cash $ 10,300 $ 3,900
Accounts receivable 16,200 24,400
Inventory 11,000 8,000
Land 32,000 28,000
Buildings 74,000 74,000
Accumulated depreciation (15,000) (12,000)
Total $128,500 $126,300
Accounts payable $ 19,370 $ 31,100
Common stock ($5 par) 70,000 70,000
Retained earnings 39,130 25,200
Total $128,500 $126,300
Mulder’s 2015 income statement included net sales of $150,000, cost of good sold of $90,000,
and net income of $24,000. Dividends of $10,070 were paid.
Instructions
Compute the following ratios for 2015.
(a) Current ratio.
(b) Acid-test ratio
(c) Accounts Receivable turnover and average collection period.
(d) Inventory turnover and days in inventory.
(e) Profit margin.
(f) Assets turnover.
(g) Return on assets.
(h) Return on common stockholders’ equity.
(i) Earnings per share.
(j) Payout ratio.
(k) Debt to assets.
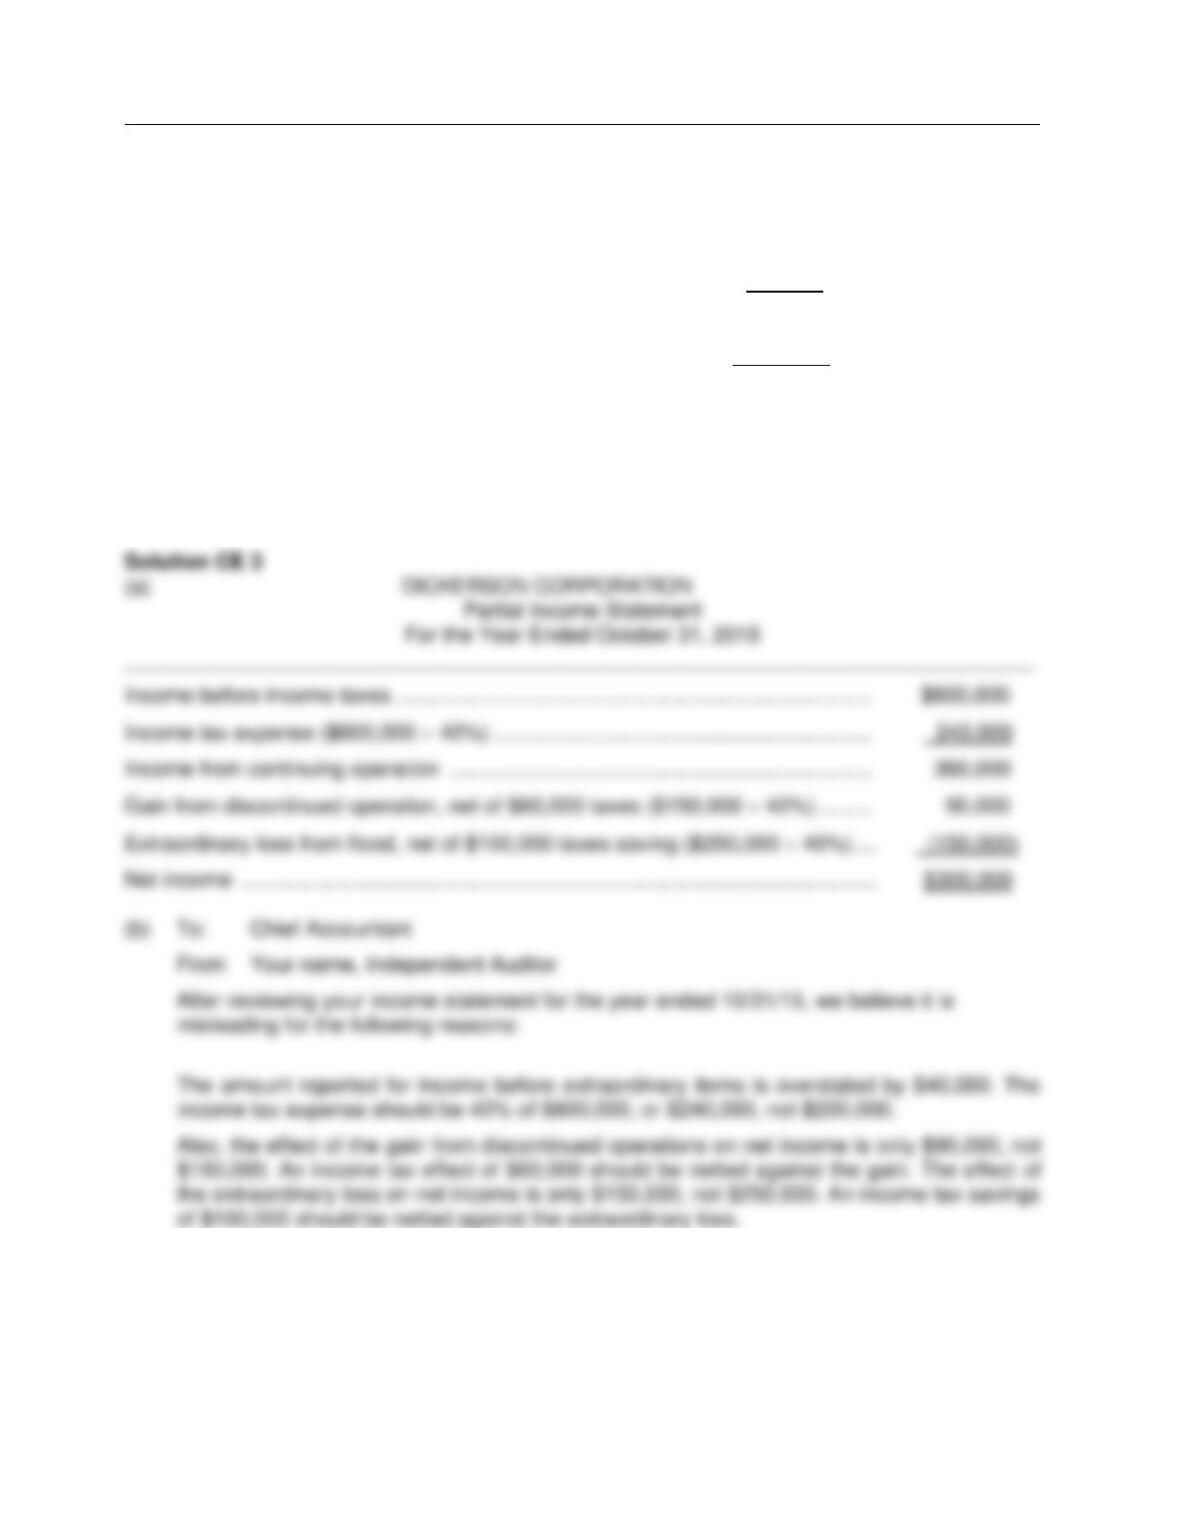
Test Bank for Financial Accounting, Ninth Edition
FOR INSTRUCTOR USE ONLY
14 – 86
CE 3
For its fiscal year ending October 31, 2015, Dickerson Corporation reports the following partial
data.
Income before income taxes $600,000
Income tax expense (40% $500,000) 200,000
Income from continuing operations 400,000
Gain from discontinued operation 150,000
Extraordinary loss from flood (250,000)
Net income $300,000
The flood loss is considered an extraordinary item. The income tax rate is 40% on all items.
Instructions
(a) Prepare a correct income statement, beginning with income before income taxes.
(b) Explain in memo form why the income statement data are misleading.