Elements of Ecology, 9e (Smith)
Chapter 14 Predation
14.1 Short Answer Questions
1) ________ is the consumption of one living organism by another.
2) A species that consumes only animal tissue is called a(n) ________.
3) A species that consumes both plant and animal tissue is called a(n) ________.
4) A(n) ________ is an organism that lives on or within another without killing the host.
5) The per capita rate at which predators consume prey is assumed to increase ________ with the
number of prey.
6) The cycle of change in the size of predator and prey populations in response of one to the
other is known as ________.
7) The relationship between the per capita rate of consumption and the number of prey is known
as the predator’s ________ response.

8) The increase in a predator’s reproduction in response to an increase in the consumption of prey
is known as the predator’s ________ response.
9) A Type ________ functional response describes the per capita rate of predation, which
increases linearly with prey density.
10) A Type ________ functional response occurs when the rate at which prey are consumed is
low at first, increases, and then decreases in an S-shaped fashion as the rate of predation
approaches the maximum value.
11) The recognition of a particular species as potential prey by a predator is called a(n) ________
image.
12) The movement of predators into areas of high prey density is a type of numerical response
referred to as a(n) ________ response.
13) The trade-off between conflicting demands faced by a predator is described by the ________
foraging theory.
14) The costs of foraging can be measured in terms of the time and ________ expended in the
act of foraging.
15) The concept of ________ energy is the basis for models of optimal foraging.
16) Most predators are also ________ to other predatory species.
17) Animals that are boldly colored or patterned to warn potential predators possess warning
coloration or ________.
18) ________ mimicry occurs when a nontoxic species closely resembles a toxic species, both of
which are avoided by predators.
19) ________ mimicry occurs when many unpalatable or venomous species share a similar color
pattern.
20) ________ defenses are not permanently present but, rather, are brought about by the
presence or action of predators.
21) ________ is a deliberate form of hunting with a quick attack.
22) ________ prey on autotrophs and do not kill the individuals they feed on.
23) A plant may be able to compensate for the loss of leaves by increasing the rate of ________
in the remaining leaves.
24) Many plants use ________ defenses, such as hairy leaves, thorns, or spines, to deter
herbivory.
14.2 Multiple-Choice Questions
1) An organism that feeds on plant or algal tissues is referred to as a(n)
A) herbivore.
B) omnivore.
C) carnivore.
D) decomposer.
2) A true predator is a species that
A) feeds upon any part of any organism, not necessarily killing it.
B) feeds only on animals.
C) kills its prey more or less immediately upon capture.
D) feeds on dead or living prey.
3) Which of the following is functionally a true predator?
A) parasite
B) planktivore
C) grazer
D) parasitoid
4) A parasitoid
A) is a true predator.
B) actively pursues its prey.
C) attacks the host indirectly by laying its eggs in or on the prey’s body.
D) preys only on animals.
5) In a graph that plots prey population (Nprey) on the x-axis against the number of predator
offspring produced per unit of time on the y-axis, the slope represents the
A) efficiency of predation (c).
B) efficiency with which food is converted into predator population growth or reproduction (b).
C) predator population growth rate (r).
D) the rate of increase in prey availability.
6) In the basic Lotka-Volterra equations that describe predator-prey interactions, the growth rate
of the prey population (dNprey/dt) is zero when the density of predators (Nprey) is equal to
A) r/N.
B) N/r.
C) r/c.
D) c/r.
7) The net outcome of predator-prey interactions in the basic Lotka-Volterra models is that
A) the predator drives its prey to extinction and then goes extinct itself.
B) the prey population declines and this causes the predator population to also decline.
C) predator and prey populations eventually converge on equilibrium population sizes that are
maintained into infinity.
D) predator and prey populations oscillate, with each predictably increasing and decreasing in
response to the other.
8) In a simple experiment involving only predator and prey with no refuge,
A) prey will always survive.
B) predators will typically drive their prey to extinction.
C) both populations will oscillate.
D) prey populations will oscillate.
9) Huffaker’s experiment involving oranges showed
A) predators will always consume prey to extinction.
B) prey will always outlast predators.
C) with enough complexity, predator and prey populations will oscillate.
D) both species use oranges for refuge.
10) In the Lotka-Volterra model of predator-prey interactions, population growth is regulated
through
A) reproduction for both predator and prey.
B) reproduction for the predator and mortality for the prey.
C) reproduction for the prey and mortality for the predator.
D) mortality for both predator and prey.
11) European kestrels feed on Microtus voles, with the “kill” rate, defined as the number of prey
taken during the breeding season, as linearly proportional to the density of Microtus. This type of
functional response is referred to as
A) Type I.
B) Type II.
C) Type III.
D) Type IV.
12) When a predator drives down a prey population to a low abundance, it will often
A) switch prey species.
B) consume prey to extinction.
C) go extinct.
D) decrease handling time of prey.

13) The sigmoidal relationship between prey density and per capita predation rate in a Type III
functional response can be explained by all of the following factors, except
A) prey access to refuge.
B) predator preference.
C) recognition of prey by predator.
D) predator density.
14) With a highly abundant prey population size, which component of the functional response is
most reduced?
A) handling time
B) prey population
C) search time
D) killing time
15) The maximum number of prey consumed per predator per unit time is limited by
A) Nprey.
B) Npredator.
C) Ts.
D) T/Th.
16) When predators come together in areas of high prey density, it is referred to as
A) predator satiation.
B) predator preference.
C) a functional response.
D) an aggregative response.
17) Which of the following is a positive numerical response of a predator in response to an
increase in prey density?
A) decrease in predator mortality rate
B) increase in predator survival rate
C) immigration of predators to an area of high prey density
D) decrease in predator reproduction rate
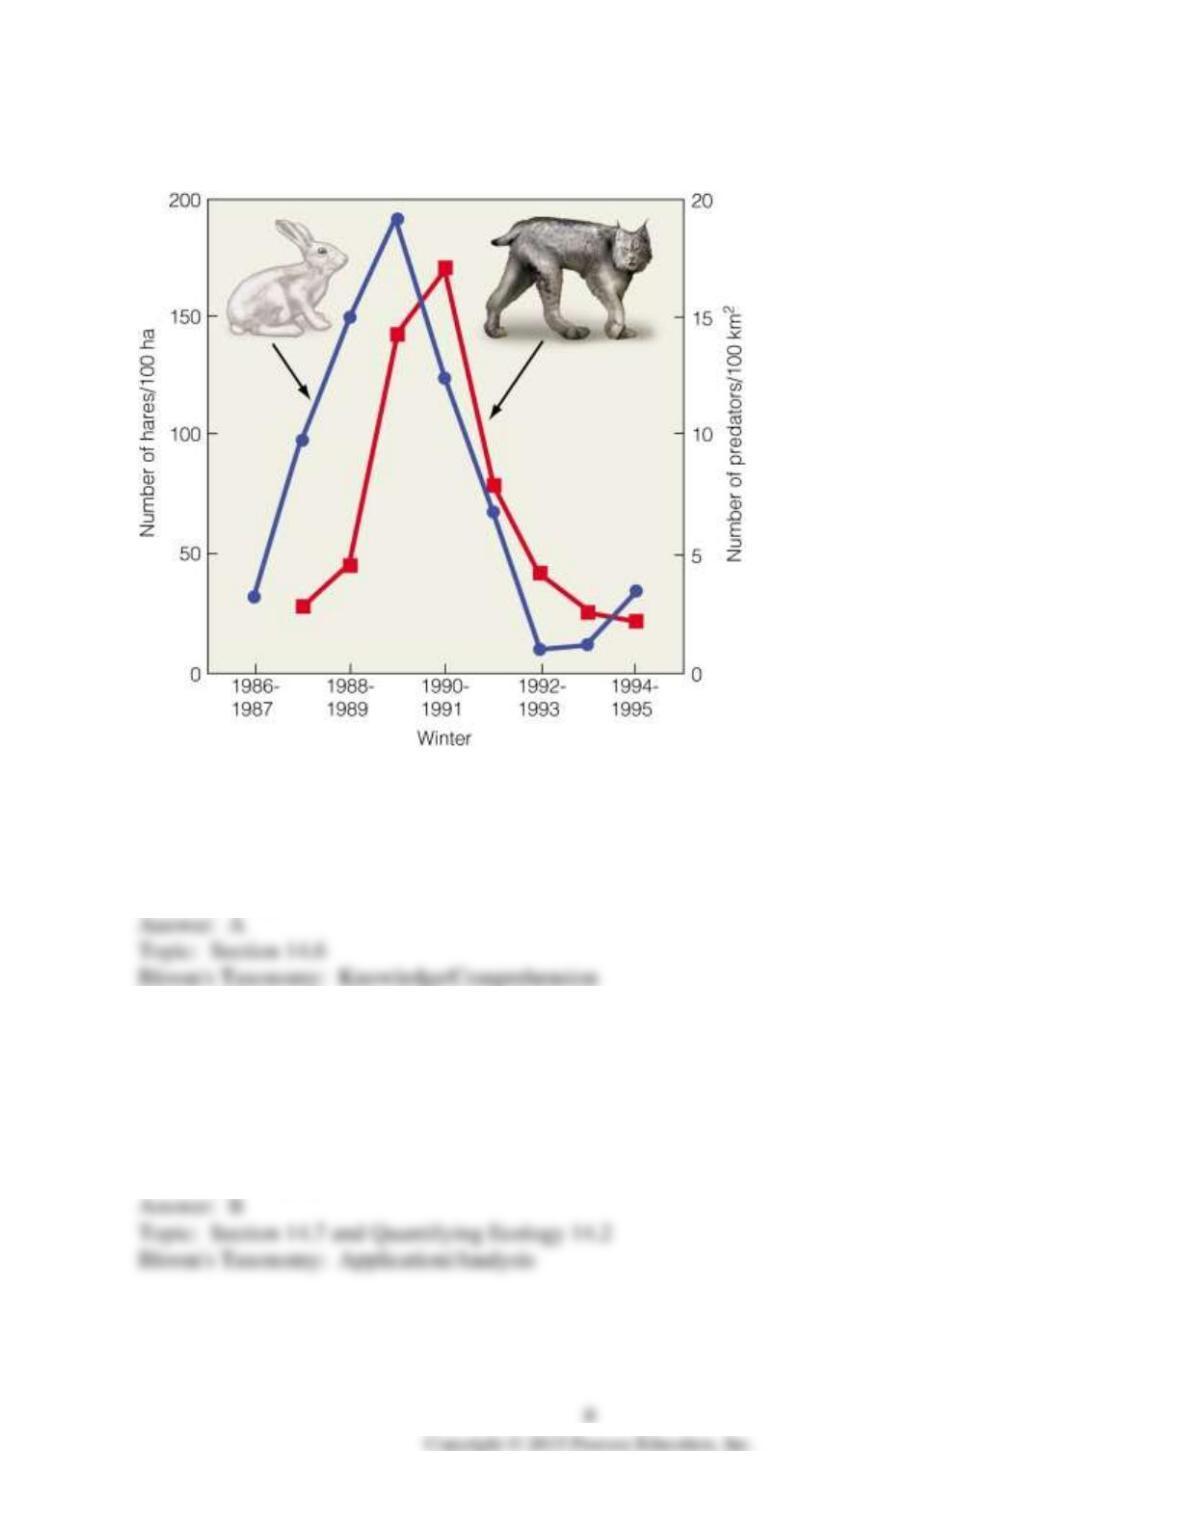
18)
This figure shows that
A) lynx populations numerically respond to hare populations.
B) lynx become better able to capture prey over time.
C) lynx become worse at capturing prey over time.
D) hares will go extinct over time.
19) According to the optimal foraging theory, a predator will select prey 1 (P1) over prey 2 (P2)
when
A) E1 < E2.
B) Th1 < Th2.
C) E1/Th1 < E2/Th2.
D) Nprey1 > N prey2.
20) The profitability of a prey item
A) increases as its handling time (Th) increases.
B) decreases as its search time (Ts) decreases.
C) increases as its energy content (E) decreases.
D) increases as its E/Th increases.
21) According to the Red Queen hypothesis,
A) the population density of a predator depends on the population density of its prey.
B) natural selection should favor the most efficient foragers.
C) prey must continually evolve means of avoiding capture to avoid extinction.
D) most predators consume a varied diet in order to meet their nutritional requirements.
22) Coevolution between predator and prey suggests
A) as prey decrease in number, predators will switch prey.
B) as predators become smarter at catching prey, prey will become smarter at escaping predation.
C) as predators feed on prey, prey will become more palatable over time.
D) as predators drive down prey populations, they become worse at catching prey.
23) If you are stranded on a desert island, which prey should you avoid consuming?
A) fast mobile prey
B) large prey
C) cryptic prey
D) brightly colored prey
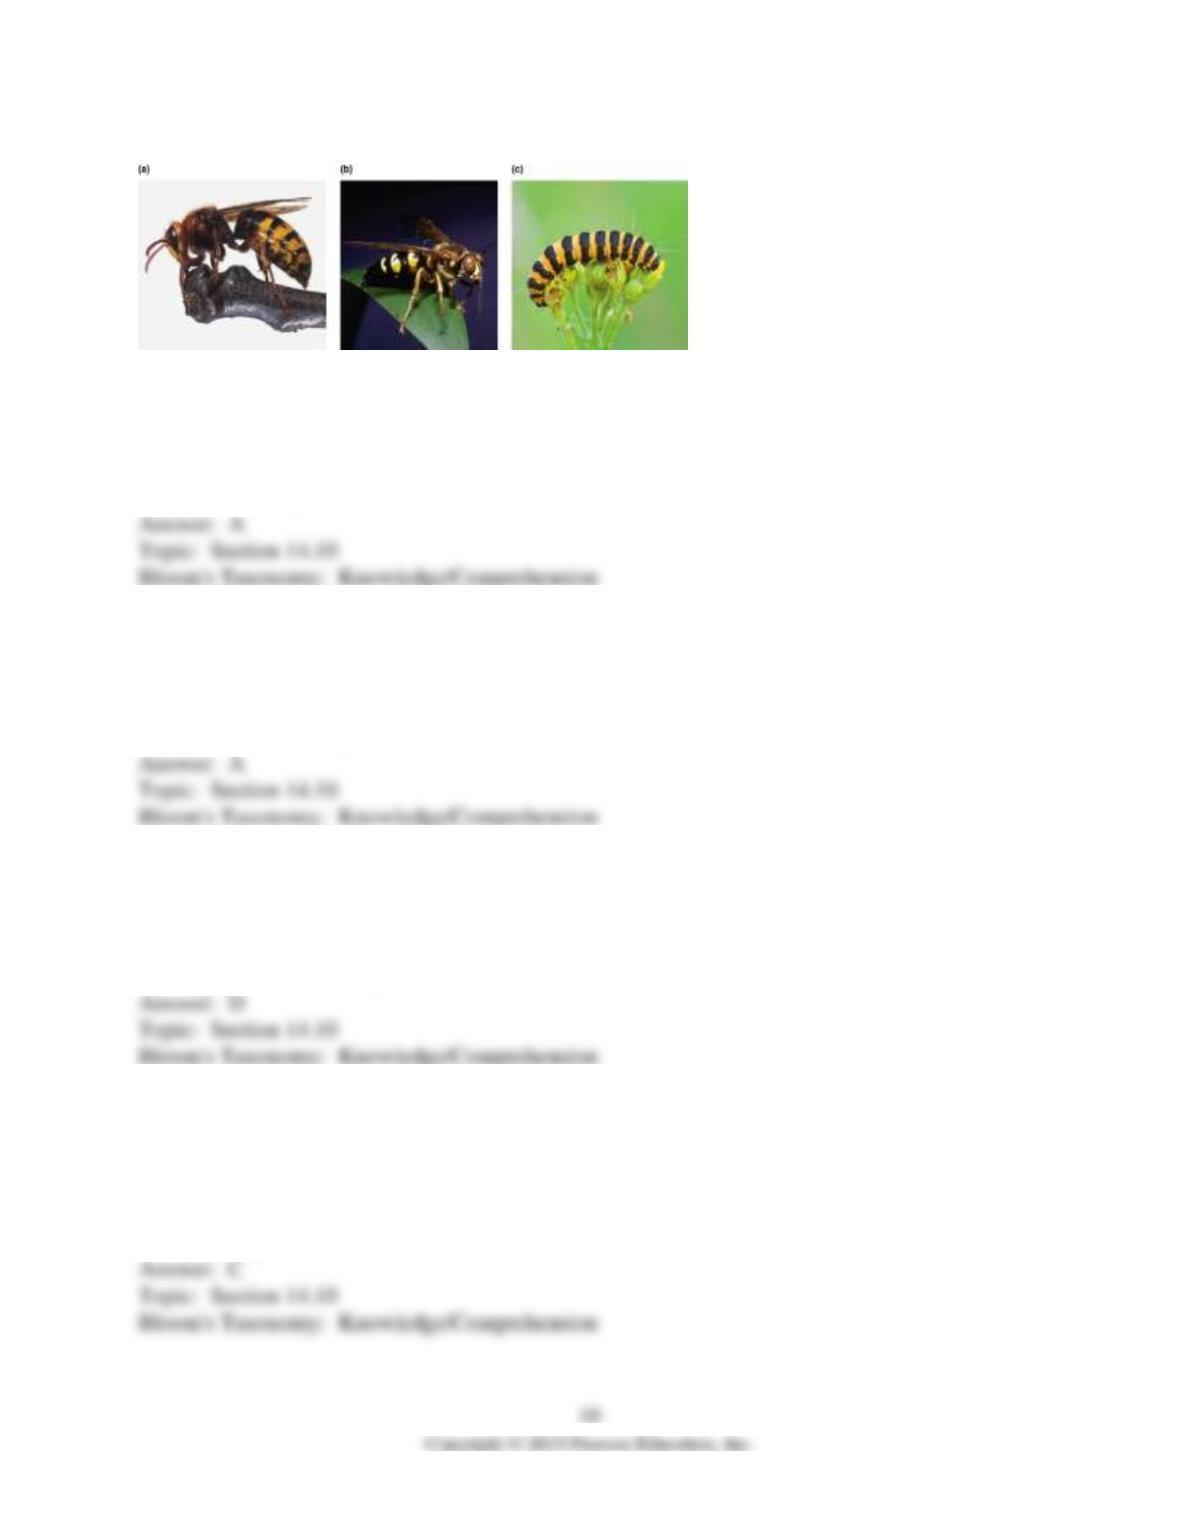
24)
All three of these species are harmful. This is an example of
A) Müllerian mimicry.
B) Batesian mimicry.
C) optimal foraging theory.
D) functional response.
25) Which of the following is an example of cryptic coloration?
A) a brown bird that nests on the ground
B) a deer with a large, white tail
C) skunks with black and white stripes
D) snakes with black, yellow, and red bands
26) Which of the following is an example of Müllerian mimicry?
A) walking sticks that resemble twigs
B) stinkbugs that produce a noxious odor
C) flounders whose colors resemble the sea floor
D) wasps with black and yellow bands
27) When prey produce so many offspring in a short period of time that predators can attack only
a fraction of them, it is referred to as
A) a numerical response.
B) a functional response.
C) predator satiation.
D) cryptic reproduction.
28) Which animal does not employ protective armor for predator defense?
A) armadillo
B) beetle
C) scorpion
D) porcupine
29) Which of the following is an induced defense?
A) bright coloration of poison dart frogs
B) high-pitched alarm calls by a squirrel
C) background color matching by a chameleon
D) walking sticks resembling twigs
30) Which of the following hunting methods has the lowest frequency of success but requires the
least amount of energy?
A) satiation
B) ambush
C) stalking
D) pursuit
31) Which of the following is not a class of plant secondary compounds?
A) terpenoids
B) phenolics
C) nitrogen-based compounds
D) alkanes
32) Quantitative inhibitors
A) are produced in small quantities by a plant.
B) are toxic to herbivores.
C) reduce digestibility of plant material.
D) include cyanide and alkaloids.
33) Which of the following is considered a nonlethal effect of predation?
A) reduced activity of prey
B) prey consumption
C) reduced competition
D) increased predator mortality
34) The ideal number of fish to catch to provide the most yield while sustaining fisheries is
A) at K/2.
B) at K.
C) dN/dt.
D) rN(1 – N/K).
35) Which of the following caused massive declines in U.S. commercial fish populations?
A) recreational anglers
B) freak weather events in the 1980s
C) huge factory trawlers
D) foreign commercial fisherman
14.3 True/False Questions
1) Scavengers are heterotrophs.
2) Grazers and browsers are true predators.
3) In the Lotka-Volterra models of predator-prey interactions, prey density does not influence
predator mortality.

4) In the Lotka-Volterra equations that represent predator-prey interactions, predators are a
source of density-independent mortality for prey.
5) The Lotka-Volterra model of predator-prey interactions assumes a mutual regulation of
predator and prey populations.
6) The response of a predator’s consumption rate to prey density is a key factor as to whether a
predator can regulate a prey population.
7) A Type I functional response leads to regulation of the prey population by the predator.
8) A Type III functional response is the most commonly reported for predators.
9) One explanation for the shape of the Type II functional response is that predators develop a
search image for prey after they have encountered them.
10) Most predator populations grow slowly in comparison to those of their prey.
11) The amount of time an organism spends foraging must be balanced against other time
constraints, such as defense, avoiding predators, searching for mates, or caring for young.

12) It is difficult to quantify the consequences of a specific behavioral choice on the probability
of survivorship and reproduction.
13) The risk of predation can sometimes have a significant impact on the foraging choices made
by animals.
14) As prey species evolve more effective means to avoid being caught, predators evolve more
effective means to capture them.
15) Some animals acquire their toxic chemical compounds from plants that they consume.
16) Acoustic mimicry by some nonvenomous snakes that rattle their tails like rattlesnakes is a
form of Müllerian mimicry.
17) Cryptic coloration is a strategy employed only by prey.
18) Pursuit hunting requires minimal search time.
19) Herbivory does not affect a plant’s ability to survive.
20) If defoliation of trees is complete, the leaves that regrow are often larger than the original
leaves.
21) Most grasses tolerate grazing and actually benefit from it.
22) Quantitative inhibitors in plants are toxic secondary compounds, often causing herbivores to
avoid their consumption.
23) Some plants are able to attract beneficial insects that act as predators on the herbivores of
that plant.
24) Carnivores can have an indirect, positive effect on plants by reducing populations of
herbivores.
14.4 Essay Questions
1) Define predation. Compare and contrast the three types of predation.
2) What is the primary prediction of the basic Lotka-Volterra equations of predator-prey
interactions? Is this prediction realistic? Does it fit with our observations of predators and prey in
nature?
3) Use a graph to illustrate the differences among the three types of functional responses between
predators and prey. What factors are the most likely explanation for each of these functional
responses?
4) Describe how predators respond numerically to changing prey density.
5) Describe the factors that may potentially affect an animal’s decision about how it forages in a
food patch.
6) When glaucous-winged gulls forage for prey (e.g., mussels and urchins), what factors are
expected to influence prey selection?
7) Compare and contrast two types of mimicry, and give an example of each.
8) Discuss the costs and benefits of each of the three hunting methods employed by predators.
9) Describe several strategies that a plant can employ to counteract herbivory before, during, and
after it occurs. What are some of the costs associated with these defense mechanisms?
10) Graphically illustrate an example of the three-way interaction among a carnivore, an
herbivore, and a plant. Explain how the plant is affected by both direct and indirect interactions.
11) Explain how nonlethal effects of predators on prey can have important impacts on prey
population dynamics.