Chapter 14: Inference for Counts: Chi-Square Tests – Quiz A
Name ________________________________________
14.1.1. Find expected counts and compute test statistics.
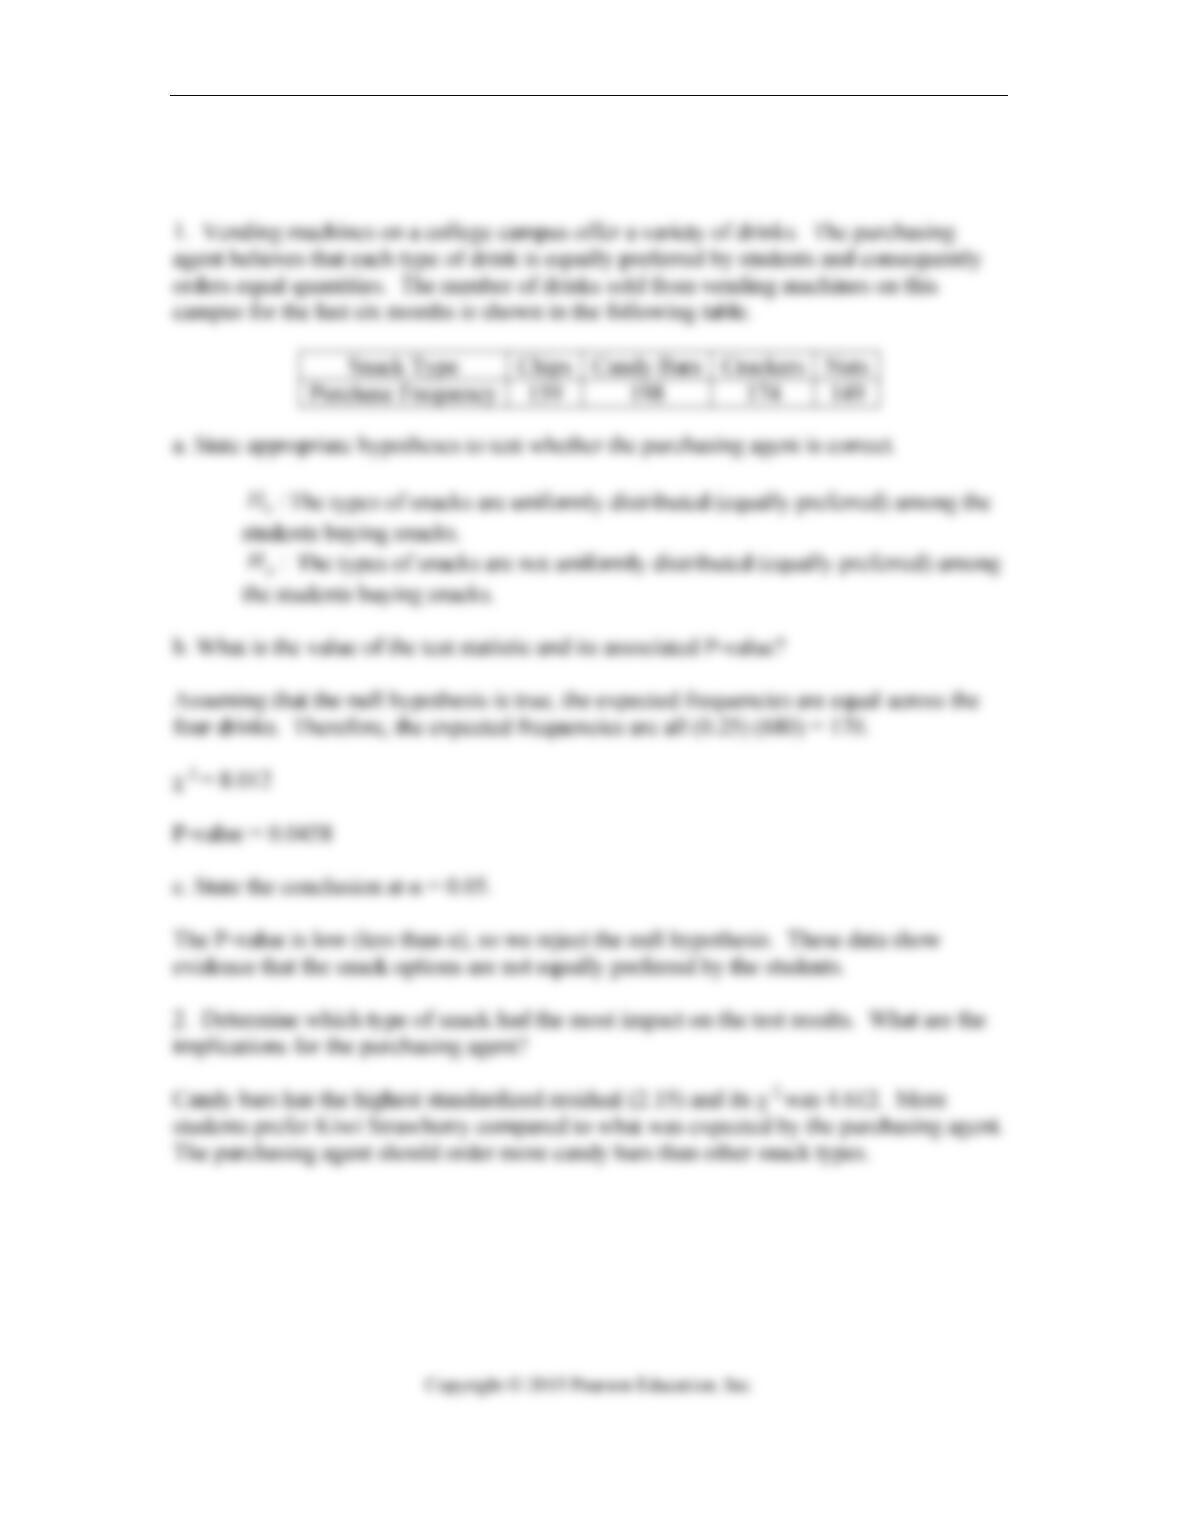
1. Vending machines on a college campus offer a variety of snacks. The purchasing
agent believes that each type of snack is equally preferred by students and consequently
orders equal quantities. The number of snacks sold from vending machines on this
campus for the last six months is shown in the following table.
a. State appropriate hypotheses to test whether the purchasing agent is correct.
b. What is the value of the test statistic and its associated P-value?
c. State the conclusion at α = 0.05.
14.3.3. Analyze conclusions using standardized residuals.
2. By examining residuals, determine which type of snack had the most impact on the
test results? What are the implications for the purchasing agent?
14.1.1. Find expected counts and compute test statistics.
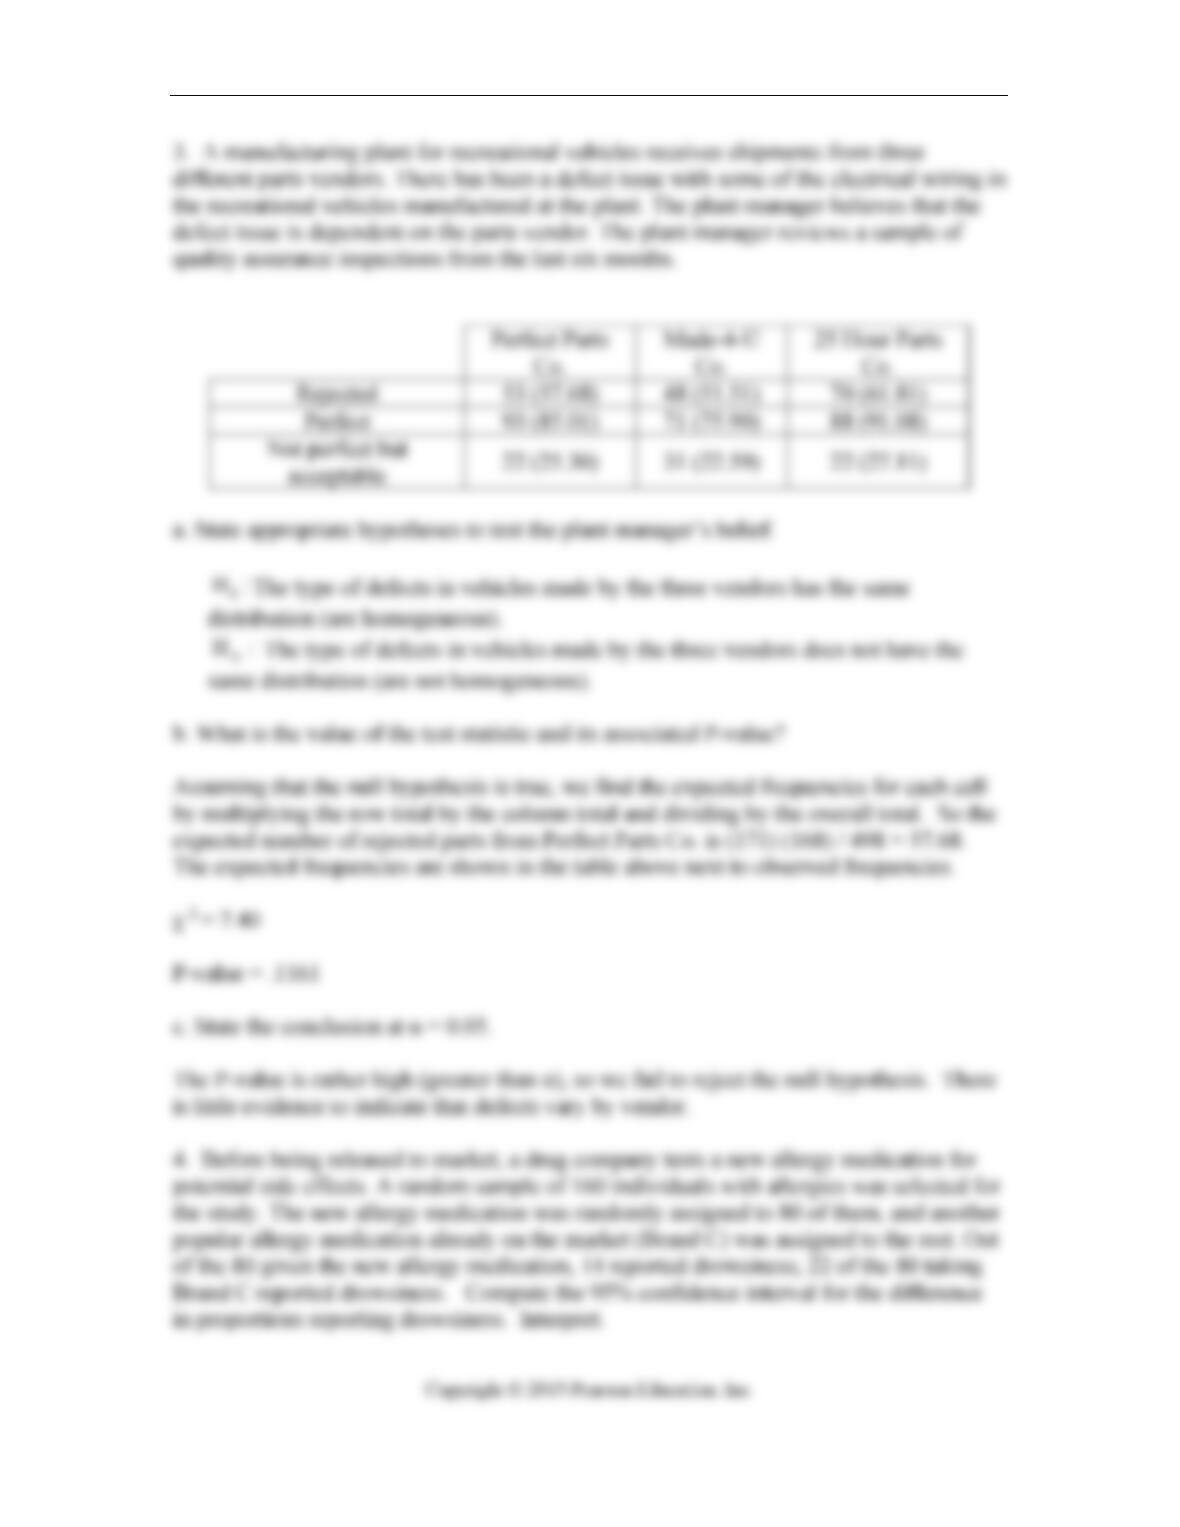
3. A manufacturing plant for recreational vehicles receives shipments from three
different parts vendors. There has been a defect issue with some of the electrical wiring in
the recreational vehicles manufactured at the plant. The plant manager believes that the
defect issue is dependent on the parts vendor. The plant manager reviews a sample of
quality assurance inspections from the last six months.
a. State appropriate hypotheses to test the plant manager’s belief.
b. What is the value of the test statistic and its associated P-value?
c. State the conclusion at α = 0.05.
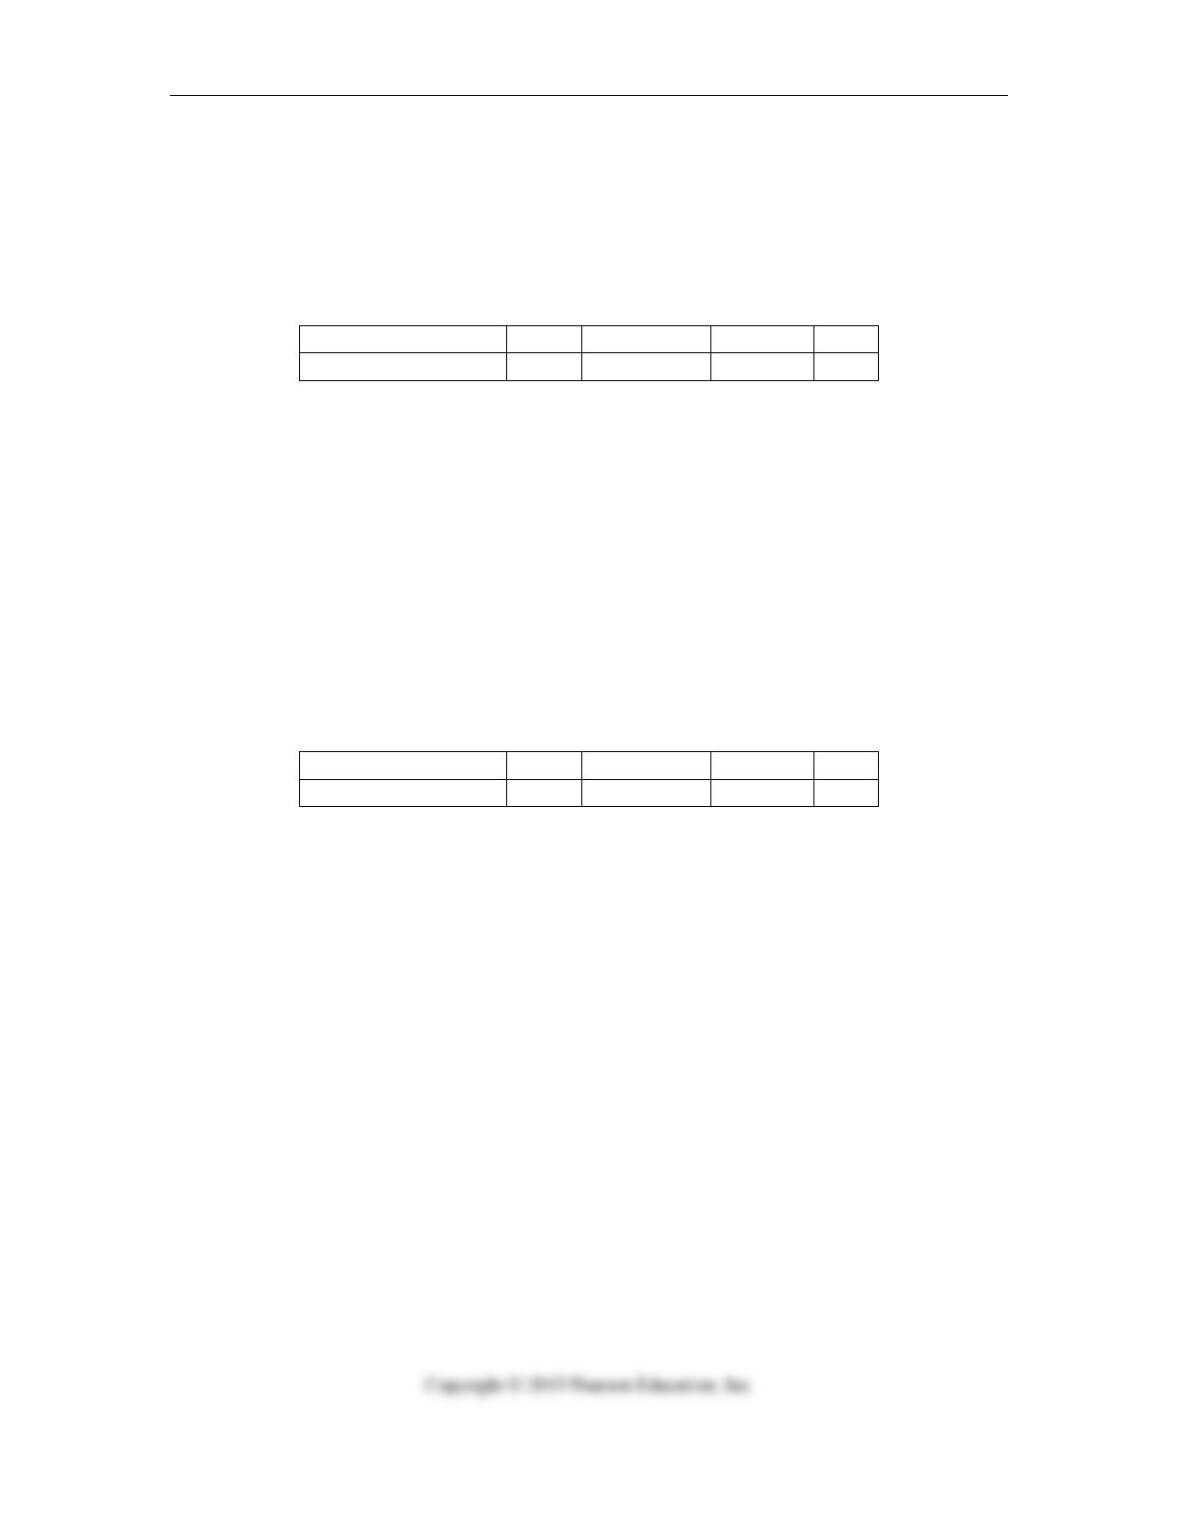
Snack Type Chips Candy Bars Crackers Nuts
Purchase Frequency 159 198 174 149
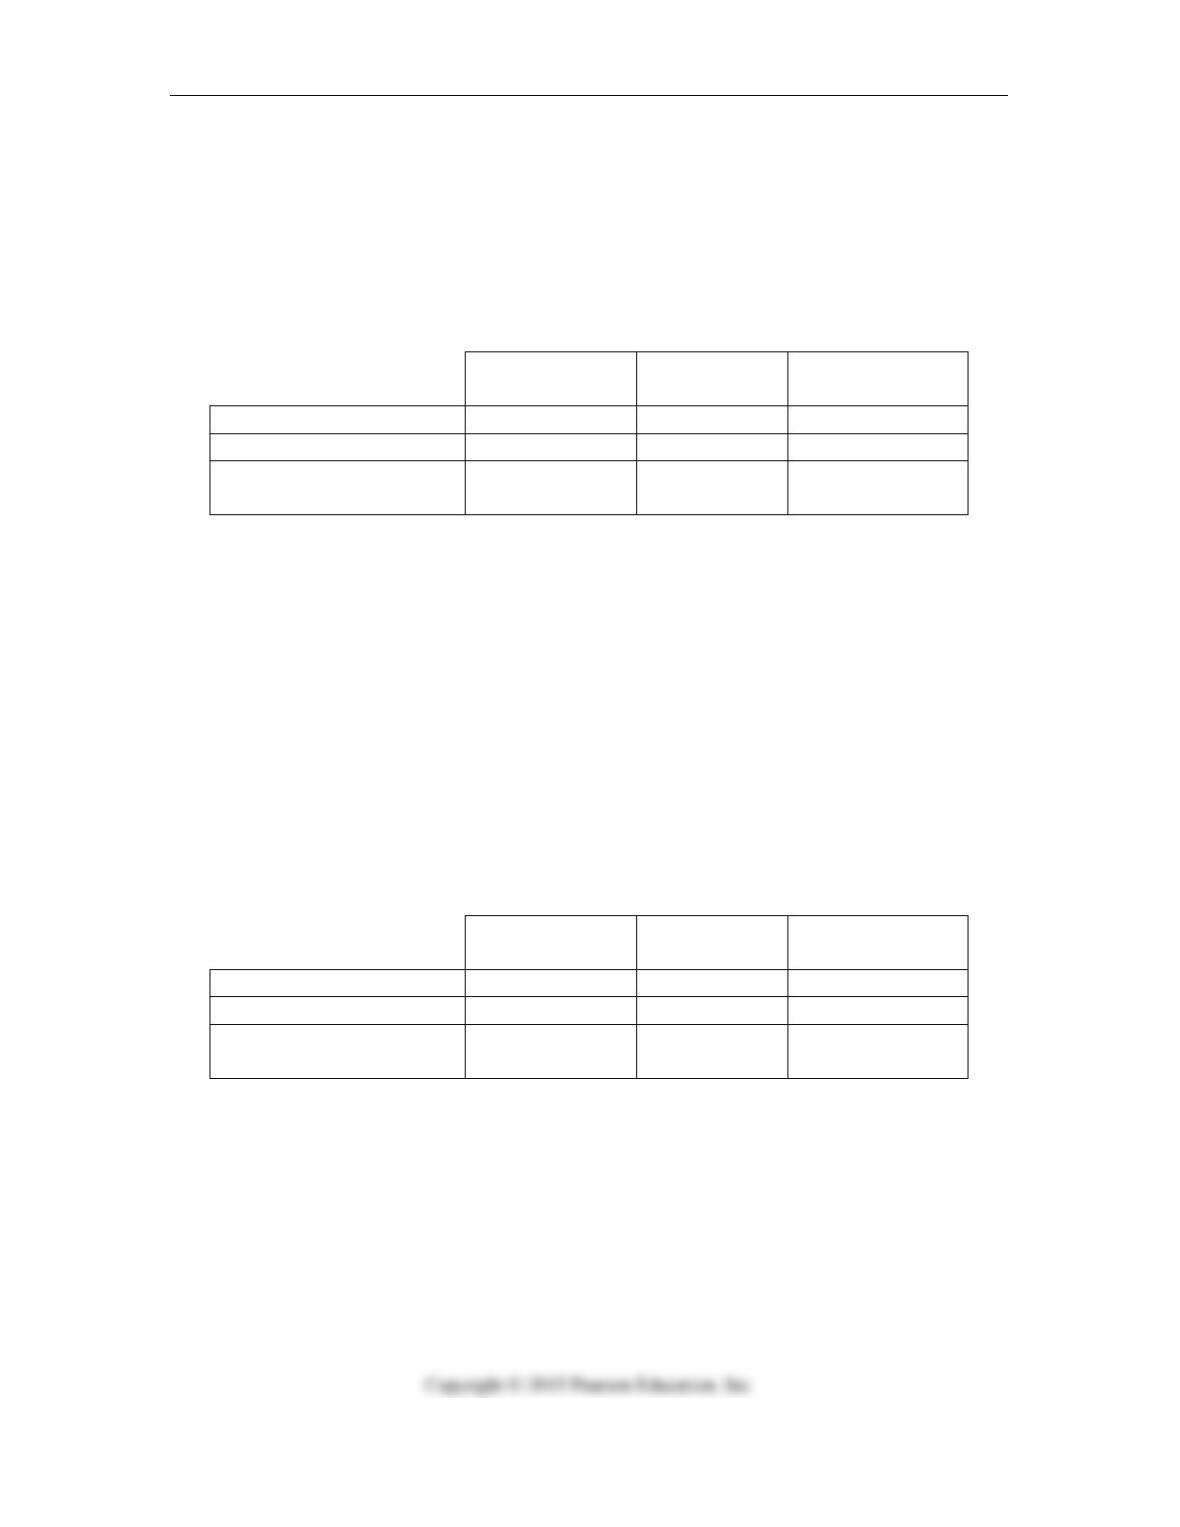
Perfect Parts
Co.
Made-4-U
Co.
25 Hour Parts
Co.
Rejected 53 48 70
Perfect 93 71 88
Not perfect but
acceptable 22 31 22

14-2 Chapter 14 Inference for Counts: Chi-Square Tests
14.5.4. Find and interpret confidence intervals for the difference of two proportions.
4. Before being released to market, a drug company tests a new allergy medication for
potential side effects. A random sample of 160 individuals with allergies was selected for
the study. The new allergy medication was randomly assigned to 80 of them, and another
popular allergy medication already on the market (Brand C) was assigned to the rest. Out
of the 80 given the new allergy medication, 14 reported drowsiness; 22 of the 80 taking
Brand C reported drowsiness. Compute the 95% confidence interval for the difference
in proportions reporting drowsiness. Interpret.
Quiz A 14-3
Chapter 14: Inference for Counts: Chi-Square Tests – Quiz A – Key
14-4 Chapter 14 Inference for Counts: Chi-Square Tests
Quiz A 14-5
14-6 Chapter 14 Inference for Counts: Chi-Square Tests
Chapter 14: Inference for Counts: Chi-Square Tests – Quiz B
Name ________________________________________
14.1.1. Find expected counts and compute test statistics.
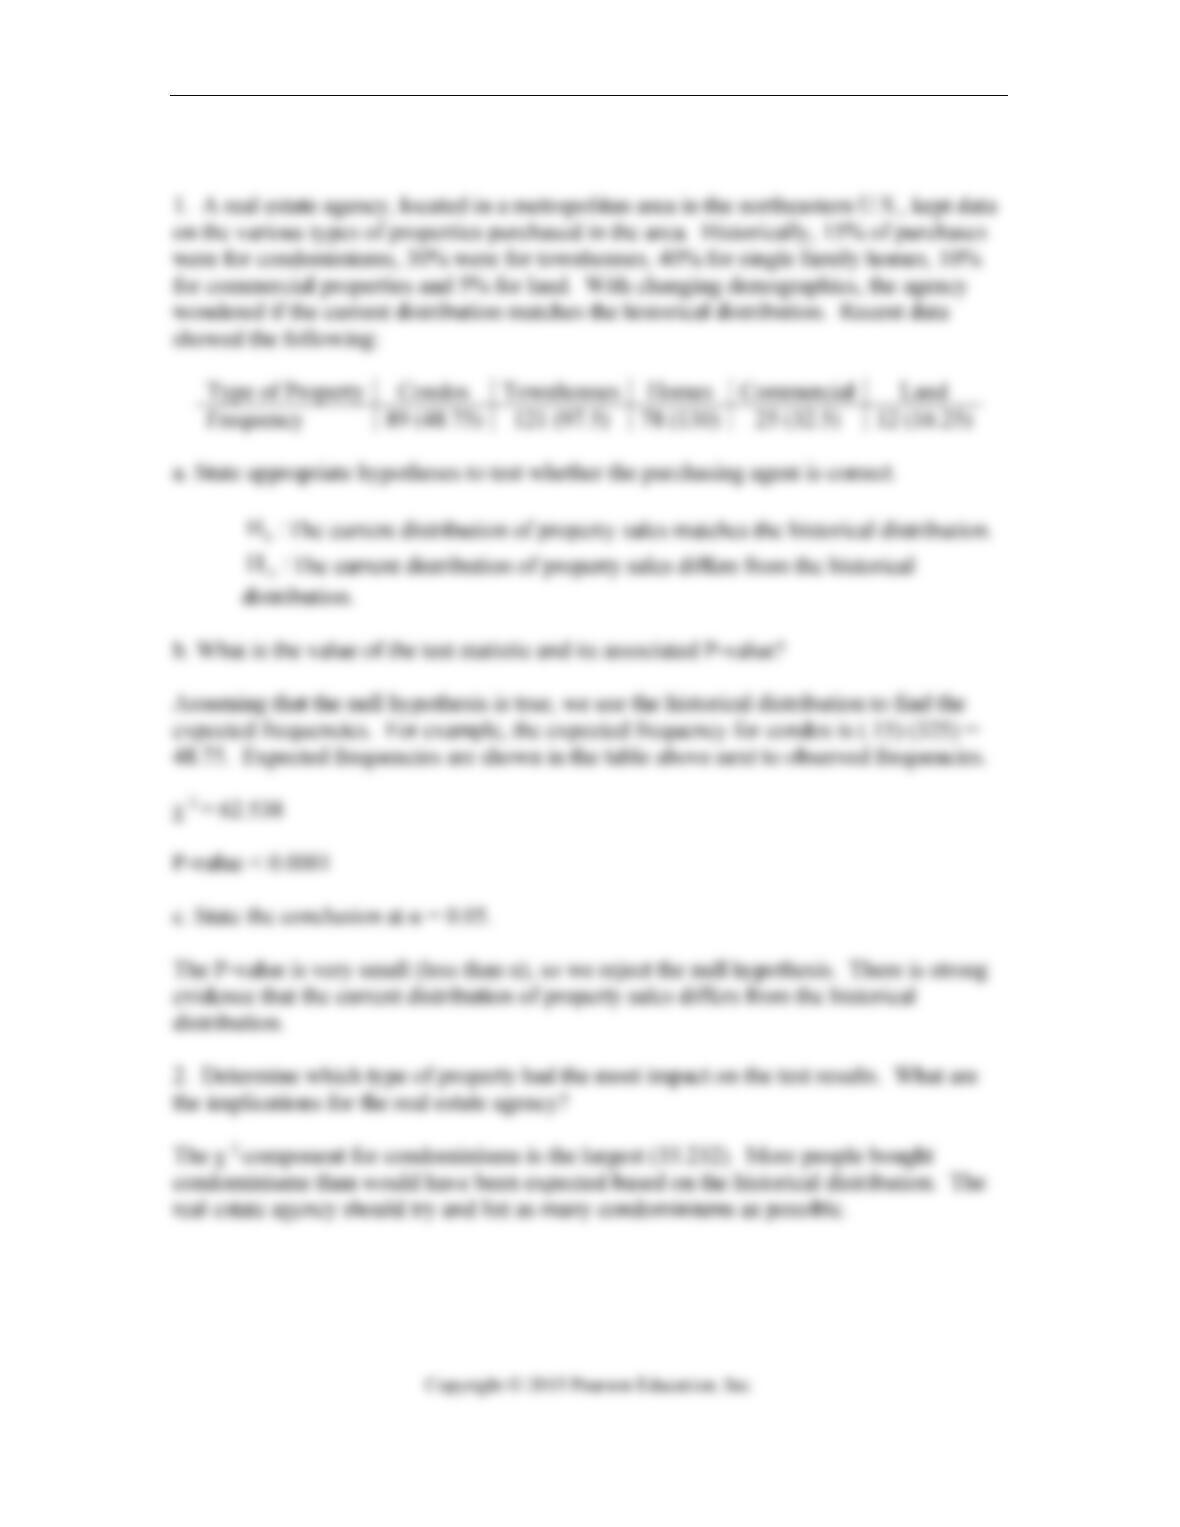
1. A real estate agency, located in a metropolitan area in the northeastern U.S., kept data
on the various types of properties purchased in the area. Historically, 15% of purchases
were for condominiums, 30% were for townhouses, 40% for single family homes, 10%
for commercial properties and 5% for land. With changing demographics, the agency
wondered if the current distribution matches the historical distribution. Recent data
showed the following:
Type of Property Condos Townhouses Homes Commercial Land
Frequency 89 121 78 25 12
a. State appropriate hypotheses to test whether the purchasing agent is correct.
b. What is the value of the test statistic and its associated P-value?
c. State the conclusion at α = .05.
14.1.1. Find expected counts and compute test statistics.
2. By examining residuals, determine which type of property had the most impact on the
test results? What are the implications for the real estate agency?
14.1.1. Find expected counts and compute test statistics.
3. An online book store wants to determine if coupon redemption is independent of
gender. After a special coupon broadcast to its reward members, the following data on
coupon redemption at check out were collected.
Coupon Redeemed?
Yes No Total
Sex Male 66 66 132
Female 125 74 199
Total 191 140 331
a. State appropriate hypotheses to determine whether coupon redemption is independent
of gender.
b. What is the value of the test statistic and its associated P-value?
c. State the conclusion at α = 0.05.
14.1.4. Find and interpret confidence intervals for the difference of two proportions.
4. Previous surveys reported that more men than women trade stocks online. A local
brokerage firm randomly selected a sample of investors. They found that 45 out of 234
men traded online and 42 out of 251 women traded online. Find the 95% confidence
interval for the difference in proportions. Interpret.
Quiz B 14-7
Chapter 14: Inference for Counts: Chi-Square Tests – Quiz B – Key
14-8 Chapter 14 Inference for Counts: Chi-Square Tests
Quiz C 14-9
Chapter 14: Inference for Counts: Chi-Square Tests – Quiz C – Multiple Choice
Name ________________________________________
14.1.5. Choose the best type of test.
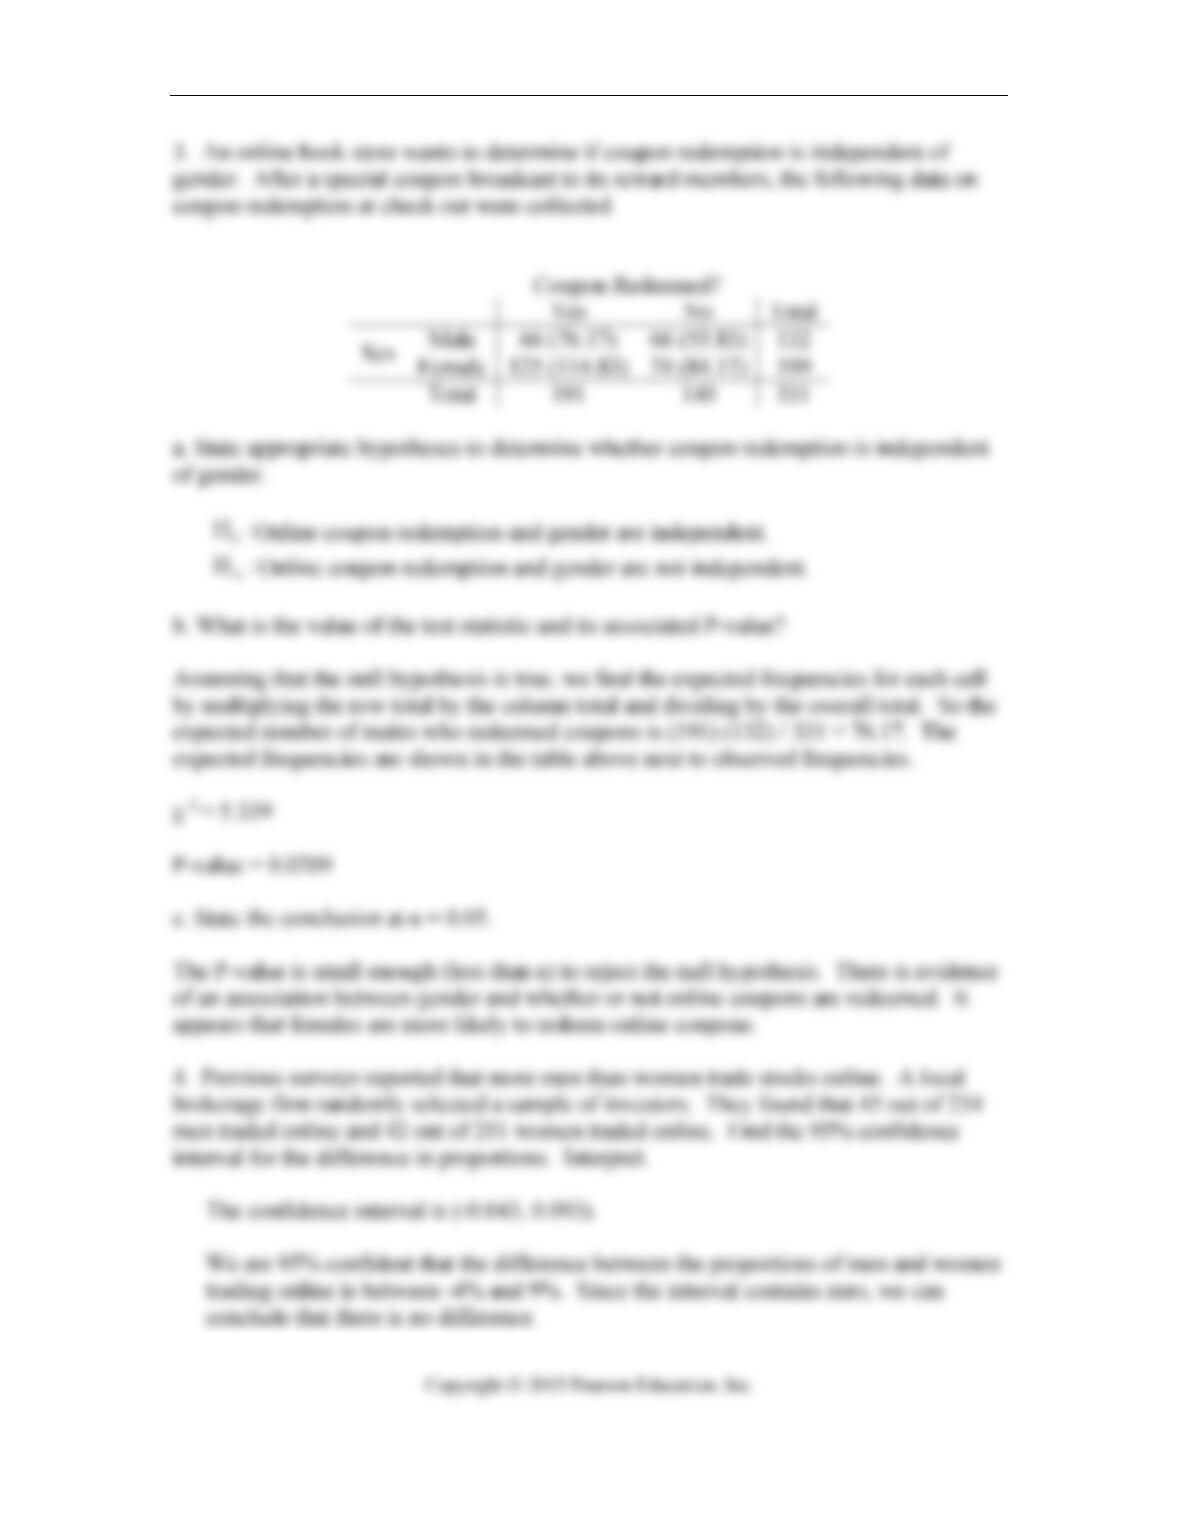
1. Vending machines on a college campus offer a variety of snacks. The purchasing
agent believes that each type of snack is equally preferred by students and consequently
orders equal quantities. The number of snacks sold from vending machines on this
campus for the last six months is shown in the following table. The appropriate test to
see if the purchasing agent is correct is the
A. Chi-square test of independence.
B. Z-test for two proportions.
C. Chi-square goodness-of-fit test.
D. Chi-square test of homogeneity.
E. Normality test.
14.1.2. Perform tests for goodness‐of‐fit, homogeneity, or independence.
2. Vending machines on a college campus offer a variety of snacks. The purchasing
agent believes that each type of snack is equally preferred by students and consequently
orders equal quantities. The null hypothesis to test his belief can be worded as
A. The types of snacks are not uniformly distributed among the students buying snacks.
B. The types of snacks are uniformly distributed among the students buying snacks.
C. The types of snacks are independent from each other.
D. The distribution of type of snack purchases follows the normal distribution.
E. None of the above.
14.1.1. Find expected counts and compute test statistics.
3. Vending machines on a college campus offer a variety of snacks. The purchasing
agent believes that each type of snack is equally preferred by students and consequently
orders equal quantities. The number of snacks sold from vending machines on this
campus for the last six months is shown in the following table. If the purchasing agent is
correct, how many candy bars would we expect to have been sold?
A. 170
B. 198
C. 125
D. 180
E. 680
Snack Type Chips Candy Bars Crackers Nuts
Purchase Frequency 159 198 174 149
Snack Type Chips Candy Bars Crackers Nuts
Purchase Frequency 159 198 174 149
14-10 Chapter 14 Inference for Counts: Chi-Square Tests
14.2.2. Perform tests for goodness‐of‐fit, homogeneity, or independence.
4. Vending machines on a college campus offer a variety of snacks. The purchasing
agent believes that each type of snack is equally preferred by students and consequently
orders equal quantities. The number of snacks sold from vending machines on this
campus for the last six months is shown in the following table. The correct value of the
test statistic for determining if the purchasing agent’s belief if supported is
A. χ 2 = 8.012
B. χ 2 = 12.019
C. χ 2 = 0.984
D. χ 2 = 45.014
E. None of the above.
14.2.2. Perform tests for goodness‐of‐fit, homogeneity, or independence.
5. Vending machines on a college campus offer a variety of drinks. The purchasing agent
believes that each type of snack is equally preferred by students and consequently orders
equal quantities. The number of snacks sold from vending machines on this campus for
the last six months is shown in the following table. The P-value of the calculated Chi-
square statistic is 0.0458. At α = 0.05, we should
A. reject the null hypothesis.
B. not reject the null hypothesis.
C. conclude that the purchasing agent was not correct.
D. Both A and C.
E. Both B and C.
Snack Type Chips Candy Bars Crackers Nuts
Purchase Frequency 159 198 174 149
Snack Type Chips Candy Bars Crackers Nuts
Purchase Frequency 159 198 174 149
Quiz C 14-11
14.6.5. Choose the best type of test.
6. A manufacturing plant for recreational vehicles receives shipments from three different
parts vendors. There has been a defect issue with some of the electrical wiring in the
recreational vehicles manufactured at the plant. The plant manager believes that the
defect issue is dependent on the parts vendor. The plant manager reviews a sample of
quality assurance inspections from the last six months. Which Chi-square test is most
appropriate for this situation?
A. Goodness of Fit
B. Homogeneity
C. Dependence
D. Proportional
E. None of the above.
14.4.1. Find expected counts and compute test statistics.
7. A manufacturing plant for recreational vehicles receives shipments from three different
parts vendors. There has been a defect issue with some of the electrical wiring in the
recreational vehicles manufactured at the plant. The plant manager believes that the
defect issue is dependent on the parts vendor. The plant manager reviews a sample of
quality assurance inspections from the last six months. The expected number of rejected
parts from Perfect Parts Co. is
A. 53
B. 51.51
C. 57.68
D. 61.81
E. 171
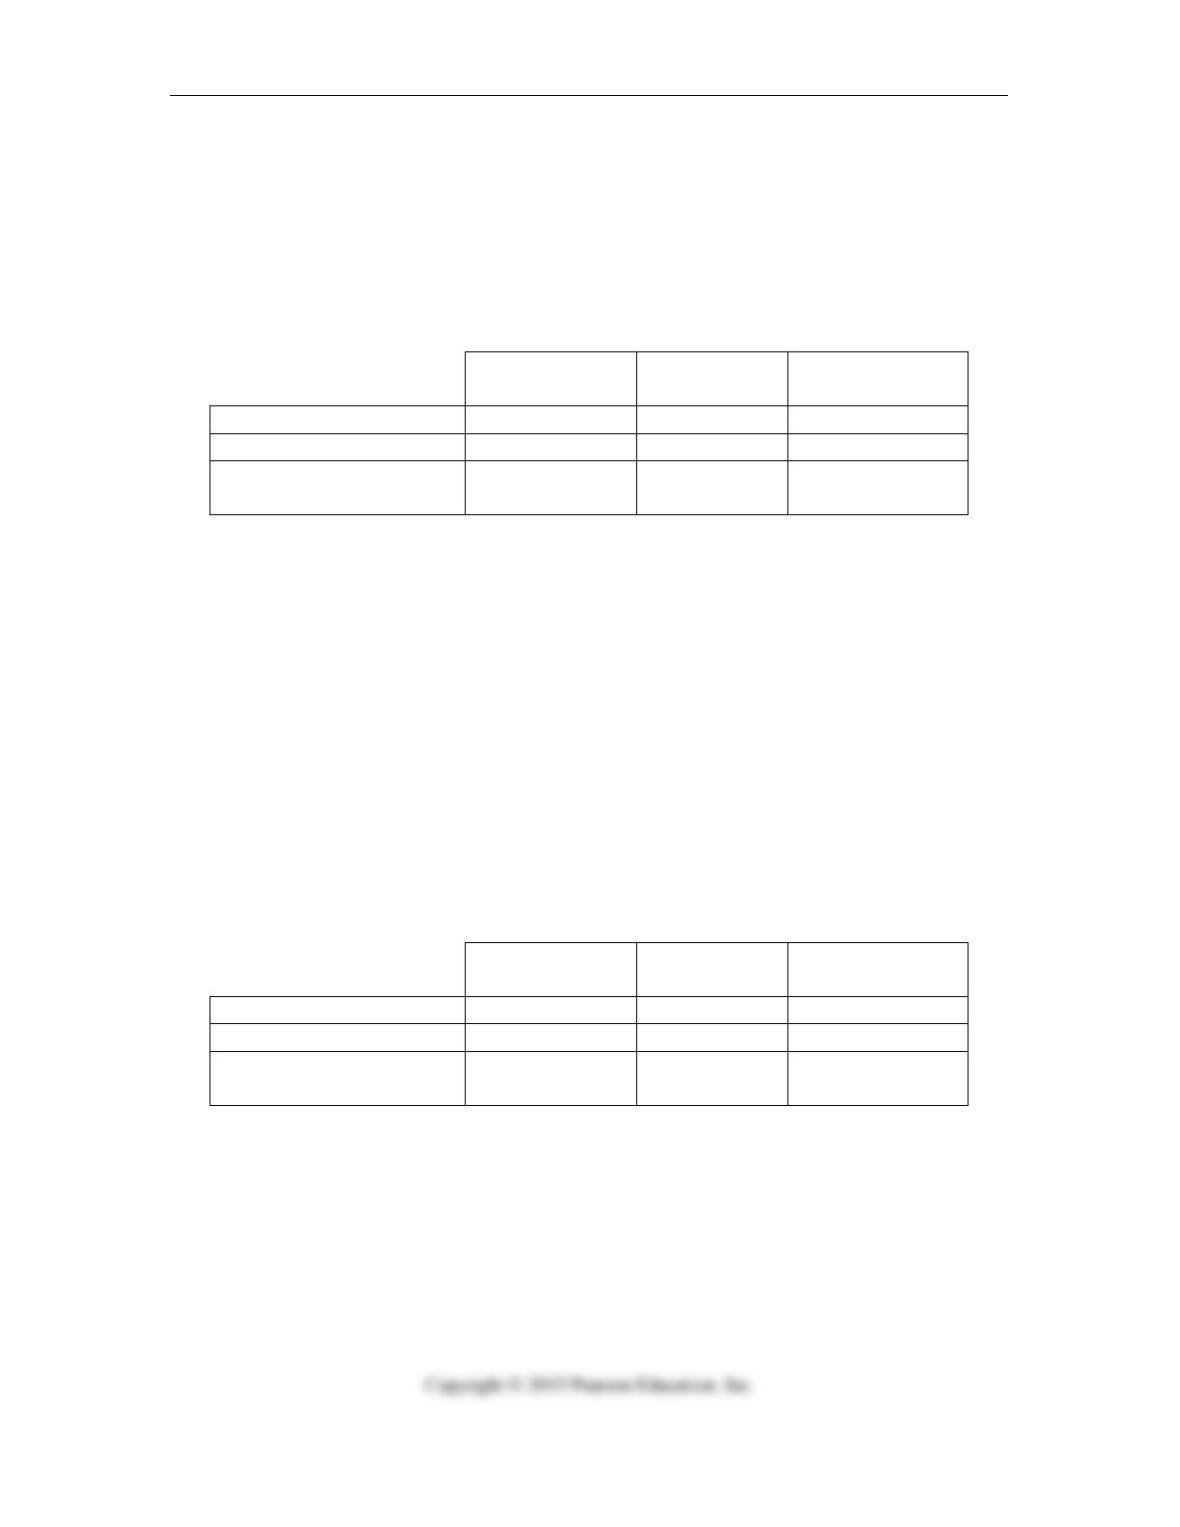
Perfect Parts
Co.
Made-4-U
Co.
25 Hour Parts
Co.
Rejected 53 48 70
Perfect 93 71 88
Not perfect but
acceptable 22 31 22
Perfect Parts
Co.
Made-4-U
Co.
25 Hour Parts
Co.
Rejected 53 48 70
Perfect 93 71 88
Not perfect but
acceptable 22 31 22
14-12 Chapter 14 Inference for Counts: Chi-Square Tests
14.4.1. Find expected counts and compute test statistics.
8. A manufacturing plant for recreational vehicles receives shipments from three different
parts vendors. There has been a defect issue with some of the electrical wiring in the
recreational vehicles manufactured at the plant. The plant manager believes that the
defect issue is dependent on the parts vendor. The plant manager reviews a sample of
quality assurance inspections from the last six months. The expected number of perfect
parts from Made-4-U Co. is
A. 75.9
B. 91.08
C. 71
D. 61.81
E. 252
14.4.2. Perform tests for goodness‐of‐fit, homogeneity, or independence.
9. A manufacturing plant for recreational vehicles receives shipments from three different
parts vendors. There has been a defect issue with some of the electrical wiring in the
recreational vehicles manufactured at the plant. The plant manager believes that the
defect issue is dependent on the parts vendor. The plant manager reviews a sample of
quality assurance inspections from the last six months. The correct value of the test
statistic for determining if the plant manager’s belief is supported is
A. χ 2 = 8.10
B. χ 2 = 6.52
C. χ 2 = 5.03
D. χ 2 = 7.40
E. χ 2 = 9.89
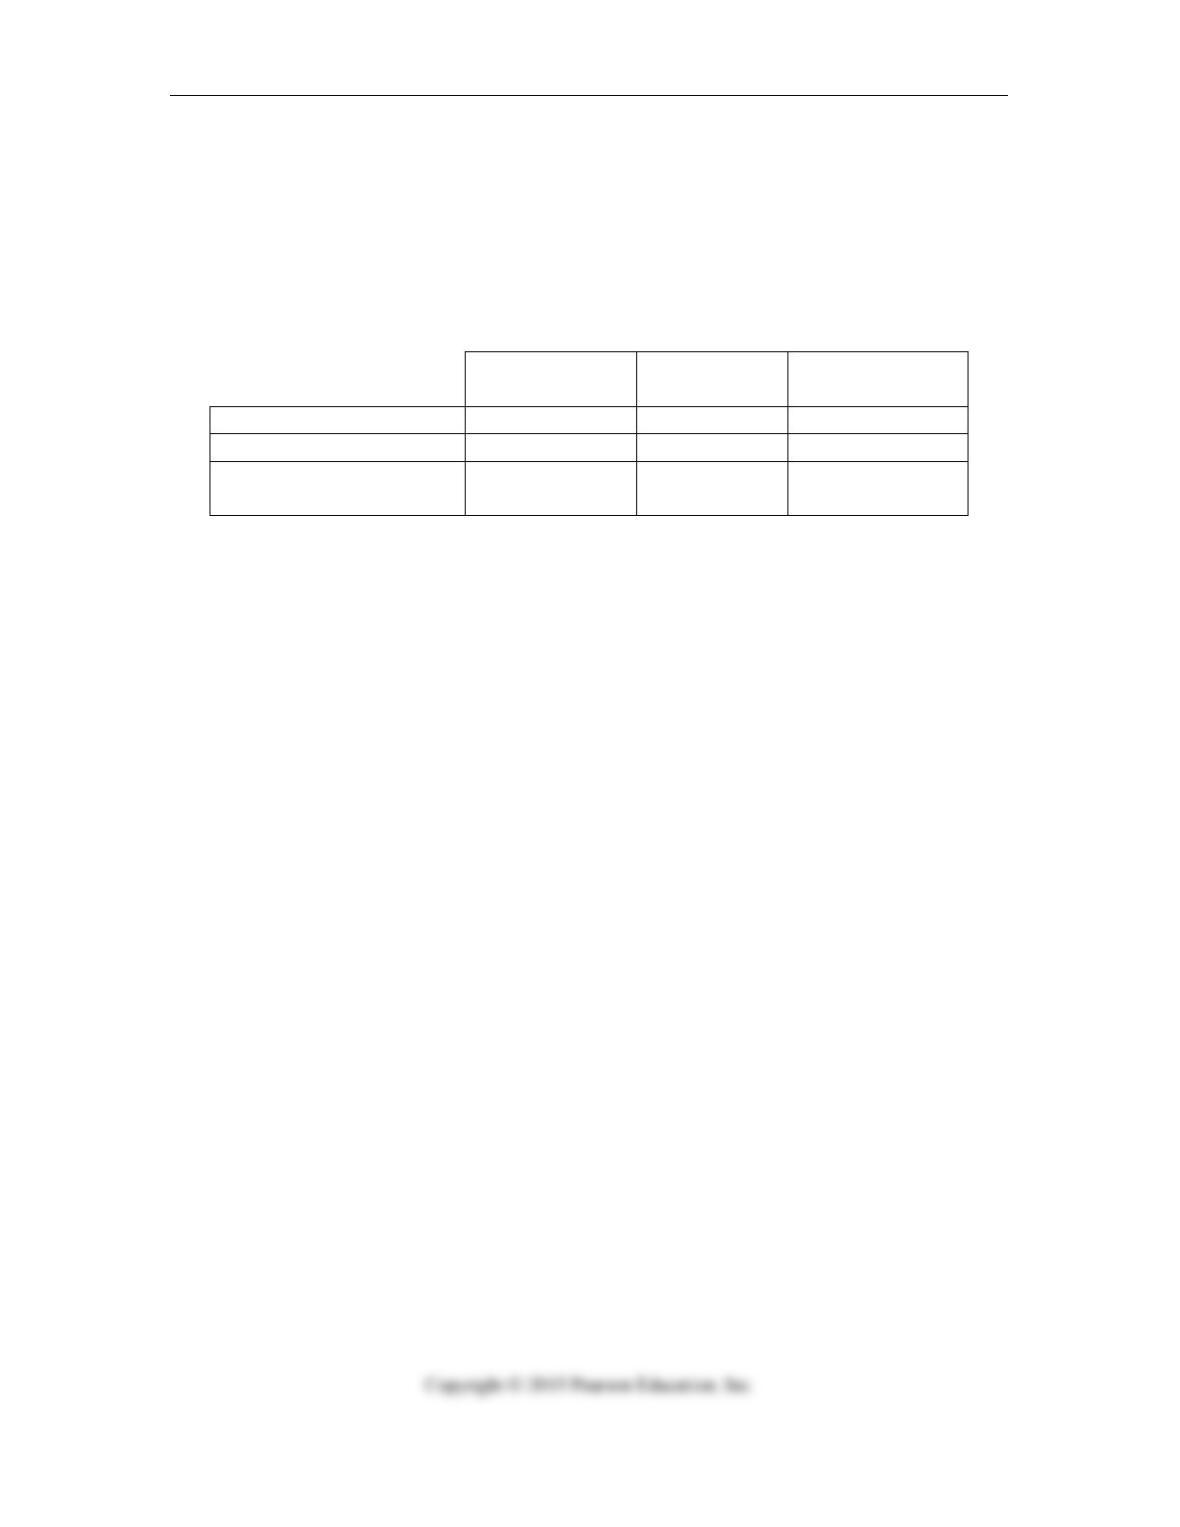
Perfect Parts
Co.
Made-4-U
Co.
25 Hour Parts
Co.
Rejected 53 48 70
Perfect 93 71 88
Not perfect but
acceptable 22 31 22
Perfect Parts
Co.
Made-4-U
Co.
25 Hour Parts
Co.
Rejected 53 48 70
Perfect 93 71 88
Not perfect but
acceptable 22 31 22
Quiz C 14-13
14.4.2. Perform tests for goodness‐of‐fit, homogeneity, or independence.
10. A manufacturing plant for recreational vehicles receives shipments from three
different parts vendors. There has been a defect issue with some of the electrical wiring in
the recreational vehicles manufactured at the plant. The plant manager believes that the
defect issue is dependent on the parts vendor. The plant manager reviews a sample of
quality assurance inspections from the last six months. The P-value of the calculated Chi-
square statistic is 0.1161. At α = 0.05, we should
A. reject the null hypothesis.
B. not reject the null hypothesis.
C. conclude that the defects do not vary by vendor.
D. both A and C.
E. both B and C.
Perfect Parts
Co.
Made-4-U
Co.
25 Hour Parts
Co.
Rejected 53 48 70
Perfect 93 71 88
Not perfect but
acceptable 22 31 22

14-14 Chapter 14 Inference for Counts: Chi-Square Tests
Chapter 14: Inference for Counts: Chi-Square Tests – Quiz C – Key

Quiz D 14-15
Chapter 14: Inference for Counts: Chi-Square Tests – Quiz D – Multiple Choice
Name ________________________________________
14.6.5. Choose the best type of test.
1. An online department store wants to determine if there is an association between
coupon redemption and gender. After a special coupon broadcast to its reward members,
the following data on coupon redemption at check out were collected. Which Chi-square
test is most appropriate for this situation?
Coupon Redeemed?
Yes No Total
Sex Male 66 66 132
Female 125 74 199
Total 191 140 331
A. Goodness of Fit
B. Homogeneity
C. Independence
D. Proportional
E. None of the above.
14.4.2. Perform tests for goodness‐of‐fit, homogeneity, or independence.
2. An online department store wants to determine if there is an association between
coupon redemption and gender. After a special coupon broadcast to its reward members,
the following data on coupon redemption at check out were collected. The correct value
of the test statistic is
Coupon Redeemed?
Yes No Total
Sex Male 66 66 132
Female 125 74 199
Total 191 140 331
A. χ 2 = 5.339
B. χ 2 = 8.429
C. χ 2 = 0.839
D. χ 2 = 45.556
E. None of the above.
14-16 Chapter 14 Inference for Counts: Chi-Square Tests
14.4.2. Perform tests for goodness‐of‐fit, homogeneity, or independence.
3. An online department store wants to determine if there is an association between
coupon redemption and gender. After a special coupon broadcast to its reward members,
the following data on coupon redemption at check out were collected. The P-value
associated with the calculated Chi-square statistic is 0.0209. At α = 0.05 the correct
conclusion is
Coupon Redeemed?
Yes No Total
Sex Male 66 66 132
Female 125 74 199
Total 191 140 331
A. to reject the null hypothesis.
B. to accept the null hypothesis.
C. to conclude that there is an association between coupon redemption and gender.
D. Both A and C.
E. Both B and C.
14.5.4. Find and interpret confidence intervals for the difference of two proportions.
4. Previous surveys reported that more men than women trade stocks online. A local
brokerage firm randomly selected a sample of investors. They found that 45 out of 234
men traded online and 42 out of 251 women traded online. The 95% confidence interval
for the difference in proportions is
A. 4% to 9%
B. -4% to 9%
C. 2% to 12%
D. -2% to 12%
E. -2% to -4%
Quiz D 14-17
14.5.4. Find and interpret confidence intervals for the difference of two proportions.
5. Before being released to market, a drug company tests a new allergy medication for
potential side effects. A random sample of 160 individuals with allergies was selected for
the study. The new allergy medication was randomly assigned to 80 of them, and another
popular allergy medication already on the market (Brand C) was assigned to the rest. Out
of the 80 given the new allergy medication, 14 reported drowsiness; 22 of the 80 taking
Brand C reported drowsiness. The 95% confidence interval for the difference in
proportions reporting drowsiness is -0.028 to 0.228. Which of the following is correct?
A. We are 95% confident that there is no difference between the proportions of patients
reporting drowsiness for the two allergy medications.
B. We are 95% confident that there is a difference between the proportions of patients
reporting drowsiness for the two allergy medications.
C. We are 95% confident that the proportion of patients reporting drowsiness is higher
for the new allergy medication.
D. We are 95% confident that the proportion of patients reporting drowsiness is lower
for the new allergy medication.
E. There will be a significant difference between the proportions 95% of the time.
14.6.5. Choose the best type of test.
6. A real estate agency, located in a metropolitan area in the northeastern U.S., kept data
on the various types of properties purchased in the area. Historically, 15% of purchases
were for condominiums, 30% were for townhouses, 40% for single family homes, 10%
for commercial properties and 5% for land. With changing demographics, the agency
wondered if the current distribution matches the historical distribution. Recent data
showed the following:
Type of Property Condos Townhouses Homes Commercial Land
Frequency 89 121 78 25 12
Which Chi-square test is most appropriate for this situation?
A. Goodness of Fit
B. Homogeneity
C. Independence
D. Proportional
E. None of the above.
14-18 Chapter 14 Inference for Counts: Chi-Square Tests
14.4.1. Find expected counts and compute test statistics.
7. A real estate agency, located in a metropolitan area in the northeastern U.S., kept data
on the various types of properties purchased in the area. Historically, 15% of purchases
were for condominiums, 30% were for townhouses, 40% for single family homes, 10%
for commercial properties and 5% for land. With changing demographics, the agency
wondered if the current distribution matches the historical distribution. Recent data
showed the following:
Type of Property Condos Townhouses Homes Commercial Land
Frequency 89 121 78 25 12
Based on the historical distribution, we would expect how many homes to be purchased?
A. 121
B. 122.54
C. 130
D. 129.95
E. 100
14.1.5. Choose the best type of test.
8. A real estate agency, located in a metropolitan area in the northeastern U.S., kept data
on the various types of properties purchased in the area. Historically, 15% of purchases
were for condominiums, 30% were for townhouses, 40% for single family homes, 10%
for commercial properties and 5% for land. With changing demographics, the agency
wondered if the current distribution matches the historical distribution. Recent data
showed the following:
Type of Property Condos Townhouses Homes Commercial Land
Frequency 89 121 78 25 12
The value of the Chi-square test statistic is
A. χ 2 = 5.993
B. χ 2 = 62.538
C. χ 2 = 101.482
D. χ 2 = 77.431
E. χ 2 = 8.101
Quiz D 14-19
14.3.3. Analyze conclusions using standardized residuals.
9. A real estate agency, located in a metropolitan area in the northeastern U.S., kept data
on the various types of properties purchased in the area. Historically, 15% of purchases
were for condominiums, 30% were for townhouses, 40% for single family homes, 10%
for commercial properties and 5% for land. With changing demographics, the agency
wondered if the current distribution matches the historical distribution. Recent data
showed the following:
Type of Property Condos Townhouses Homes Commercial Land
Frequency 89 121 78 25 12
What is the standardized residual associated with Townhouses?
A. 23.5
B. 4.85
C. 10.86
D. 2.38
E. Not enough information given to calculate.
14.3.3. Analyze conclusions using standardized residuals.
10. A real estate agency, located in a metropolitan area in the northeastern U.S., kept data
on the various types of properties purchased in the area. Historically, 15% of purchases
were for condominiums, 30% were for townhouses, 40% for single family homes, 10%
for commercial properties and 5% for land. Based on the data shown below, the null
hypothesis was rejected and the agency concluded that the current distribution of property
sales differs from the historical distribution. Based on an examination of the standardized
residuals, which type of property had the most impact on the test results?
Type of Property Condos Townhouses Homes Commercial Land
Frequency 89 121 78 25 12
A. Condos
B. Townhouses
C. Homes
D. Commercial
E. Land
14-20 Chapter 14 Inference for Counts: Chi-Square Tests
Chapter 14: Inference for Counts: Chi-Square Tests – Quiz D – Key