Chapter 14: Quality and Environmental Cost Management
101. The following information pertains to Molotov, Inc., for 2016:
Sales
$20,000,000
Internal failure costs
600,000
External failure costs
400,000
Appraisal costs
250,000
Prevention costs
100,000
Cost of goods sold
10,000,000
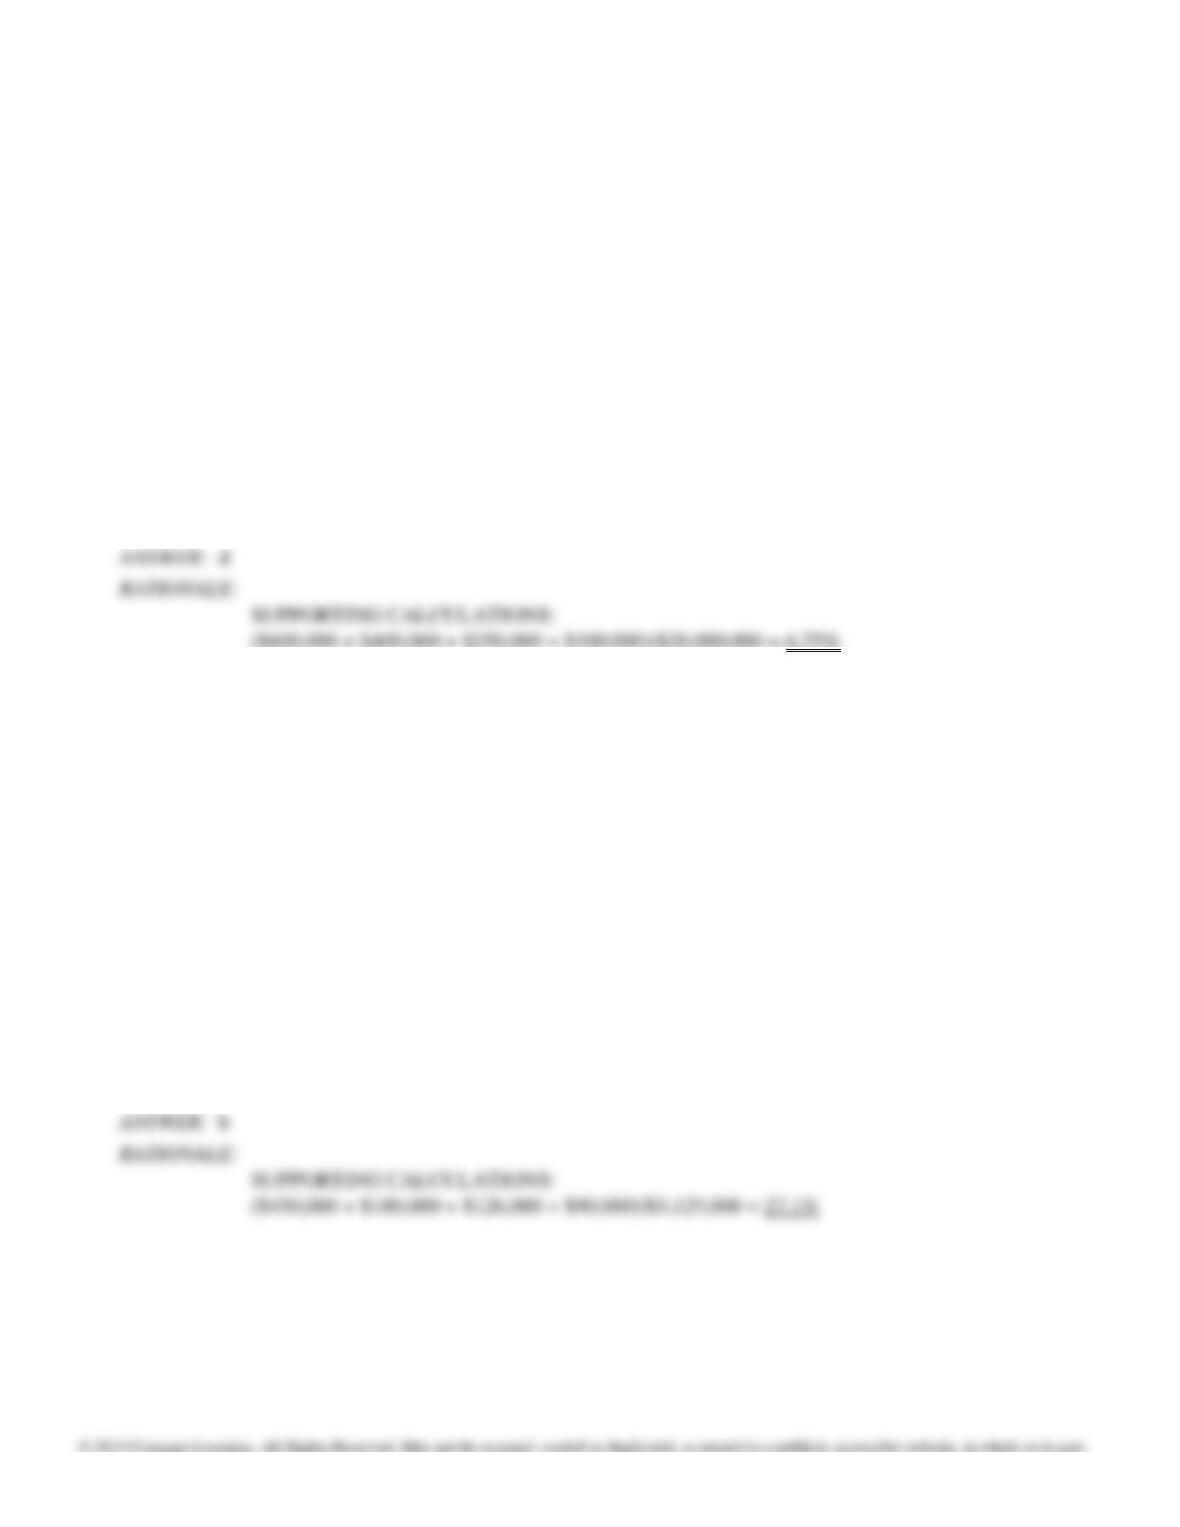
Quality costs are what percentage of sales?
a. 3.00%
b. 5.00%
c. 6.25%
d. 6.75%
102. The following information pertains to James Adams Corp. for 2016:
Sales
$3,125,000
Internal failure costs
450,000
External failure costs
180,000
Appraisal costs
126,000
Prevention costs
90,000
Cost of goods sold
1,350,000
Quality costs are what percentage of sales?
a. 16.0%
b. 27.1%
c. 7.0%
d. 3.0%
Chapter 14: Quality and Environmental Cost Management
Figure 14-5
At the beginning of the year, Mike Gioulis initiated a quality improvement program. The program was successful
in reducing scrap and rework costs. To help assess the impact of the quality improvement program, the following
data were collected for the current and preceding years:
Preceding Year
Current Year
Sales
$2,400,000
$2,000,000
Scrap
40,000
30,000
Rework
100,000
70,000
Product inspection
12,000
18,000
Quality training
4,000
5,000
Material inspections
8,000
13,000
Product warranty
80,000
50,000
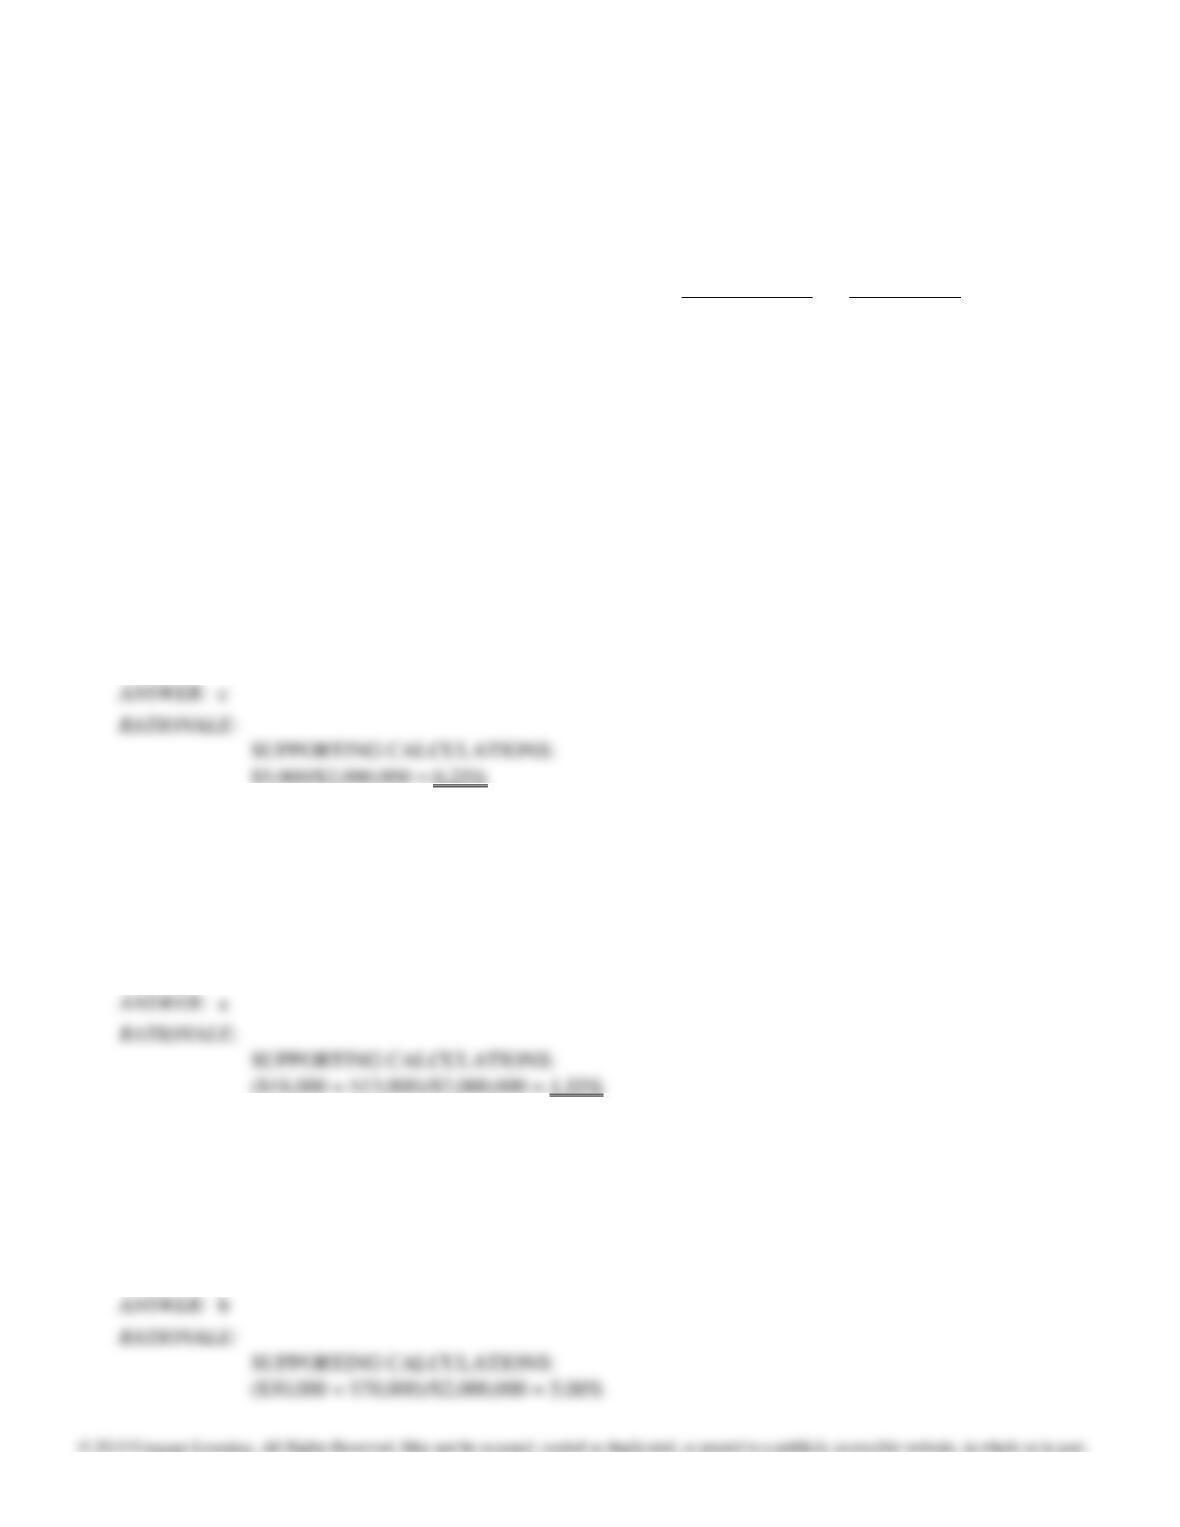
103. Refer to Figure 14-5. For the current year, prevention costs are what percentage of sales?
a. 2.50%
b. 9.30%
c. 0.25%
d. 1.80%
104. Refer to Figure 14-5. For the current year, appraisal costs are what percentage of sales?
a. 1.55%
b. 1.80%
c. 0.25%
d. 9.30%
105. Refer to Figure 14-5. For the current year, internal failure costs are what percentage of sales?
a. 9.30%
b. 5.00%
c. 2.50%
d. 7.50%
Chapter 14: Quality and Environmental Cost Management
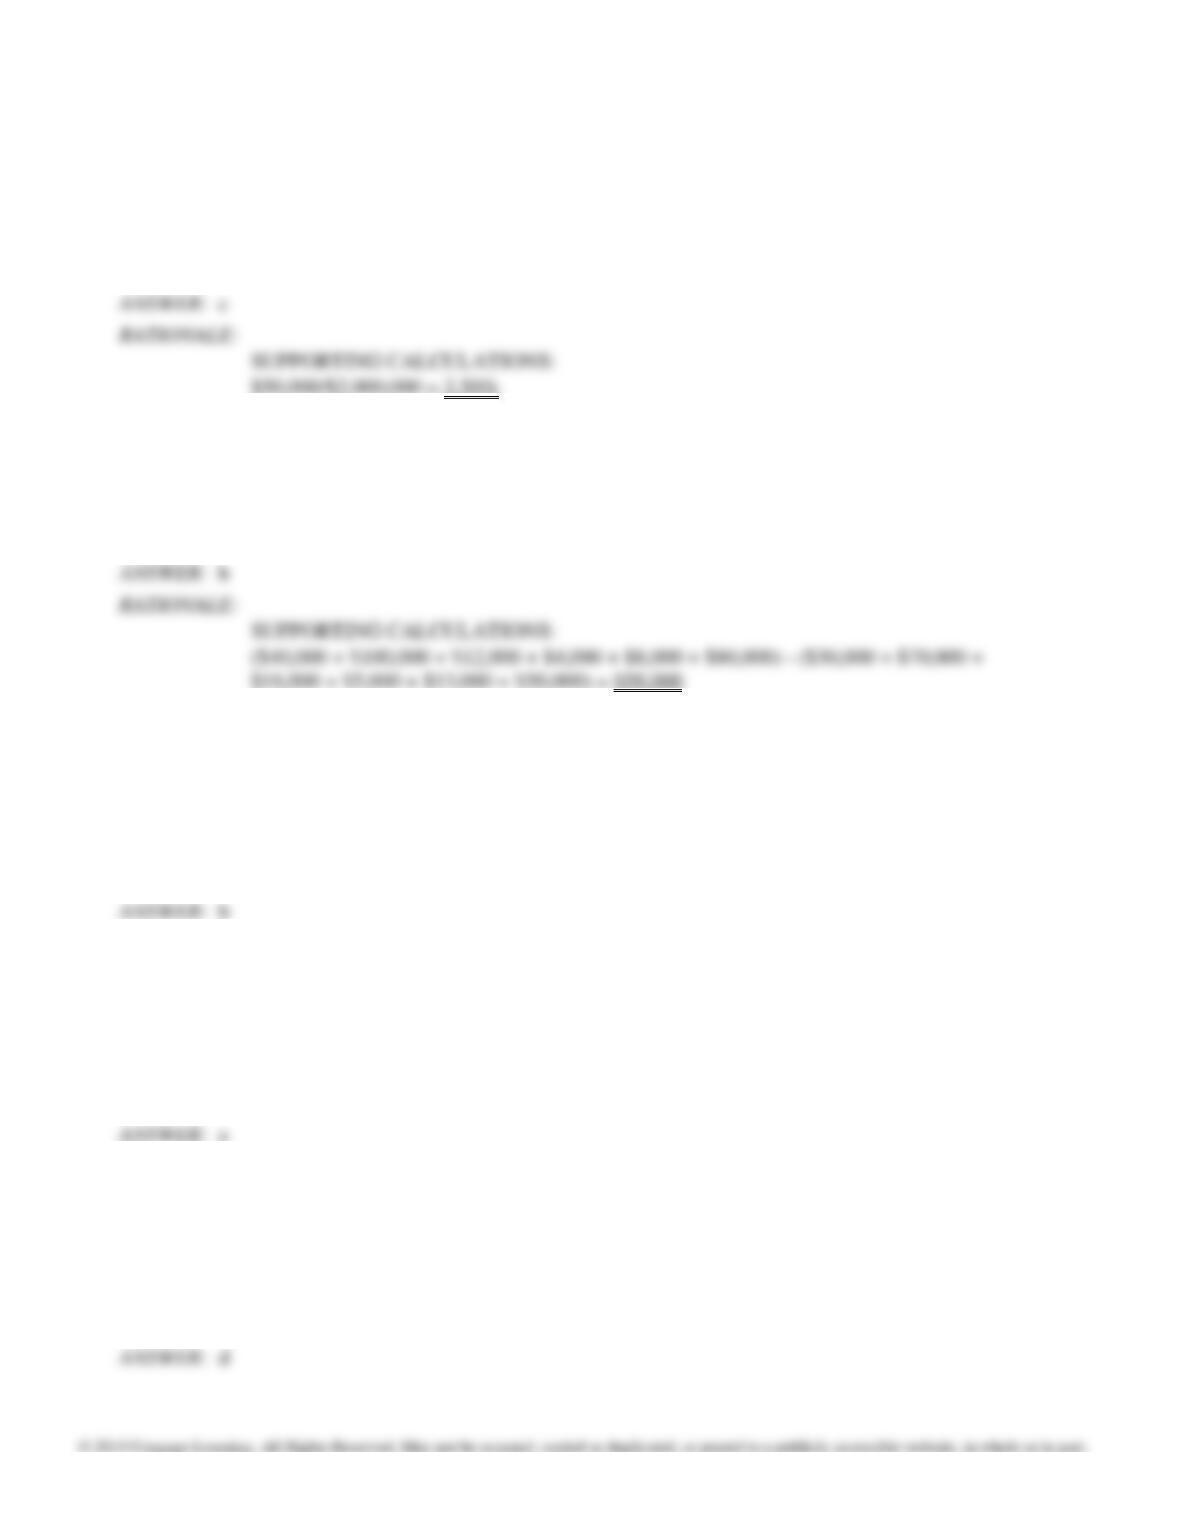
106. Refer to Figure 14-5. For the current year, external failure costs are what percentage of sales?
a. 9.30%
b. 5.00%
c. 2.50%
d. 7.50%
107. Refer to Figure 14-5. As a result of quality improvements, profits have increased by
a. $400,000.
b. $58,000.
c. $186,000.
d. $244,000.
108. The robust quality model
a. maintains an acceptable quality level.
b. decreases total quality costs by decreasing the number of defective units.
c. balances control costs with failure costs.
d. relies on warranty work.
109. As preventive and appraisal costs increase, internal and external failure costs are expected to
a. decrease.
b. increase.
c. remain the same.
d. vary with no relation to preventive and appraisal costs.
110. In activity-based management, which quality cost would NOT be considered value-added?
a. recruiting
b. quality circles
c. supplier certification
d. inspection of materials

Chapter 14: Quality and Environmental Cost Management
111. In activity-based management, which quality cost would NOT be considered value-added?
a. internal failure
b. appraisal
c. external failure
d. none of the above
112. According to the robust view, the strategy for reducing quality costs is NOT based on which assumption?
a. For every failure there is a root cause.
b. Causes are preventable.
c. Prevention costs must be balanced with the benefits.
d. Continually redirecting prevention efforts will lead to further improvements.
113. In activity-based management, which quality cost would be considered value-added?
a. warranties
b. rework
c. supplier certification
d. inspection of materials
114. According to the robust quality view,
a. control costs increase without limits.
b. control costs increase as the robust state approaches.
c. failure costs can be driven to zero.
d. all of the above.
115. Which of the following is NOT an example of a decision-making context when using quality cost information?
a. strategic pricing
b. flexible budget analysis
c. cost-volume-profit analysis
d. none of the above
116. Which of the following statements is true about ISO 9000?
a. ISO 9000 is a standard of quality measurement.
b. ISO 9000 has not been adopted in Europe.
c. ISO 9000 certifies the quality of the product.
d. ISO 9000 certifies the firm’s commitment to continuous improvement.

Chapter 14: Quality and Environmental Cost Management
117. Managers need quality cost information for which decisions?
a. strategic pricing
b. cost volume profit analysis
c. cost benefit of quality improvement programs
d. all of the above
118. Quality cost performance reports have two essential elements.
a. Kaizen standards and Taguchi quality loss function
b. Taguchi quality loss function and AQL
c. actual and expected outcomes
d. Kaizen standards and AQL
119. The total quality approach
a. sets a robust zero-defect standard.
b. allows a certain number of defective products.
c. provides no encouragement for continuous improvement.
d. sets a currently attainable standard.
120. A goal based on short-run quality goals is the
a. interim quality performance report.
b. interim quality standard.
c. multiple-period quality trend report.
d. one-year quality performance report.
121. The quality report that compares the current actual quality costs with short-run budgeted quality targets is the
a. long-range quality performance report.
b. one-year quality performance report.
c. multiple-period quality trend report.
d. interim quality performance report.
122. A graph that plots quality costs against time is the
a. interim quality performance report.
b. one-year quality performance report.
c. multiple-period quality trend report.
d. long-range quality performance report.

Chapter 14: Quality and Environmental Cost Management
123. A quality report that compares current actual quality costs with budgeted quality costs for the future is the
a. interim quality performance report.
b. one-year quality performance report.
c. multiple-period quality trend report.
d. long-range quality performance report.
124. Which of the following is a monetary incentive?
a. award to recognize an employee for their efforts
b. error cause identification program
c. public recognition for outstanding achievement
d. gainsharing
125. Which of the following is an example of a physical measure of quality?
a. billing errors
b. number of defects per unit
c. contract errors
d. all of the above
126. Which of the following statements is NOT true concerning zero-defects standards?
a. Defects are caused by either lack of knowledge or lack of attention.
b. JIT is a necessary requirement of a zero-defect approach.
c. Products and services are produced to meet a targeted value.
d. Zero-defects allows a continual search for new ways to improve quality costs.
127. Even under a zero-defects approach to quality, what types of quality costs will still remain?
a. Internal detection costs
b. Internal detection and appraisal costs
c. Prevention and appraisal costs
d. Prevention and internal detection costs
128. Which of the following statements is true regarding a long-range quality report?
a. This report measures trends of quality costs over time.
b. This report measures interim progress towards the zero-defect goal.
c. This report measures actual costs of quality compared to budgeted costs of quality for a period of time.
d. This report measures actual costs of quality versus what quality costs would be at an ideal or targeted zero-
defect standard.

Chapter 14: Quality and Environmental Cost Management
129. What is a reason interim quality standards goals are utilized?
a. For many companies, materials and services purchased are from outside parties and those suppliers need to
be involved in the quality program.
b. Internal employees of the company need to develop confidence of a zero-defect program.
c. Interim standards allow management to see progress towards the long-term goal.
d. all of the above
130. Which of the following is NOT an example of a quality performance report?
a. quality design report
b. interim standard report
c. multiple-period trend report
d. long-range report
131. If a quality performance report compares the actual quality costs for the period to the budgeted quality costs for the
period, that report is
a. a multiple-period trend report.
b. a long-range standard report.
c. an interim standard report.
d. none of the above.
132. As quality improves, savings can potentially be realized by
a. elimination of prevention costs.
b. elimination of appraisal costs.
c. reduced labor costs as a result of less rework and warranty costs.
d. none of the above.
133. If management is reviewing a multiple-period trend graph that shows individual quality cost categories, what
might they expect to see?
a. Overall quality costs decreasing as a percentage of sales with prevention costs, as a category, increasing
over time.
b. Overall quality costs decreasing as a percentage of sales with all categories decreasing over time.
c. Overall quality costs increasing as a percentage of sales with external failure costs decreasing and
prevention costs increasing.
d. Overall quality costs remaining the same as a percentage of sales with prevention and appraisal costs
increasing over time.

Chapter 14: Quality and Environmental Cost Management
134. Environmental internal failure costs would be defined as
a. costs of activities performed because contaminants and waste have been produced, but not discharged into
the environment.
b. costs of activities carried out to prevent the production of contaminants or waste that could cause damage to
the environment.
c. costs of activities executed to determine if processes, products, and other activities within the firm are in
compliance with appropriate environmental standards.
d. costs of activities performed after discharge of contaminants into the environment.
135. When defining environmental costs, damage is defined as
a. fire loss of the factory.
b. a direct degradation of the environment or the unnecessary usage of materials and energy.
c. social costs of pollution.
d. all of the above.
136. Which of the following is NOT an important outcome of reporting environmental costs?
a. the impact of environmental cost on firm profitability
b. the relative amounts expensed in each category of expenses
c. the budgeted environmental costs
d. each expense category expressed as a percentage of total operating costs
137. An example of additional revenue that might result from environmental activities is
a. revenue from recycling.
b. finding new applications for waste.
c. increased sales as a result of improved environmental image.
d. all of the above.
Chapter 14: Quality and Environmental Cost Management
138. The following information pertains to Stanislaus Corporation for 2016:
Designing processes for environment $ 250,000
Testing for contamination $ 200,000
Cleaning up soil after contamination $ 1,500,000
Operating pollution control equipment $ 400,000
Measuring contamination levels $ 250,000
Total Operating Costs $15,000,000
Environmental External Failure costs amount to what percentage of total operating costs?
a. 10%
b. 30%
c. 17.33%
d. none of the above
139. Which of the following is NOT an example of environmental detection activities?
a. recycling scrap
b. auditing environmental activities
c. testing for contamination
d. inspecting products and processes
140. Costs caused by the firm but are incurred and paid for by parties outside the firm are called:
a. Realized external failure costs
b. Realized internal failure costs
c. Unrealized external failure costs
d. Unrealized internal failure costs
141. Costs incurred and paid for by the firm are called:
a. Unrealized internal failure costs
b. Unrealized external failure costs
c. Realized internal failure costs
d. Realized external failure costs

Chapter 14: Quality and Environmental Cost Management
142. Which of the following is NOT a detection activity?
a. inspecting products and processes
b. developing environmental performance measures
c. testing for contamination
d. operating pollution control equipment
143. Which of the following is NOT an internal failure activity?
a. treating and disposing of toxic waste
b. maintaining pollution equipment
c. licensing facilities for producing contaminants
d. cleaning up a polluted lake
144. Which of the following is NOT an external failure activity?
a. obtaining ISO 14001 certification
b. cleaning up oil spills
c. cleaning up contaminated soil
d. settling personal injury claims (environmentally related)
145. Developing environmental performance measures is considered a(n)
a. prevention activity.
b. detection activity.
c. internal failure activity.
d. external failure activity.
146. Maintaining pollution equipment is considered a(n)
a. prevention activity.
b. detection activity.
c. internal failure activity.
d. external failure activity.
147. Receiving medical care due to polluted air is considered a(n)
a. prevention activity.
b. detection activity.
c. internal failure activity.
d. external failure activity.
Chapter 14: Quality and Environmental Cost Management
148. In an environmental cost report, environmental costs are grouped into categories and then each category of
environmental costs is expressed as a percentage of
a. total quality costs.
b. total costs.
c. total sales.
d. total operating costs.
149. At the beginning of the year, Lombardi Company initiated an environmental cost reduction program. To help
assess the impact of the environmental cost reduction improvement program, the following data was collected for
the current and preceding year:
Preceding Year
Current Year
Operating costs
$4,500,000
$4,500,000
Designing products
3,000
4,500
Auditing environmental activities
7,500
12,000
Recycling scrap
60,000
45,000
Disposing of toxic waste
120,000
75,000
Testing for contamination
15,000
30,000
Cleaning up oil spills
105,000
82,500
For the current year, prevention costs are what percentage of operating costs?
a. 0.10%
b. 0.90%
c. 1.10%
d. 0.55%
Chapter 14: Quality and Environmental Cost Management
150. At the beginning of the year, Lombardi Company initiated an environmental cost reduction program. To help
assess the impact of the environmental cost reduction improvement program, the following data was collected for
the current and preceding year:
Preceding Year
Current Year
Operating costs
$4,500,000
$4,500,000
Designing products
3,000
4,500
Auditing environmental activities
7,500
12,000
Recycling scrap
60,000
45,000
Disposing of toxic waste
120,000
75,000
Testing for contamination
15,000
30,000
Cleaning up oil spills
105,000
82,500
For the current year, detection costs are what percentage of operating costs?
a. 0.07%
b. 1.93%
c. 0.93%
d. 0..90%
151. At the beginning of the year, Lombardi Company initiated an environmental cost reduction program. To help
assess the impact of the environmental cost reduction improvement program, the following data was collected for
the current and preceding year:
Preceding Year
Current Year
Operating costs
$4,500,000
$4,500,000
Designing products
3,000
4,500
Auditing environmental activities
7,500
12,000
Recycling scrap
60,000
45,000
Disposing of toxic waste
120,000
75,000
Testing for contamination
15,000
30,000
Cleaning up oil spills
105,000
82,500
For the current year, internal failure costs are what percentage of operating costs?
a. 2.67%
b. 2.76%
c. 1.38%
d. 0.93%
Chapter 14: Quality and Environmental Cost Management
152. At the beginning of the year, Lombardi Company initiated an environmental cost reduction program. To help
assess the impact of the environmental cost reduction improvement program, the following data was collected for
the current and preceding year:
Preceding Year
Current Year
Operating costs
$4,500,000
$4,500,000
Designing products
3,000
4,500
Auditing environmental activities
7,500
12,000
Recycling scrap
60,000
45,000
Disposing of toxic waste
120,000
75,000
Testing for contamination
15,000
30,000
Cleaning up oil spills
105,000
82,500
For the current year, external failure costs are what percentage of operating costs?
a. 2.67%
b. 1.83%
c. 1.38%
d. 0.93%
Figure 14-7
At the beginning of the year, Molybdenum Company initiated an environmental cost reduction program. To help
assess the impact of the environmental cost reduction improvement program, the following data was collected for
the current and preceding year:
Preceding Year
Current Year
Operating costs
$2,400,000
$2,400,000
Training employees
30,000
48,000
Inspecting processes
7,000
8,000
Operating pollution control equipment
32,000
50,000
Maintaining pollution equipment
60,000
28,000
Developing environmental performance measures
10,000
12,000
Cleaning up lake
36,000
24,000
153. Refer to Figure 14-7. For the current year, prevention costs are what percentage of operating costs?
a. 9.00%
b. 8.25%
c. 7.00%
d. 2.00%
Chapter 14: Quality and Environmental Cost Management
154. Refer to Figure 14-7. For the current year, external failure costs are what percentage of operating costs?
a. 1.5350%
b. 1.1875%
c. 1.0000%
d. 0.8350%
155. Refer to Figure 14-7. For the current year, detection costs are what percentage of operating costs?
a. 3.333%
b. 0.833%
c. 0.500%
d. 0.333%
156. Refer to Figure 14-7. For the current year, internal failure costs are what percentage of operating costs?
a. 4.25%
b. 3.25%
c. 2.00%
d. 1.25%
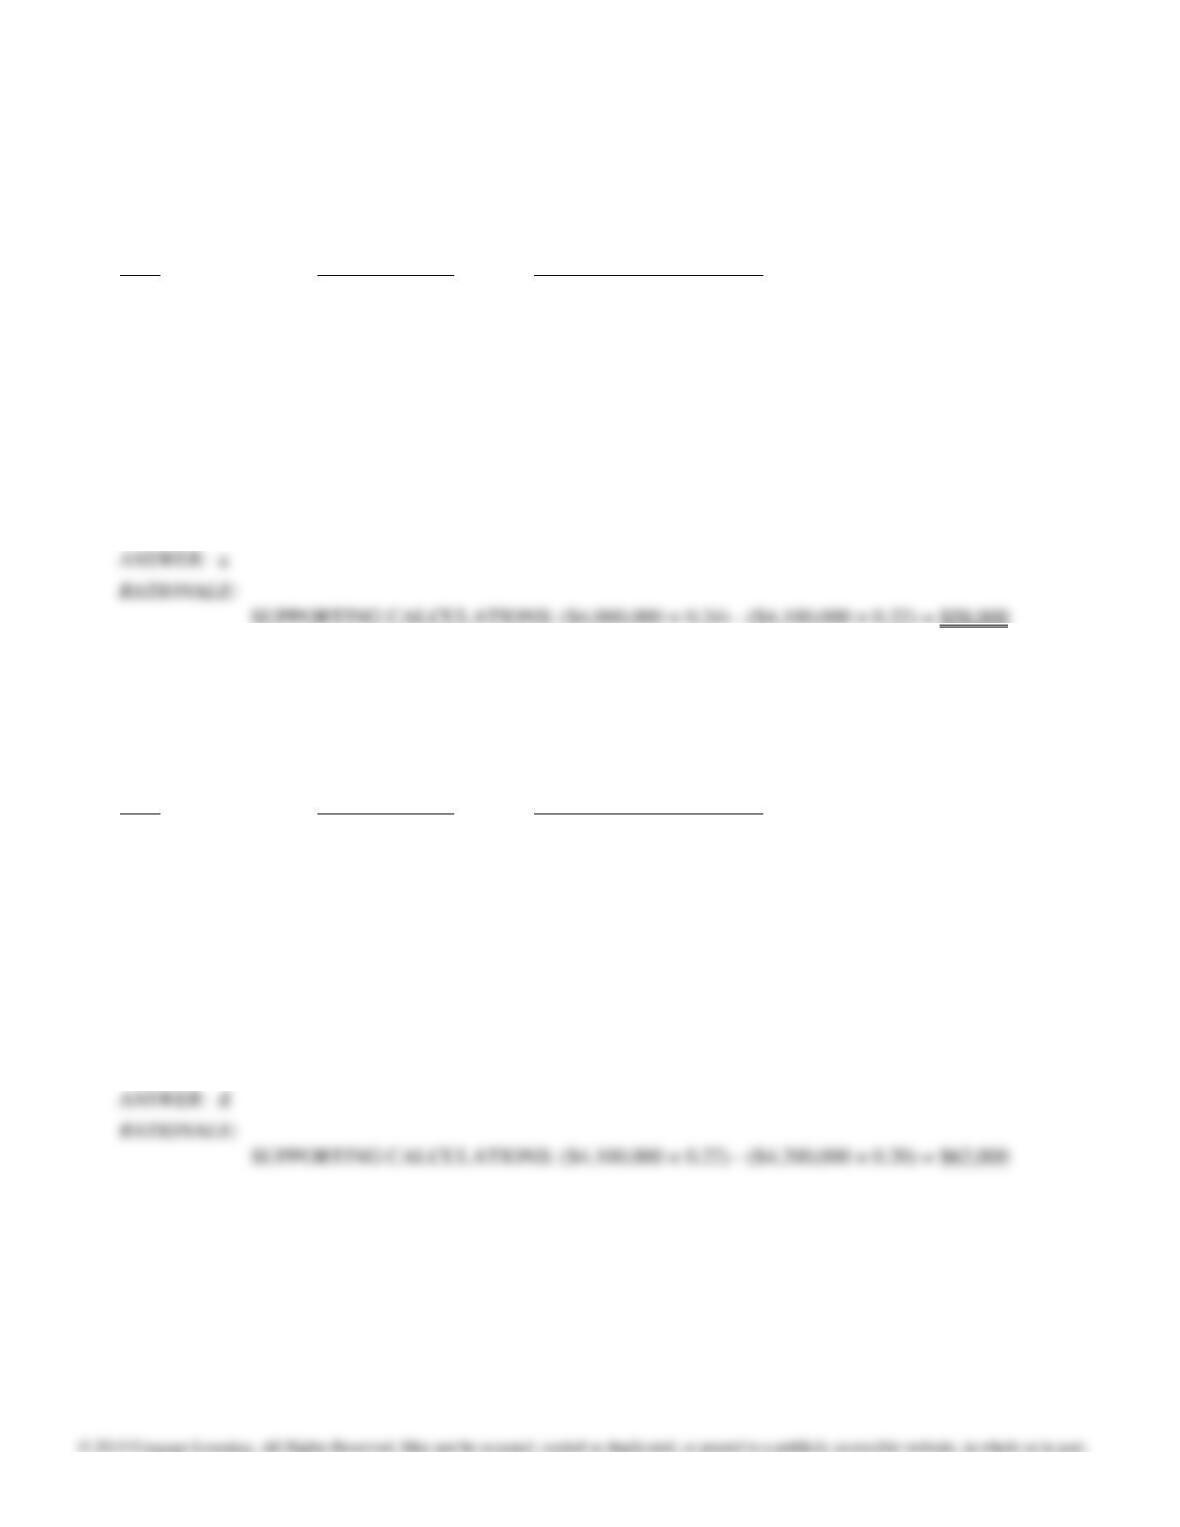
Chapter 14: Quality and Environmental Cost Management
157. Maroone Corporation reported the following operating costs and environmental quality costs for the past four
years. Assume that all environmental quality costs are variable and that all changes in the quality cost ratios are
due to an environmental cost reduction program.
Quality Costs as
Year
Operating Costs
Percent of Operating Costs
2016
$4,000,000
24.0
2017
4,100,000
22.0
2018
4,200,000
20.0
2019
4,300,000
18.0
What is the change in environmental costs from 2016 to 2017?
a. $58,000
b. $66,000
c. $902,000
d. $960,000
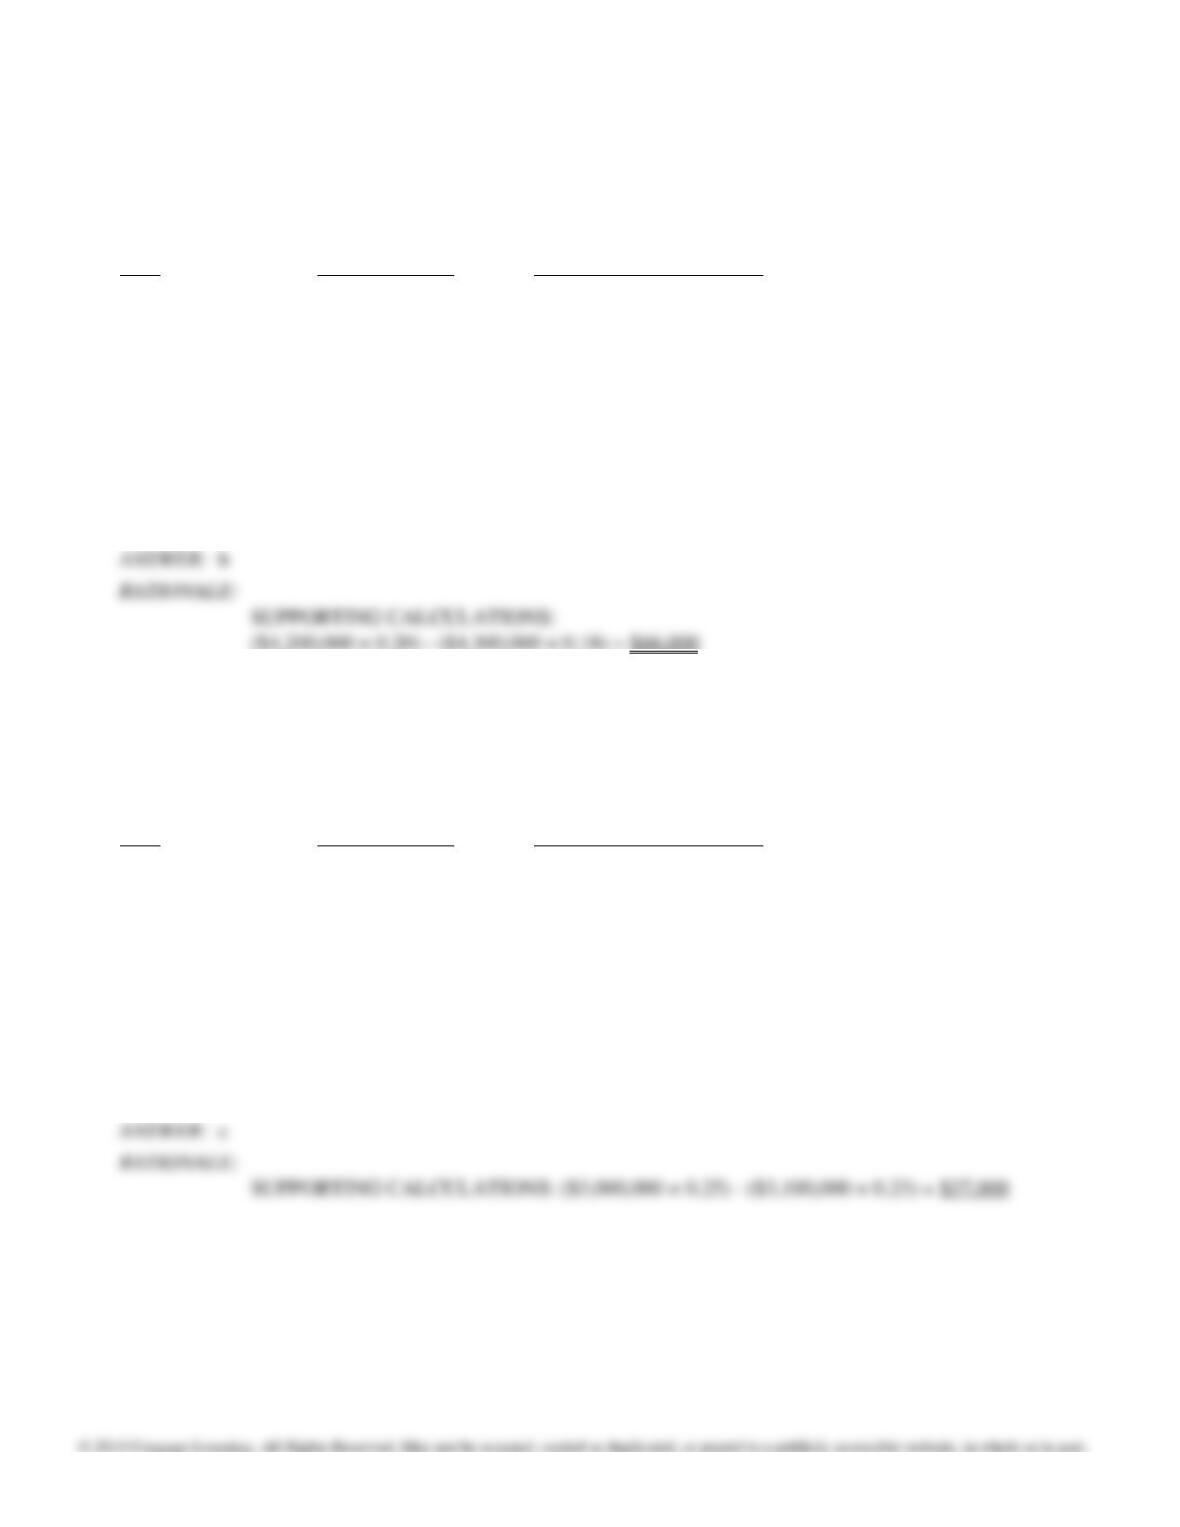
158. Maroone Corporation reported the following operating costs and environmental quality costs for the past four
years. Assume that all environmental quality costs are variable and that all changes in the quality cost ratios are
due to an environmental cost reduction program.
Quality Costs as
Year
Operating Costs
Percent of Operating Costs
2016
$4,000,000
24.0
2017
4,100,000
22.0
2018
4,200,000
20.0
2019
4,300,000
18.0
What is the change in environmental costs from 2017 to 2018?
a. $840,000
b. $902,000
c. $58,000
d. $62,000
Chapter 14: Quality and Environmental Cost Management
159. Maroone Corporation reported the following operating costs and environmental quality costs for the past four
years. Assume that all environmental quality costs are variable and that all changes in the quality cost ratios are
due to an environmental cost reduction program.
Quality Costs as
Year
Operating Costs
Percent of Operating Costs
2016
$4,000,000
24.0
2017
4,100,000
22.0
2018
4,200,000
20.0
2019
4,300,000
18.0
What is the change in environmental costs from 2016 to 2017?
a. $58,000
b. $66,000
c. $774,000
d. $840,000
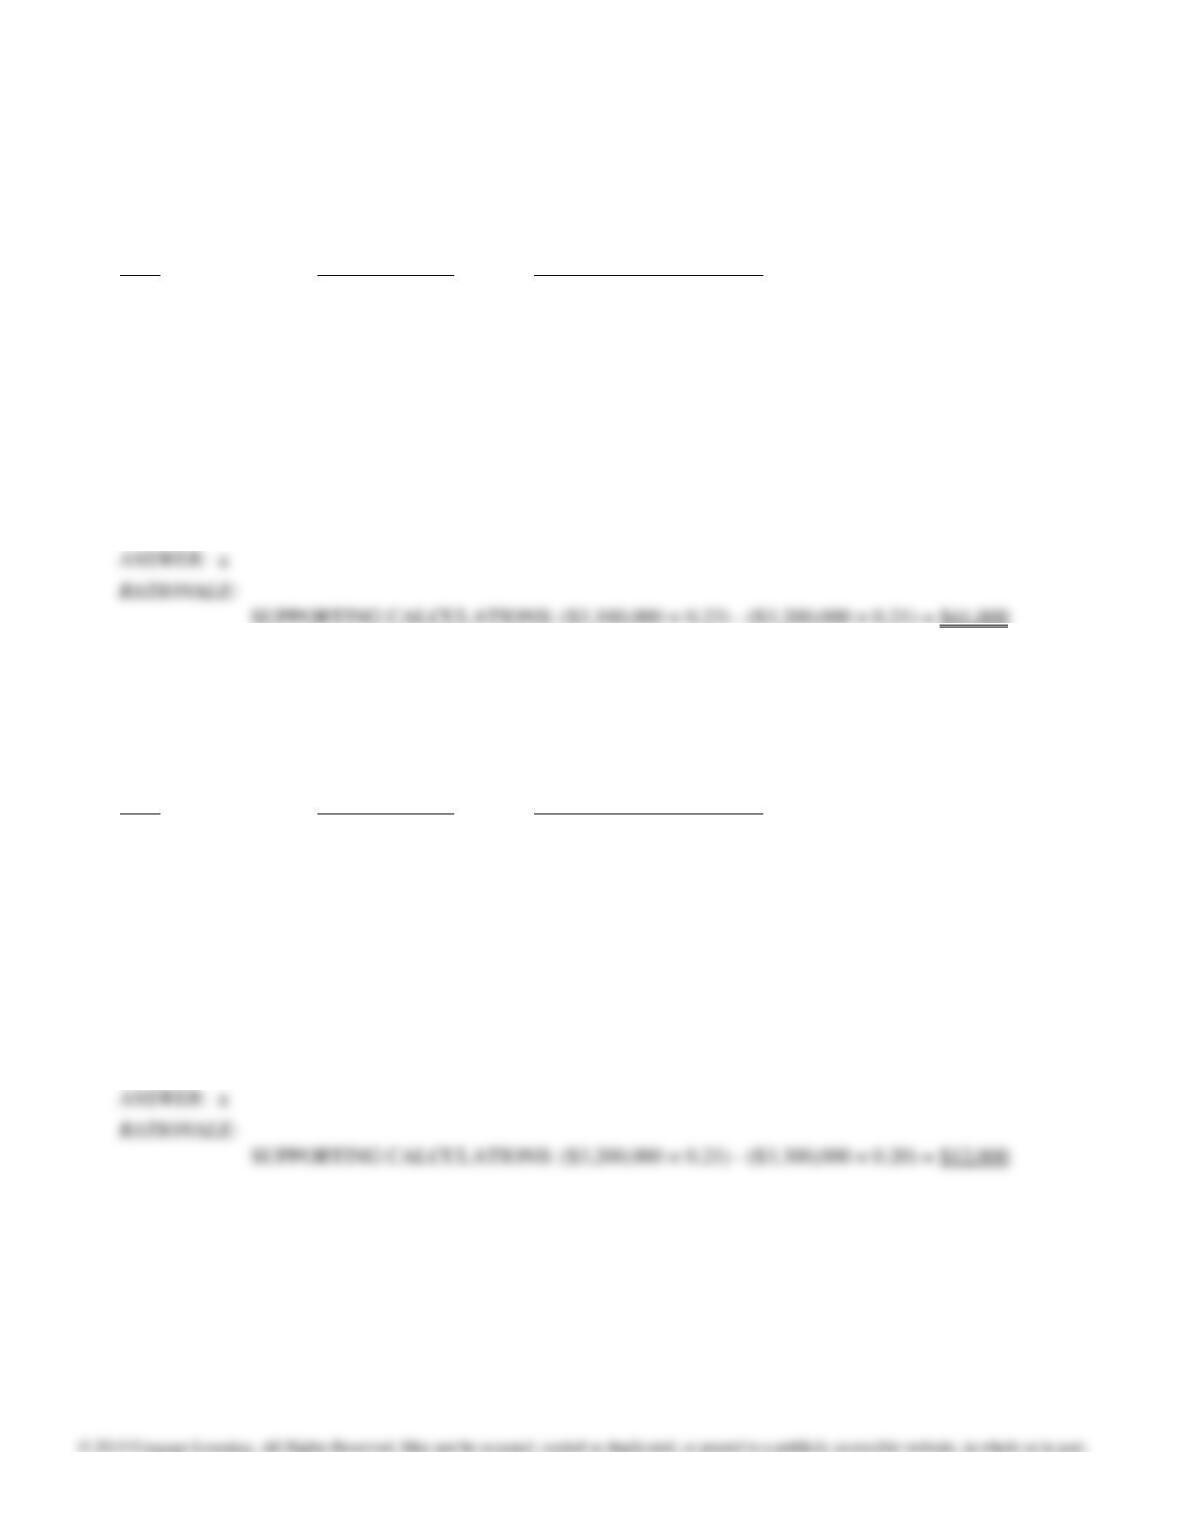
160. Carborundum Corporation reported the following operating costs and environmental quality costs for the past four
years. Assume that all environmental quality costs are variable and that all changes in the quality cost ratios are
due to an environmental cost reduction program.
Quality Costs as
Year
Operating Costs
Percent of Operating Costs
2016
$3,000,000
25.0
2017
3,100,000
23.0
2018
3,200,000
21.0
2019
3,300,000
20.0
What is the change in environmental costs from 2016 to 2017?
a. $12,000
b. $41,000
c. $37,000
d. $750,000
Chapter 14: Quality and Environmental Cost Management
161. Carborundum Corporation reported the following operating costs and environmental quality costs for the past four
years. Assume that all environmental quality costs are variable and that all changes in the quality cost ratios are
due to an environmental cost reduction program.
Quality Costs as
Year
Operating Costs
Percent of Operating Costs
2016
$3,000,000
25.0
2017
3,100,000
23.0
2018
3,200,000
21.0
2019
3,300,000
20.0
What is the change in environmental costs from 2017 to 2018?
a. $41,000
b. $37,000
c. $12,000
d. $672,000
162. Carborundum Corporation reported the following operating costs and environmental quality costs for the past four
years. Assume that all environmental quality costs are variable and that all changes in the quality cost ratios are
due to an environmental cost reduction program.
Quality Costs as
Year
Operating Costs
Percent of Operating Costs
2016
$3,000,000
25.0
2017
3,100,000
23.0
2018
3,200,000
21.0
2019
3,300,000
20.0
What is the change in environmental costs from 2018 to 2019?
a. $12,000
b. $37,000
c. $41,000
d. $672,000

Chapter 14: Quality and Environmental Cost Management
163. An environmental financial statement would NOT contain information on
a. income sources.
b. prevention costs.
c. cost of goods sold.
d. current savings.
164. An environmental benefits report would NOT contain
a. cost redesign.
b. additional revenues.
c. current savings.
d. cost avoidance.
165. The lowest environmental costs are attainable at the
a. zero prevention point.
b. zero damage point.
c. revalorizing point.
d. sustainable development point.
Chapter 14: Quality and Environmental Cost Management
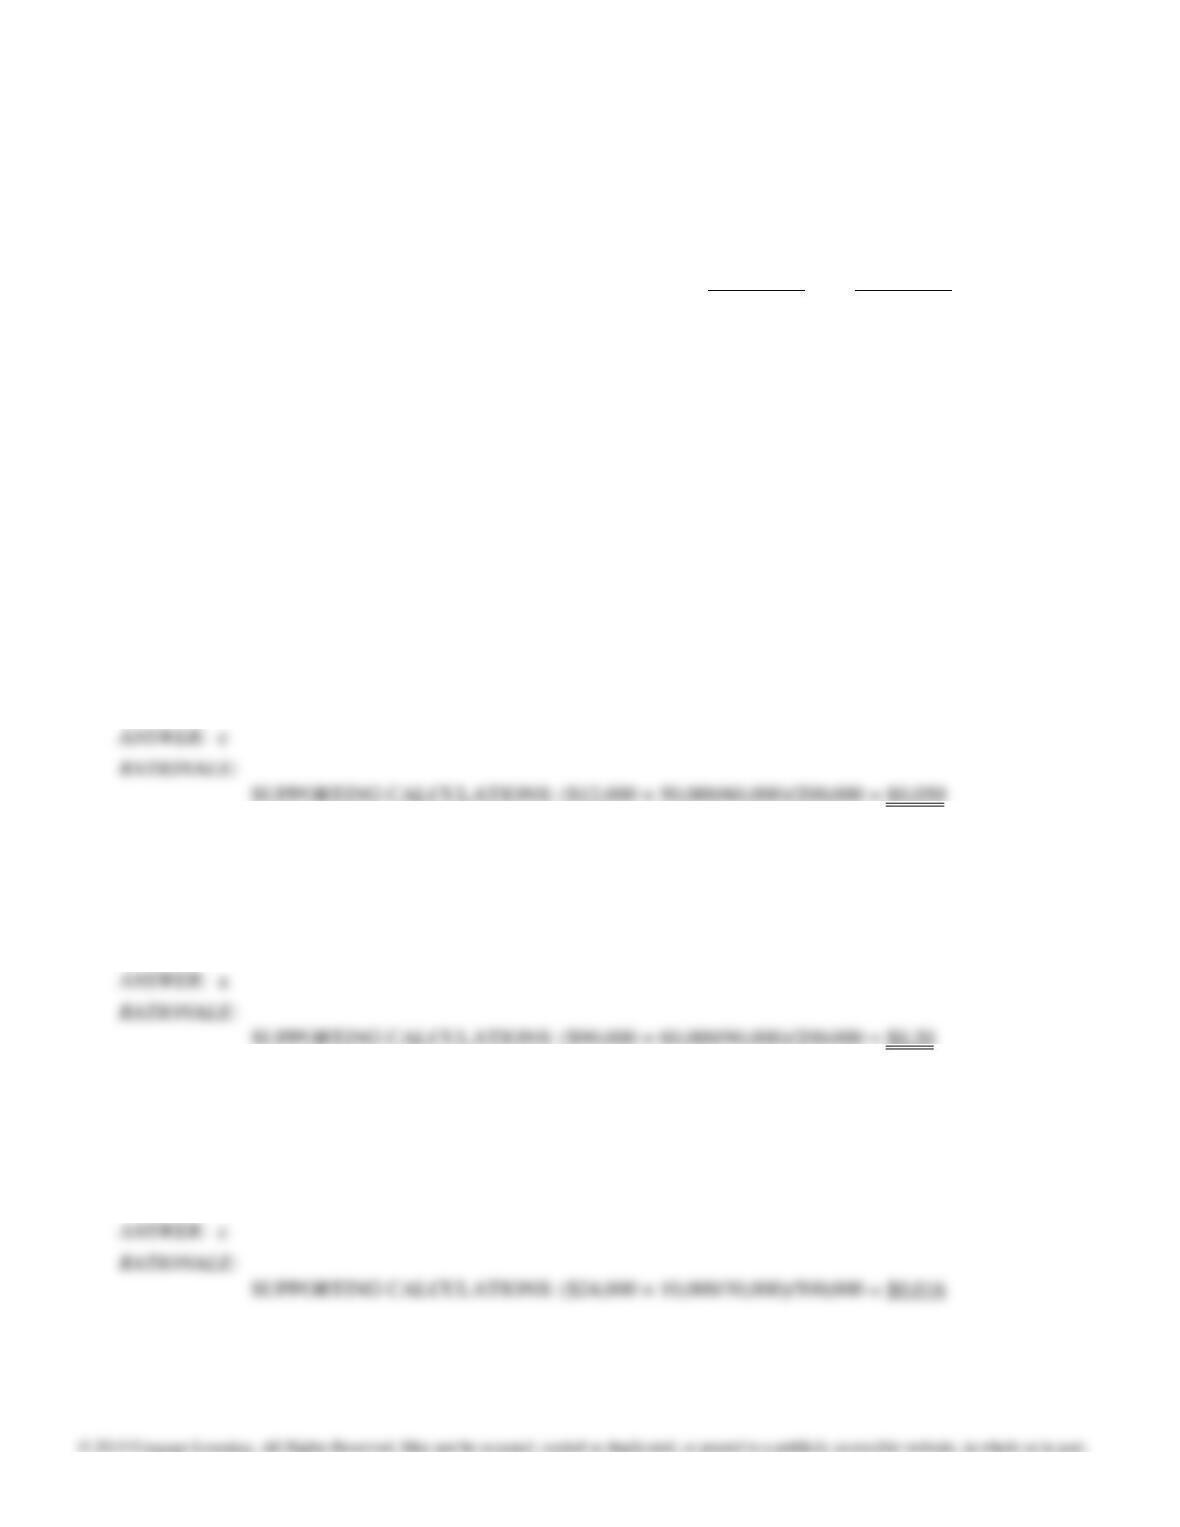
Figure 14-8
Carbondioxide Chemical produces a number of chemical products, two of which are Product A1 and Product A2.
The controller and environmental manager have identified the following environmental activities and costs
associated with the two products:
Product A1
Product A2
Pounds produced
200,000
500,000
Packaging materials (pounds)
60,000
30,000
Energy usage (kilowatt hours)
20,000
10,000
Toxic releases (pounds into air)
50,000
10,000
Pollution control (machine hours)
8,000
2,000
Costs of activities:
Using packaging materials
$90,000
Using energy
24,000
Releasing toxins (fines)
12,000
Operating pollution control equipment
28,000
166. Refer to Figure 14-8. What is the fines cost per unit for toxic releases of Product A1?
a. $0.020
b. $0.004
c. $0.050
d. $0.040
167. Refer to Figure 14-8. What is the packing cost per unit of Product A1?
a. $0.30
b. $0.45
c. $0.15
d. $0.12
168. Refer to Figure 14-8. What is the energy usage cost per unit of Product A2?
a. $0.048
b. $0.032
c. $0.016
d. $0.080
Chapter 14: Quality and Environmental Cost Management
169. Refer to Figure 14-8. What is the pollution control cost per unit of Product A2?
a. $0.1120
b. $0.0280
c. $0.0112
d. $0.0448
170. The costs of processes that produce, market, deliver, and dispose of products are called:
a. Ecocosts
b. Internal failure costs
c. Environmental product costs
d. External failure costs
171. The assignment of private and societal costs to products is referred to as:
a. Full private costing
b. Full environmental costing
c. Life-cycle costing
d. Market costing
172. The assignment of only private costs to individual products is called:
a. Full private costing
b. Full environmental costing
c. Life-cycle costing
d. Market costing