Chapter 14: Quality and Environmental Cost Management
173. Hannibal Company produces a number of chemical products, two of which are Product X1 and Product X2. The
controller and environmental manager have identified the following environmental activities and costs associated
with the two products:
Product X1
Product X2
Pounds produced
400,000
1,000,000
Packaging materials (pounds)
120,000
60,000
Energy usage (kilowatt hours)
40,000
20,000
Toxic releases (pounds into air)
100,000
20,000
Pollution control (machine hours)
16,000
4,000
Costs of activities:
Using packaging materials
$360,000
Using energy
96,000
Releasing toxins (fines)
48,000
Operating pollution control equipment
112,000
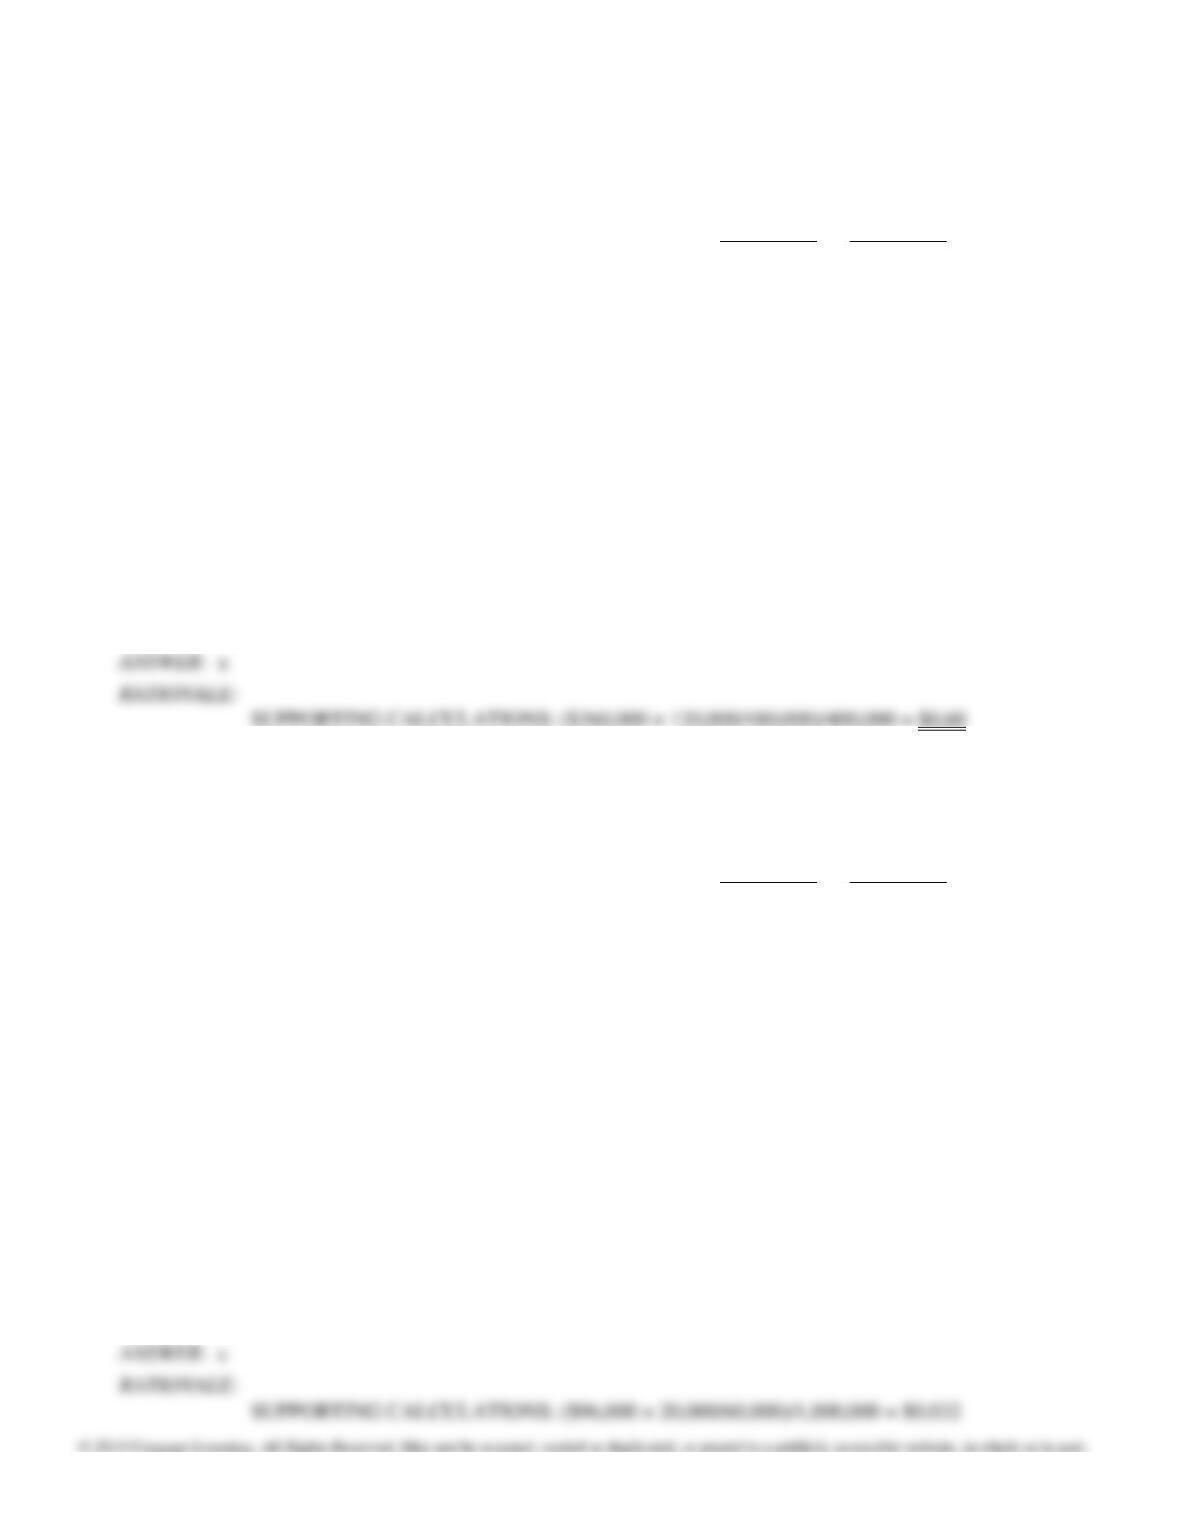
What is the packing cost per unit of Product X1?
a. $0.60
b. $0.90
c. $0.30
d. $0.24
174. Hannibal Company produces a number of chemical products, two of which are Product X1 and Product X2. The
controller and environmental manager have identified the following environmental activities and costs associated
with the two products:
Product X1
Product X2
Pounds produced
400,000
1,000,000
Packaging materials (pounds)
120,000
60,000
Energy usage (kilowatt hours)
40,000
20,000
Toxic releases (pounds into air)
100,000
20,000
Pollution control (machine hours)
16,000
4,000
Costs of activities:
Using packaging materials
$360,000
Using energy
96,000
Releasing toxins (fines)
48,000
Operating pollution control equipment
112,000
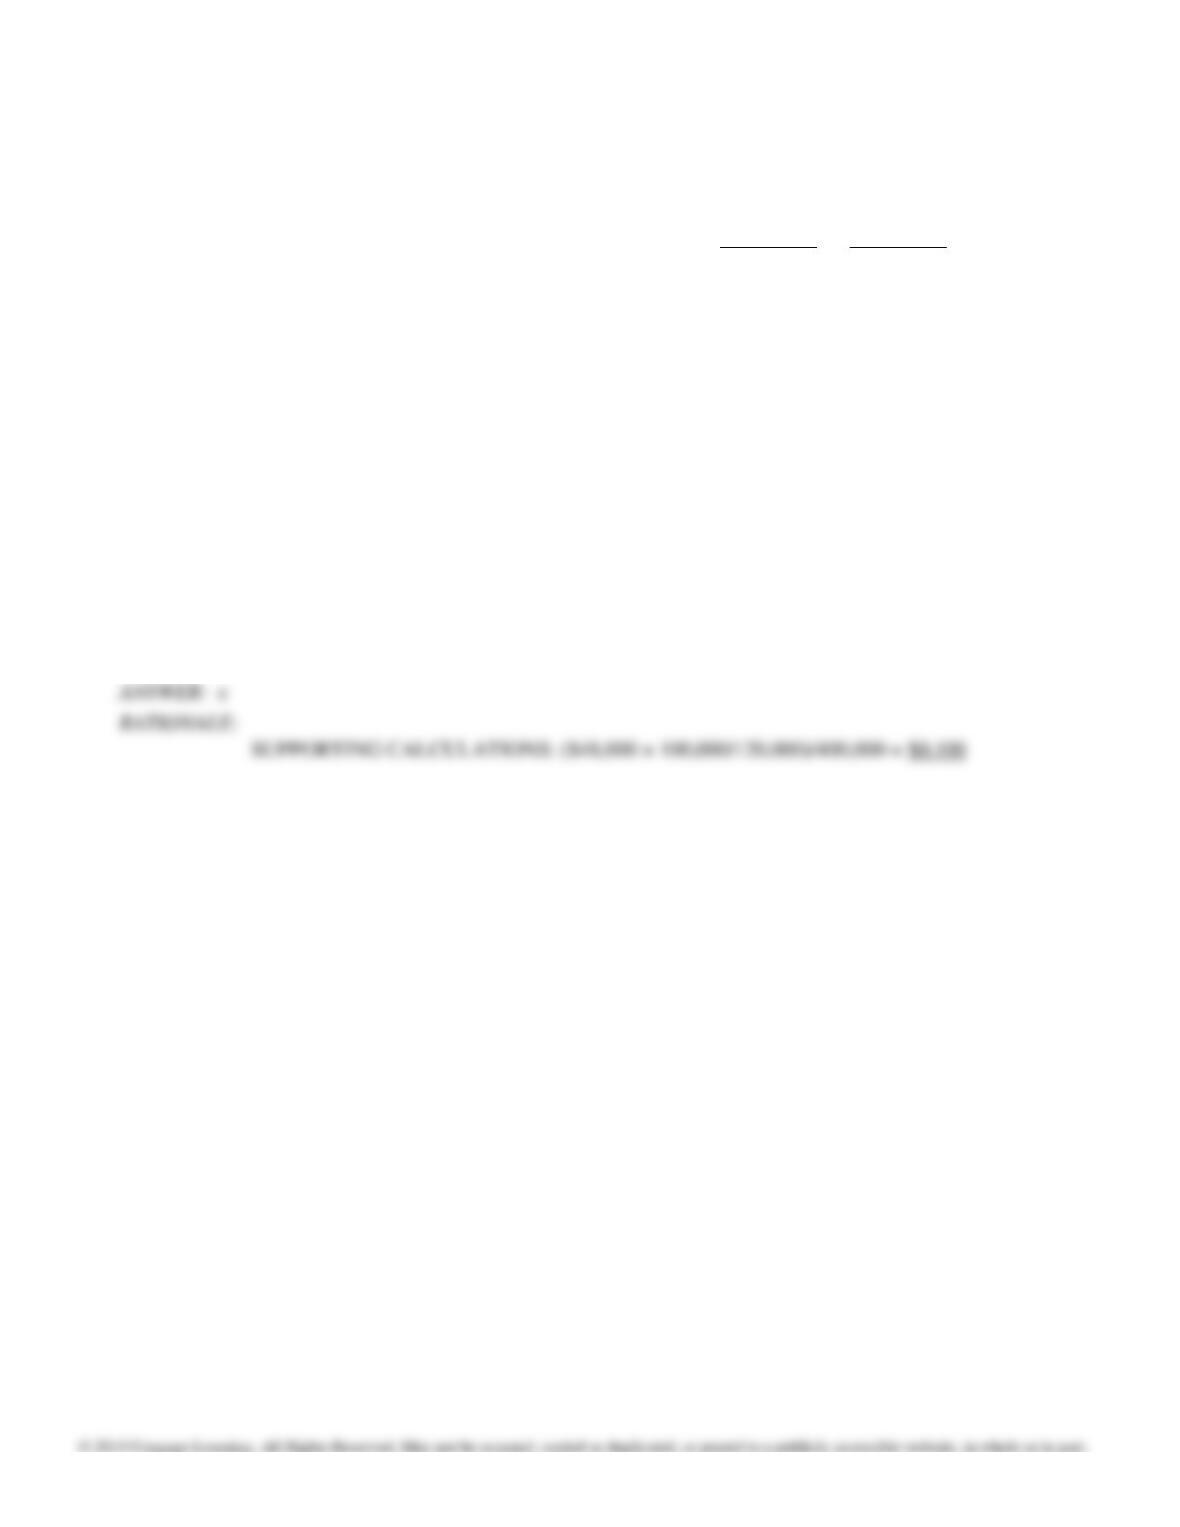
What is the energy usage cost per unit of Product X2?
a. $0.096
b. $0.064
c. $0.032
d. $0.160
Chapter 14: Quality and Environmental Cost Management
175. Hannibal Company produces a number of chemical products, two of which are Product X1 and Product X2. The
controller and environmental manager have identified the following environmental activities and costs associated
with the two products:
Product X1
Product X2
Pounds produced
400,000
1,000,000
Packaging materials (pounds)
120,000
60,000
Energy usage (kilowatt hours)
40,000
20,000
Toxic releases (pounds into air)
100,000
20,000
Pollution control (machine hours)
16,000
4,000
Costs of activities:
Using packaging materials
$360,000
Using energy
96,000
Releasing toxins (fines)
48,000
Operating pollution control equipment
112,000
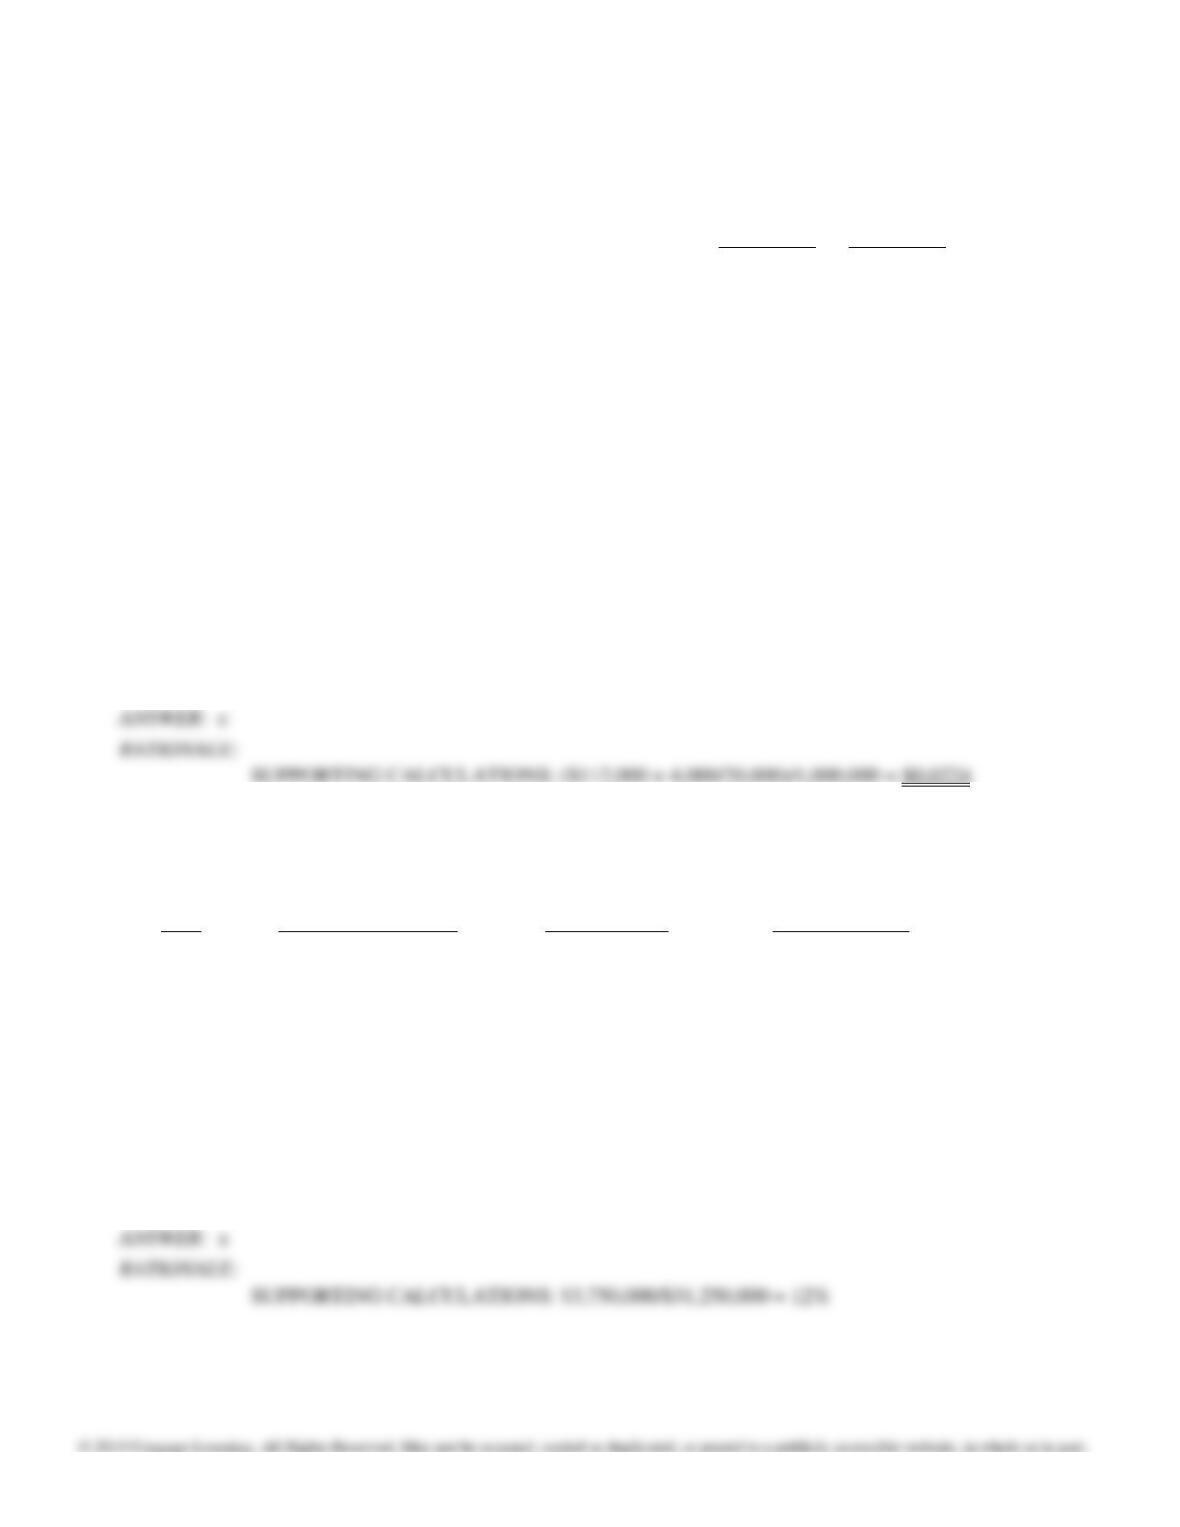
What is the fines cost per unit for toxic releases of Product X1?
a. $0.040
b. $0.008
c. $0.100
d. $0.080
Chapter 14: Quality and Environmental Cost Management
176. Hannibal Company produces a number of chemical products, two of which are Product X1 and Product X2. The
controller and environmental manager have identified the following environmental activities and costs associated
with the two products:
Product X1
Product X2
Pounds produced
400,000
1,000,000
Packaging materials (pounds)
120,000
60,000
Energy usage (kilowatt hours)
40,000
20,000
Toxic releases (pounds into air)
100,000
20,000
Pollution control (machine hours)
16,000
4,000
Costs of activities:
Using packaging materials
$360,000
Using energy
96,000
Releasing toxins (fines)
48,000
Operating pollution control equipment
112,000
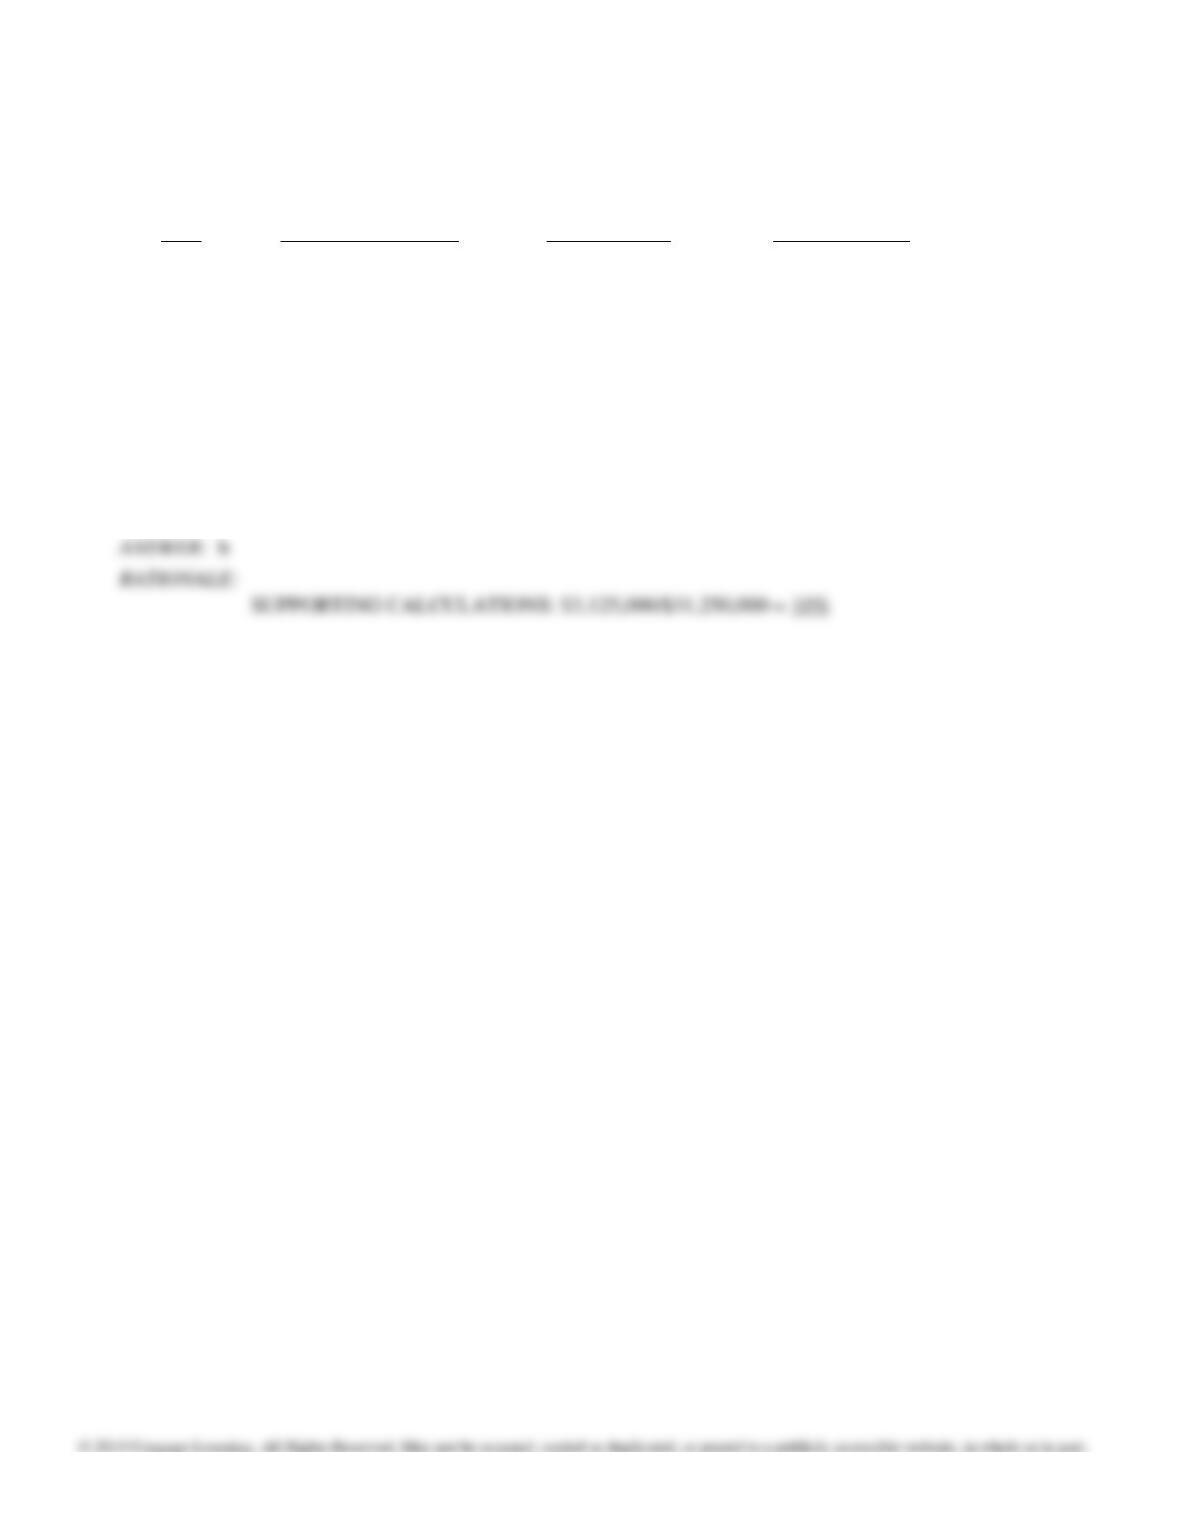
What is the pollution control cost per unit of Product X2?
a. $0.2240
b. $0.0560
c. $0.0224
d. $0.0896
177. As part of its environmental cost reporting system, McClaren Company tracks its total environmental costs.
Consider the cost and sales data given:
Total
Year
Environmental Costs
Sales Revenue
Operating Costs
2014
$3,750,000
$31,250,000
$25,000,000
2015
3,125,000
$31,250,000
$25,000,000
2016
2,750,000
$31,250,000
$25,000,000
2017
2,406,250
$31,250,000
$25,000,000
What is the environmental costs as a percentage of sales for 2016?
a. 12%
b. 15%
c. 80%
d. 8.33%
Chapter 14: Quality and Environmental Cost Management
178. As part of its environmental cost reporting system, McClaren Company tracks its total environmental costs.
Consider the cost and sales data given:
Total
Year
Environmental Costs
Sales Revenue
Operating Costs
2014
$3,750,000
$31,250,000
$25,000,000
2015
3,125,000
31,250,000
$25,000,000
2016
2,750,000
39,375,000
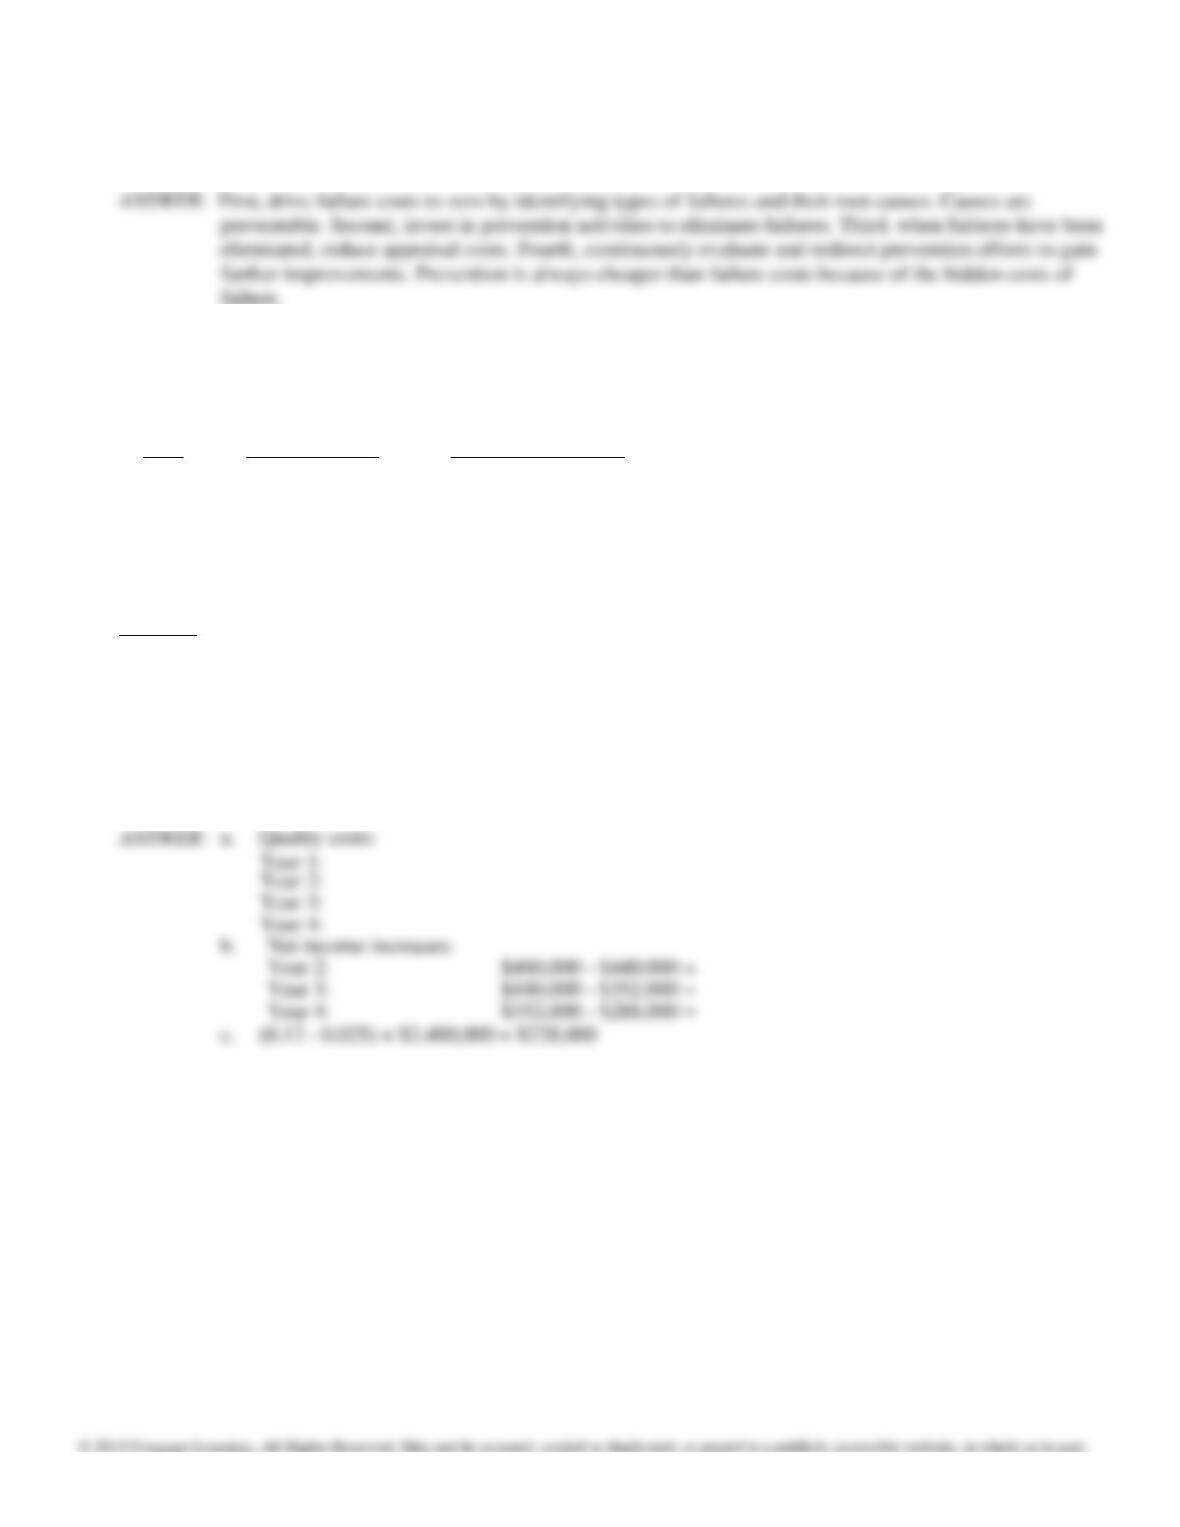
$25,000,000
2017
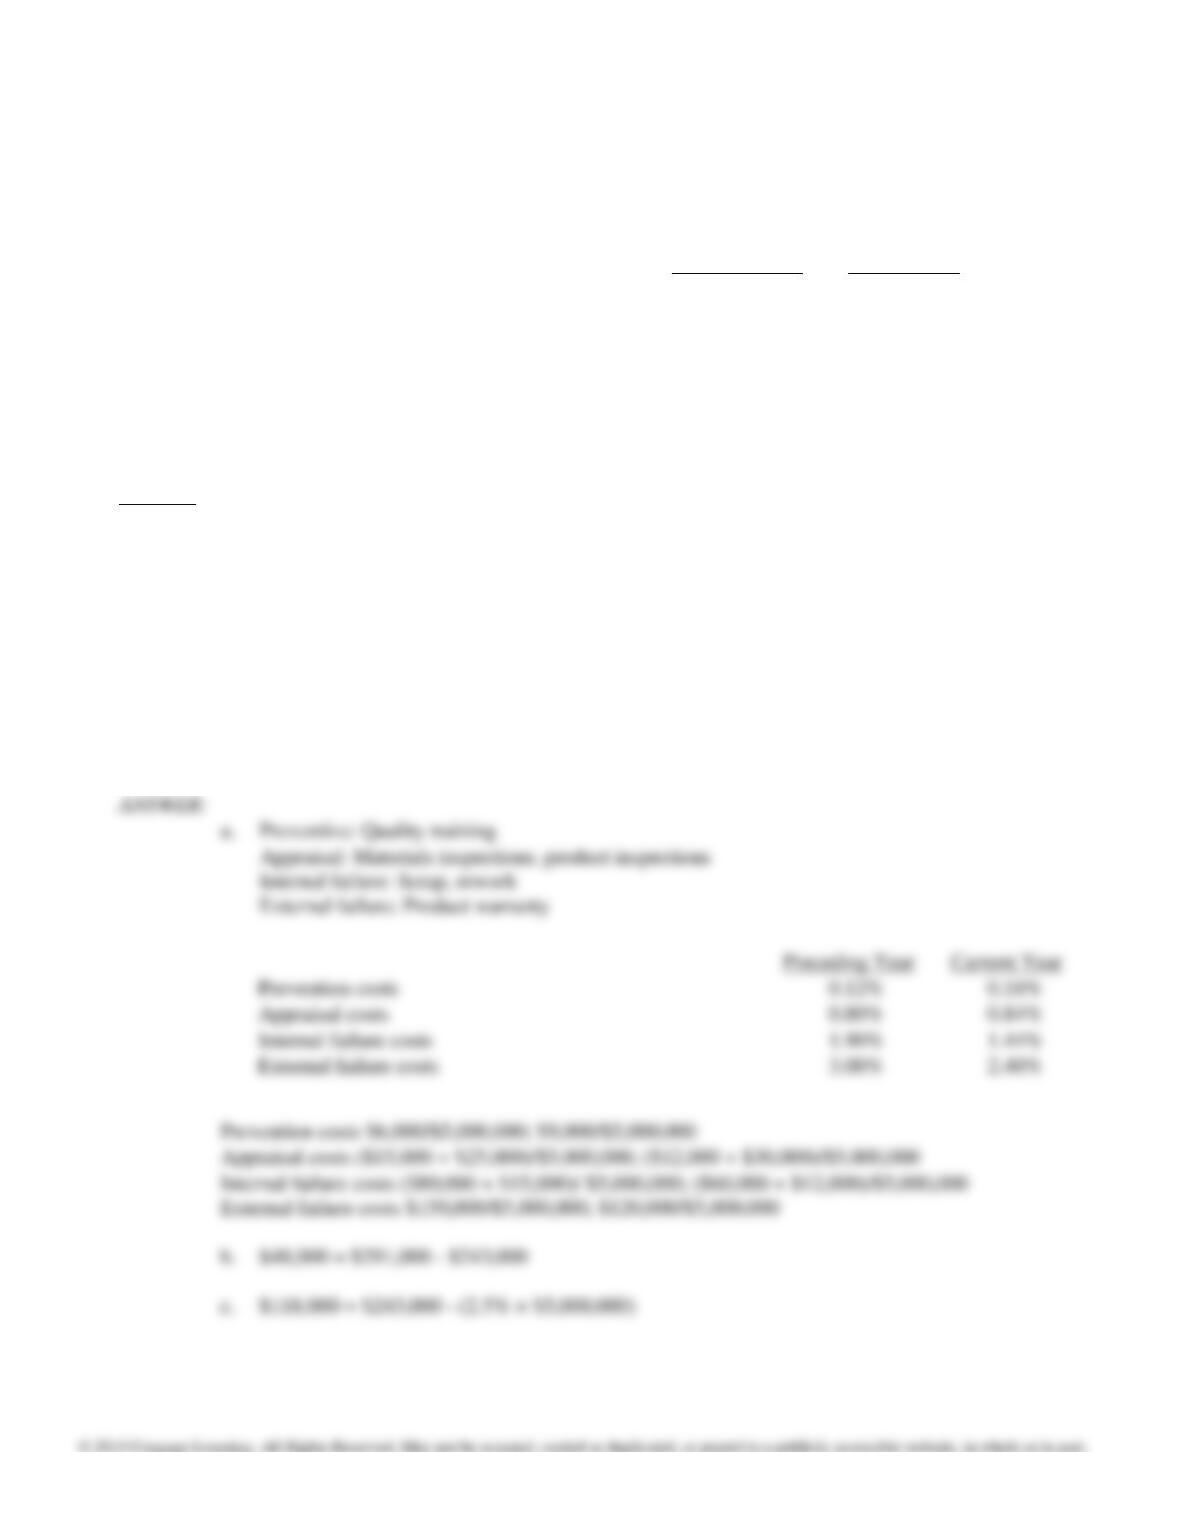
2,406,250
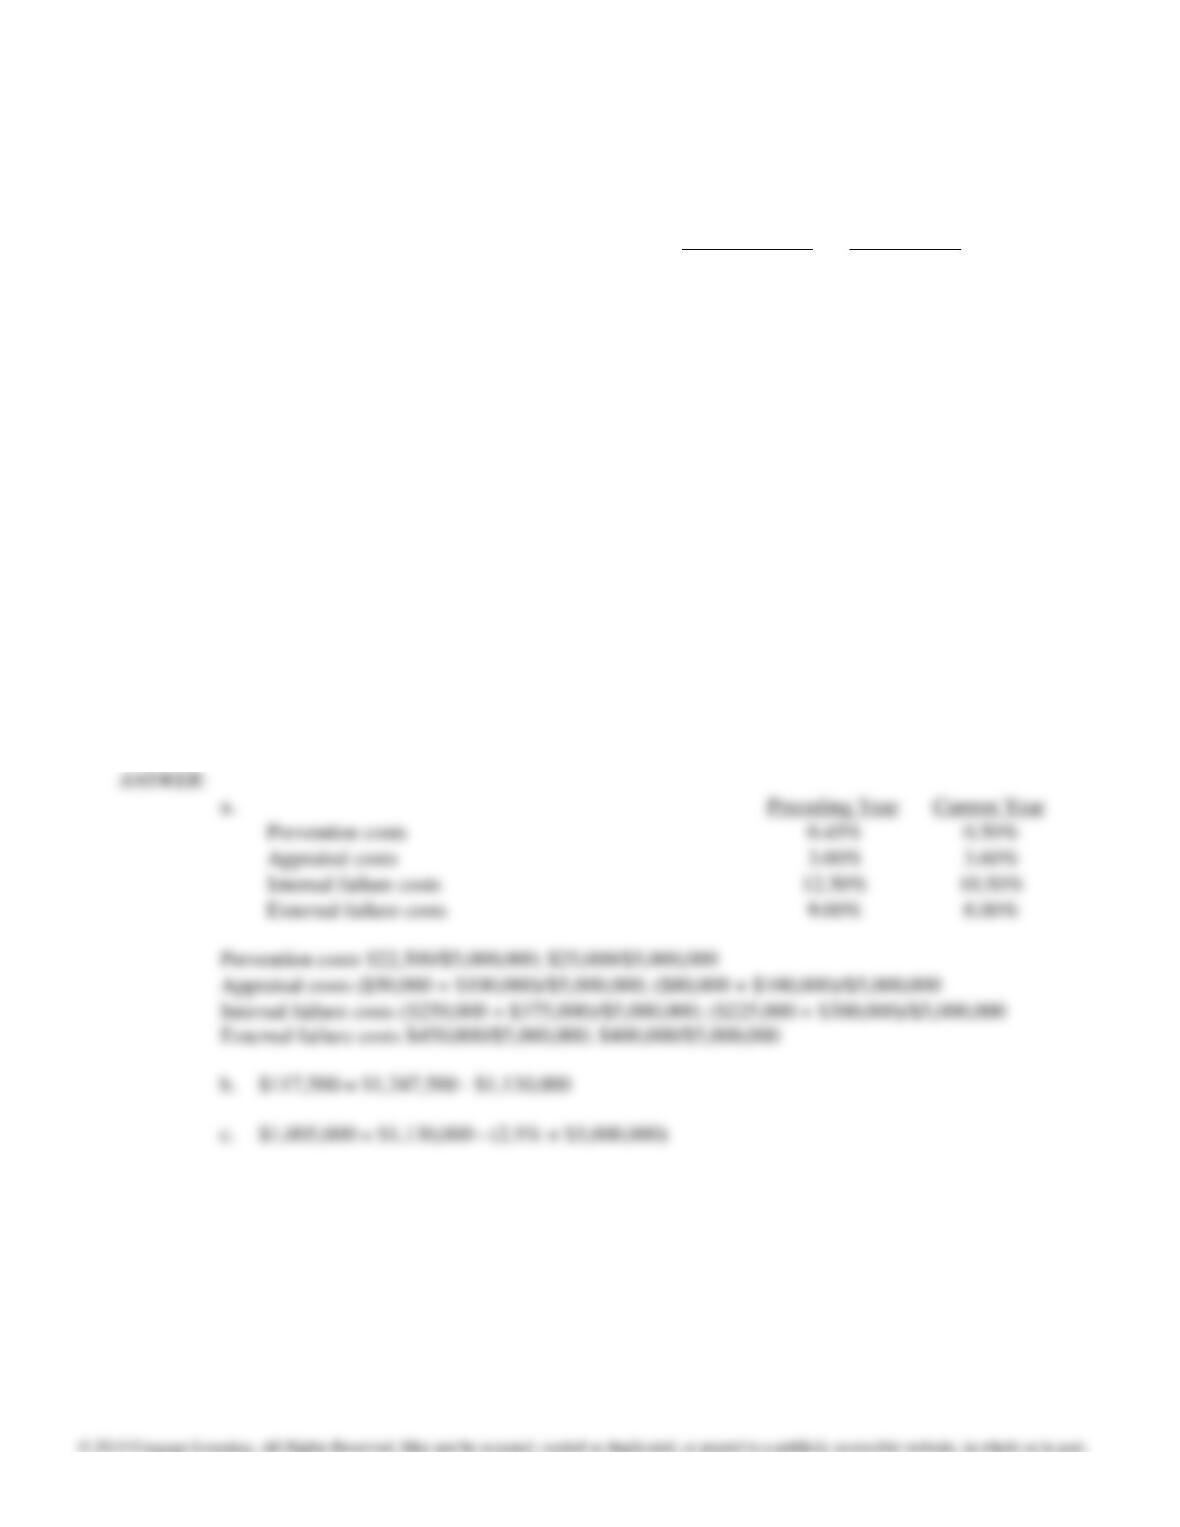
39,375,000
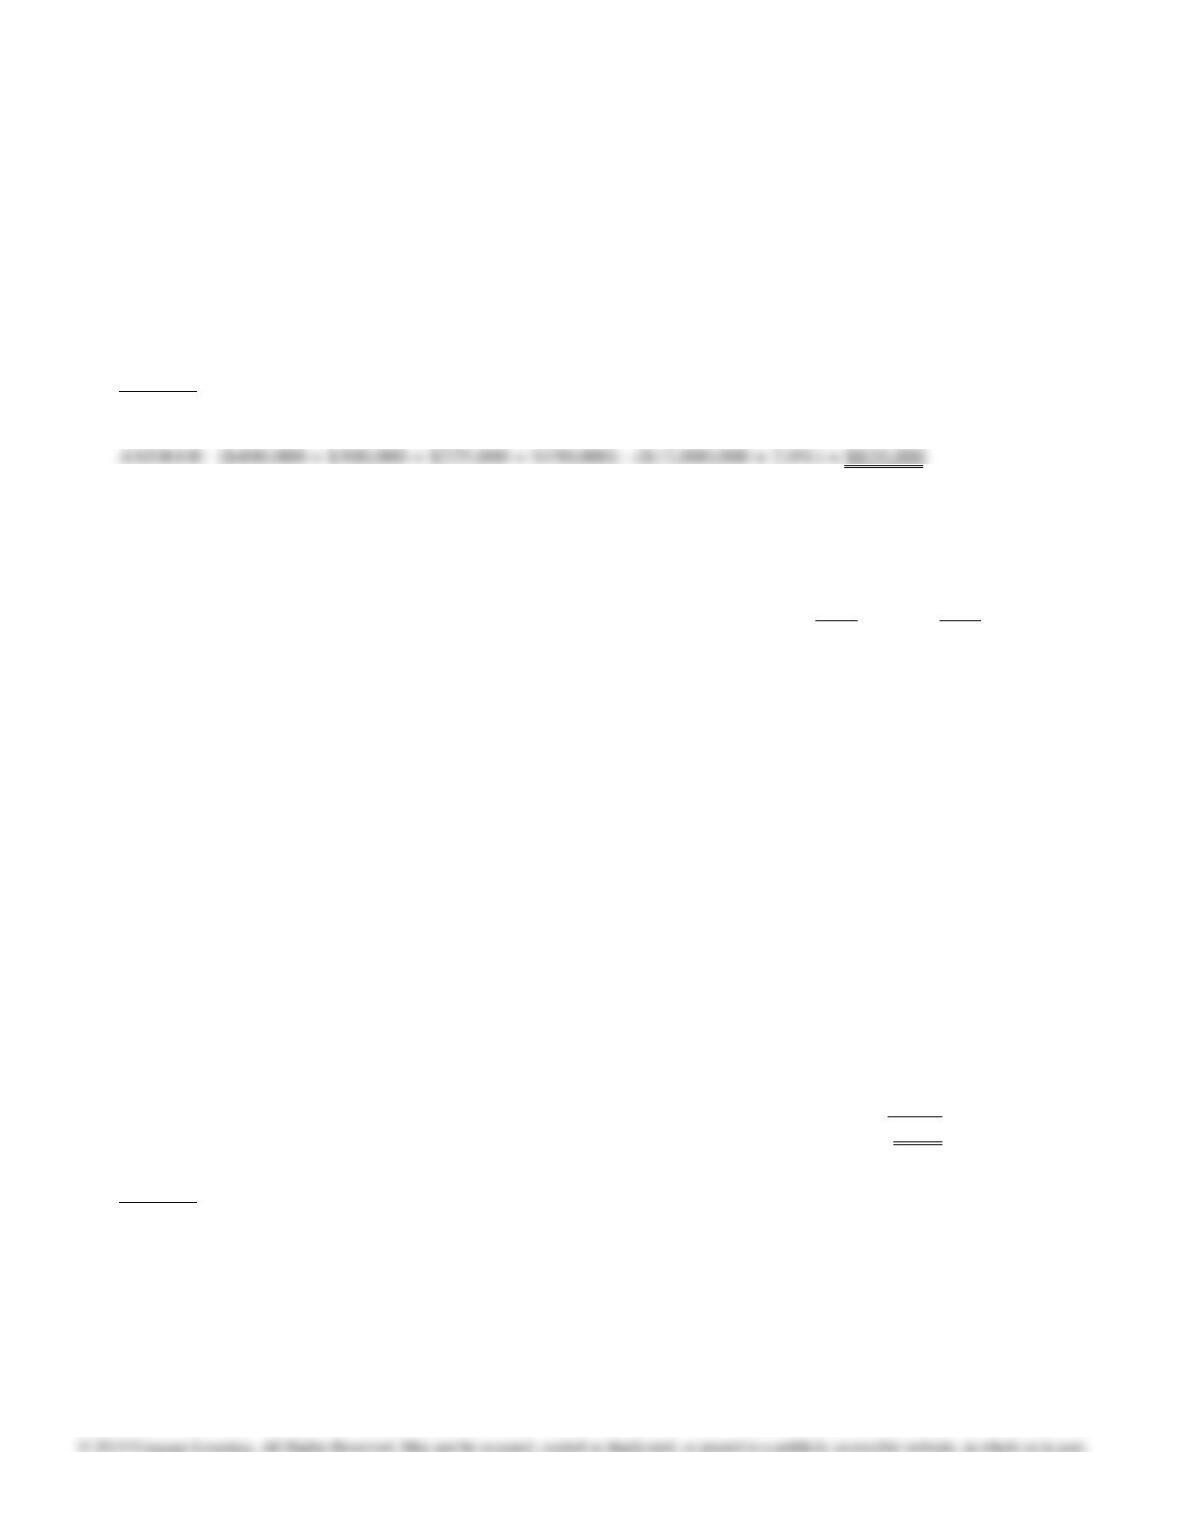
$25,000,000
What is the environmental costs as a percentage of sales for 2017?
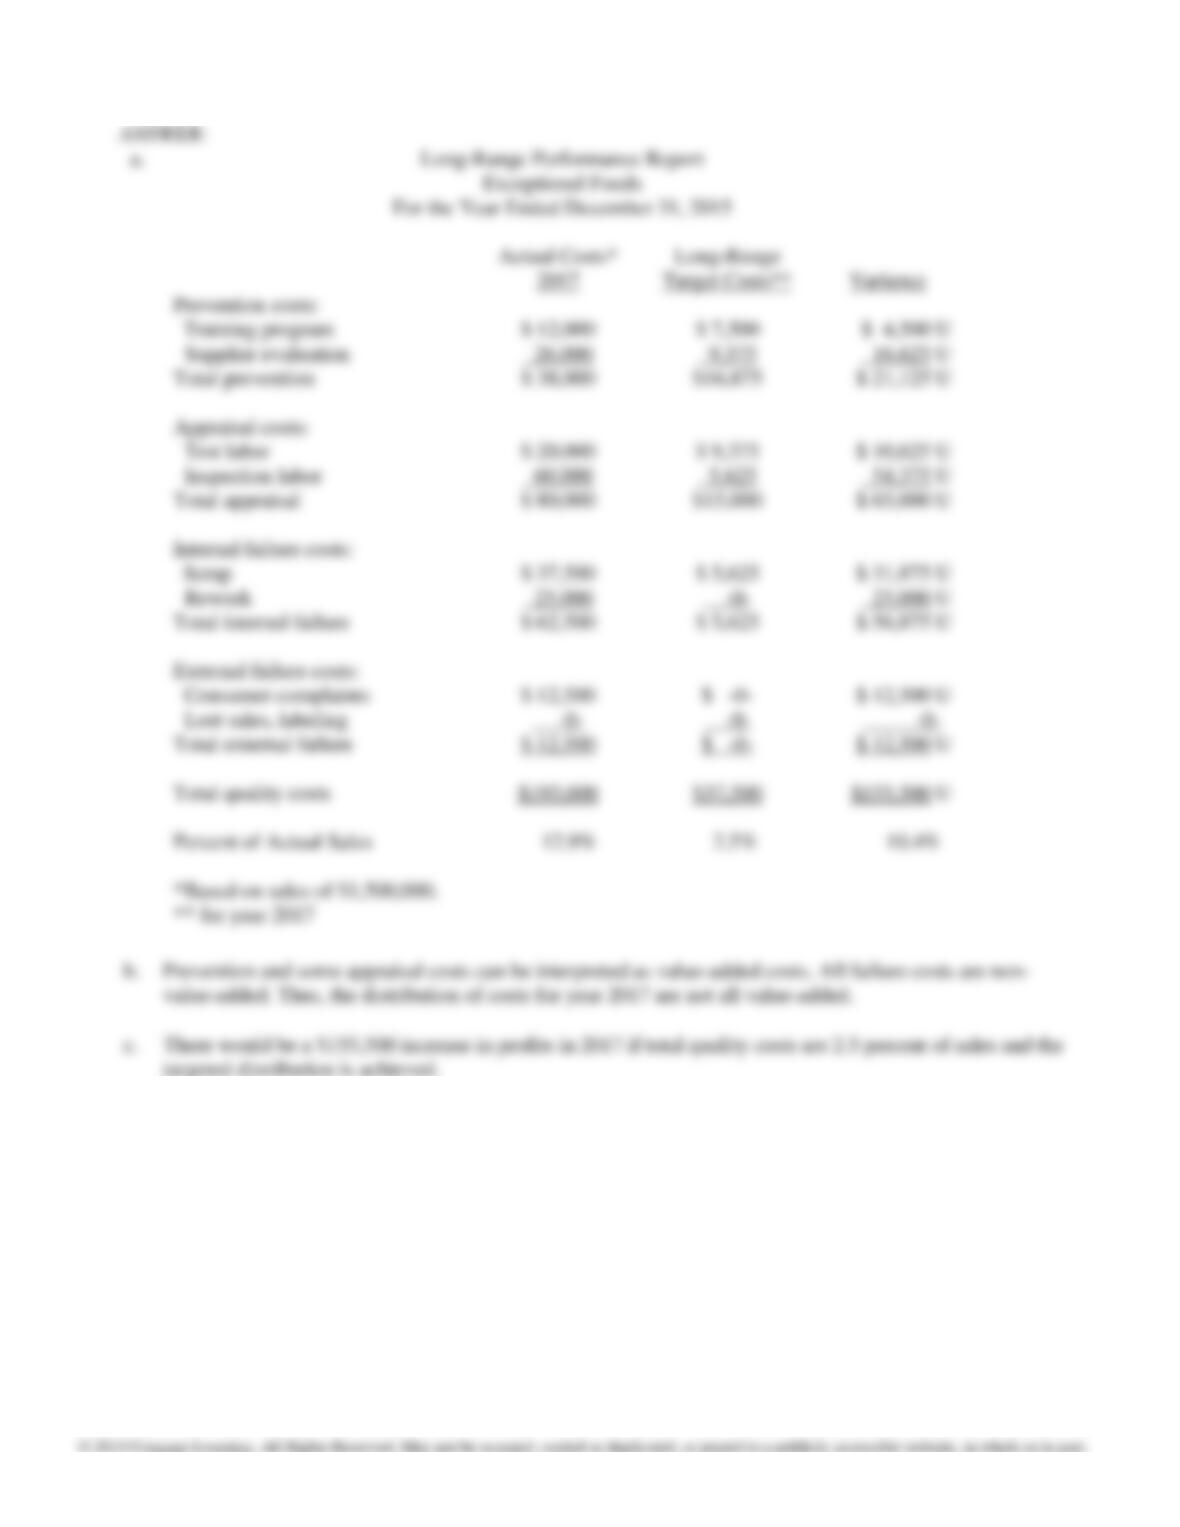
a. 100%
b. 10%
c. 80%
d. 1,000%
Chapter 14: Quality and Environmental Cost Management
Figure 14-9
As part of its environmental cost reporting system, Lamborghini Company tracks its total environmental costs.
Consider the cost and sales data given:
Total
Year
Environmental Costs
Sales Revenue
Operating Costs
2014
$7,500,000
$62,500,000
$50,000,000
2015
6,250,000
62,500,000
$50,000,000
2016
5,500,000
68,750,000
$50,000,000
2017
4,812,500
68,750,000
$50,000,000
179. Refer to Figure 14-9. What is the environmental costs as a percentage of sales for 2016?
a. 12%
b. 15%
c. 80%
d. 8.33%
180. Refer to Figure 14-9. What is the environmental costs as a percentage of sales for 2017?
a. 100%
b. 10%
c. 80%
d. 1,000%
181. Refer to Figure 14-9. What is the environmental costs as a percentage of sales for 2018?
a. 12.5%
b. 1,250%
c. 8%
d. 72.73%
Chapter 14: Quality and Environmental Cost Management
182. Refer to Figure 14-9. What is the environmental costs as a percentage of sales for 2019?
a. 14.29%
b. 1428.57%
c. 72.73%
d. 7%
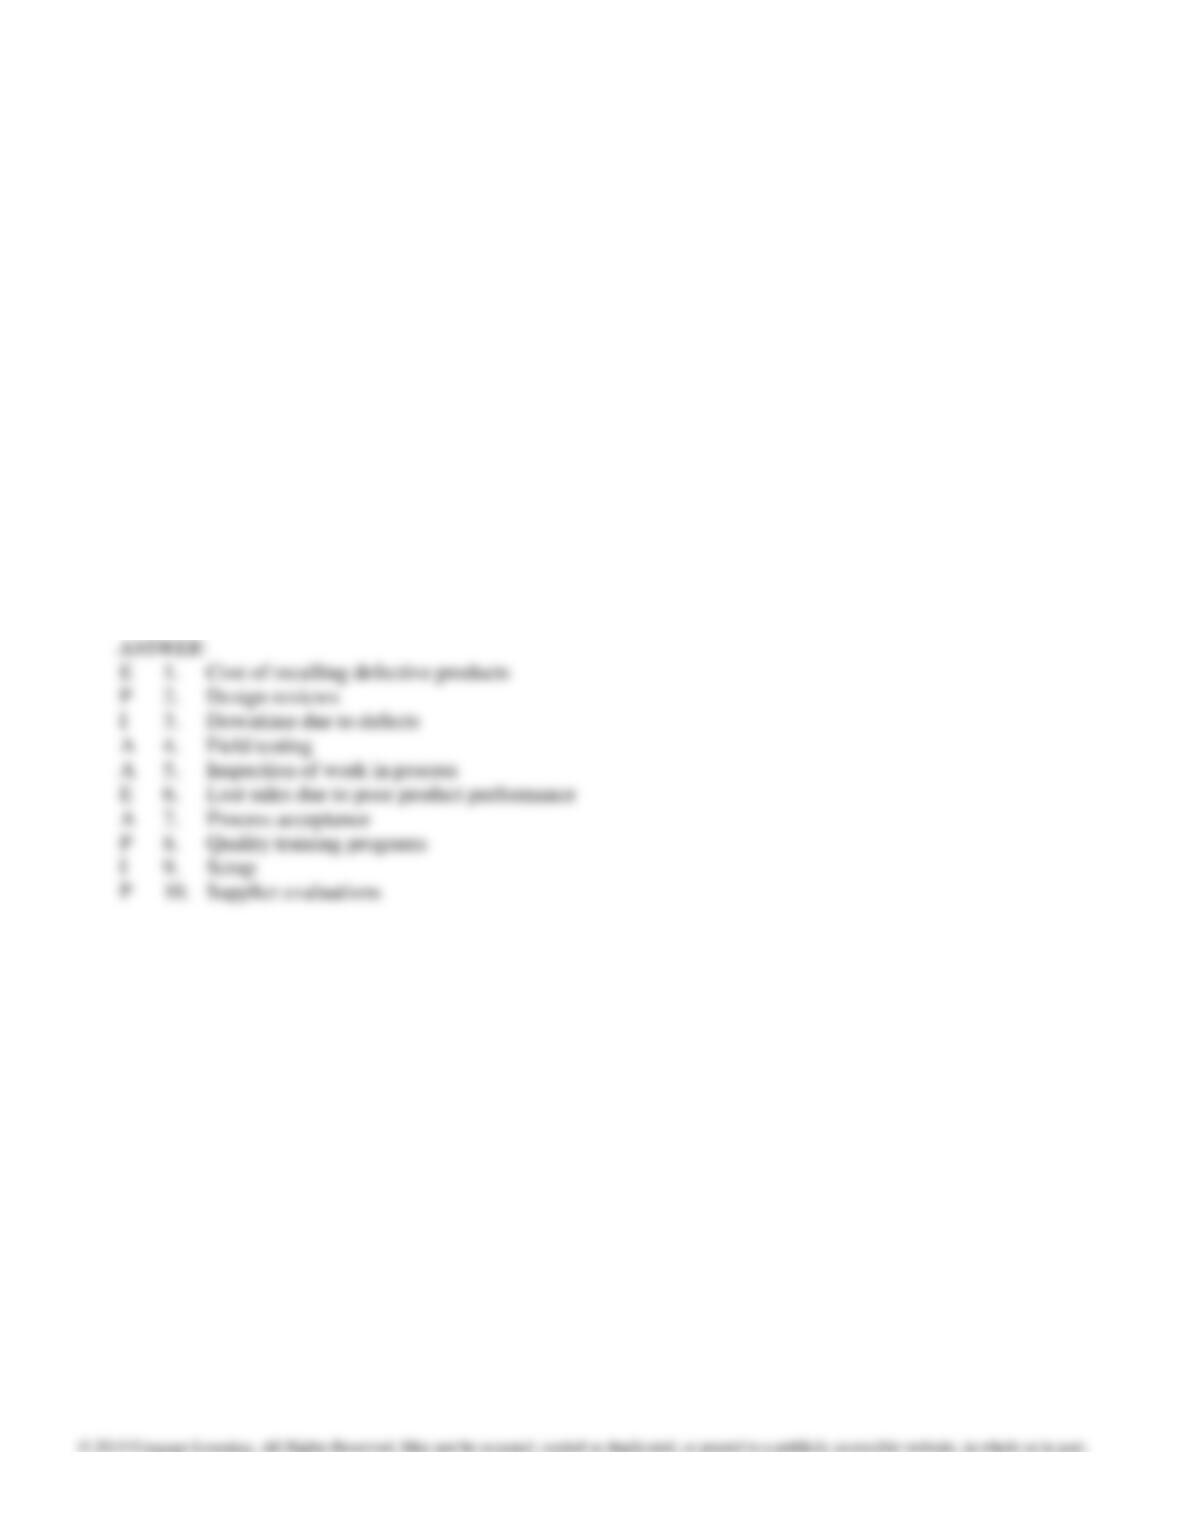
183. Using the abbreviations listed below, indicate for each of the costs whether the cost should be classified as:
P
=
Prevention
A
=
Appraisal
I
=
Internal Failure
E
=
External Failure
N
=
none of the above
1. Packaging inspections
2. Process acceptance
3. Product acceptance
4. Quality audits
5. Quality circles
6. Reinspection after defect is corrected
7. Returns resulting from poor quality
8. Rework costs
9. Supplier evaluations
10. Warranty costs
184. What does quality mean and how has improving quality increased firm value?
Chapter 14: Quality and Environmental Cost Management
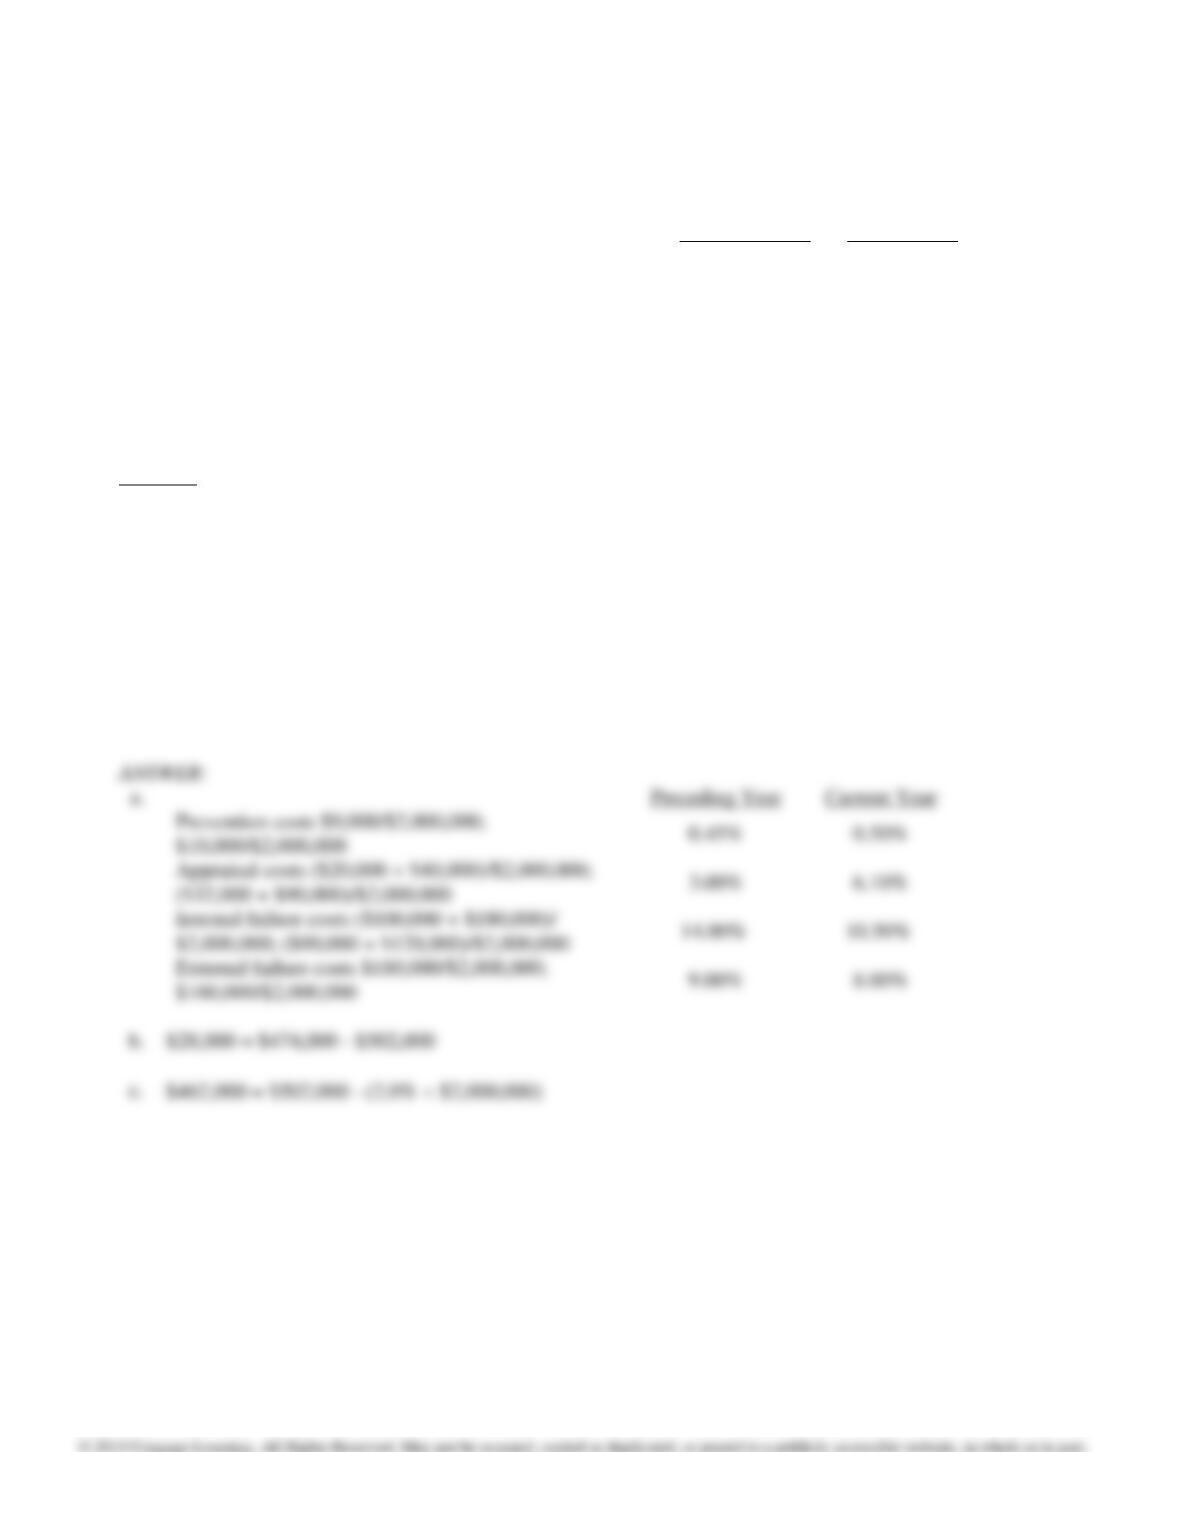
185. Using the abbreviations listed below, indicate for each of the costs whether the cost should be classified as:
P
A
I
E
N
=
=
=
=
=
Prevention
Appraisal
Internal Failure
External
Failure
none of the above
1.
Cost of recalling defective products
2.
Design reviews
3.
Downtime due to defects
4.
Field testing
5.
Inspection of work in process
6.
Lost sales due to poor product performance
7.
Process acceptance
8.
Quality training programs
9.
Scrap
10.
Supplier evaluations
Chapter 14: Quality and Environmental Cost Management
186. At the beginning of the year, Nevermore, Inc., initiated a quality improvement program. The program was
successful in reducing scrap and rework costs. To help assess the impact of the quality improvement program, the
following data were collected for the current and preceding years:
Preceding Year
Current Year
Sales
$2,000,000
$2,000,000
Quality circles
9,000
10,000
Packaging inspections
20,000
32,000
Scrap
100,000
90,000
Lost sales
180,000
160,000
Downtime
125,000
120,000
Product inspection
40,000
90,000
Required:
a. Compute each category of quality costs as a percentage of sales for each year.
Prevention costs
Appraisal costs Internal
failure costs External
failure costs
b. How much has profit increased as a result of quality improvements?
c. If quality costs can be reduced to 2.0 percent of sales, how much additional profit would result?
$10,000/$2,000,000
Chapter 14: Quality and Environmental Cost Management
187. Within the robust view of strategy, describe the management strategy to reduce quality costs recommended by the
American Society for Quality Control.
188. Ambrosia Corporation reported the following sales and quality costs for the past four years. Assume that all
quality costs are variable and that all changes in the quality cost ratios are due to a quality improvement program.
Quality Costs as
Year
Sales Revenues
Percent of Revenues
1
$2,000,000
23.0%
2
2,200,000
20.0%
3
2,200,000
16.0%
4
Required:
2,400,000
12.0%
a. Compute the quality costs for all four years.
b. How much did net income increase from Year 1 to Year 2 because of quality improvements?
From Year 2 to Year 3? From Year 3 to Year 4?
c. The management of Ambrosia Corporation believes it is possible to reduce quality costs to 2.5
percent of sales. Assuming sales will continue at the Year 4 level, calculate the additional
profit potential facing Randall.
Chapter 14: Quality and Environmental Cost Management
189. At the beginning of the year, Randy Company initiated a quality improvement program. The program was
successful in reducing scrap and rework costs. To help assess the impact of the quality improvement program, the
following data were collected for the current and preceding years:
Preceding Year
Current Year
Sales
$5,000,000
$5,000,000
Quality training
6,000
9,000
Material inspections
15,000
12,000
Scrap
80,000
60,000
Rework
15,000
12,000
Product inspection
25,000
30,000
Product warranty
Required:
150,000
120,000
a. Compute each category of quality costs as a percentage of sales for each year.
Prevention costs
Appraisal costs Internal
failure costs External
failure costs
b. How much has profit increased as a result of quality improvements?
c. If quality costs can be reduced to 2.5 percent of sales, how much additional profit would result?
Prevention costs
Appraisal costs
Internal failure costs
Chapter 14: Quality and Environmental Cost Management
190. At the beginning of the year, Custom Choppers Company initiated a quality improvement program. The program
was successful in reducing scrap and rework costs. To help assess the impact of the quality improvement program,
the following data were collected for the current and preceding years:
Preceding Year
Current Year
Sales
$5,000,000
$5,000,000
Quality training
22,500
25,000
Material inspections
50,000
80,000
Scrap
250,000
225,000
Product warranty
450,000
400,000
Rework
375,000
300,000
Product inspection
Required:
100,000
100,000
a. Compute each category of quality costs as a percentage of sales for each year.
Prevention costs
Appraisal costs
Internal failure costs
External failure costs
b. How much has profit increased as a result of quality improvements?
c. If quality costs can be reduced to 2.5 percent of sales, how much additional profit would result?
Chapter 14: Quality and Environmental Cost Management
191. The following information pertains to Bartolo Company for 2016:
Sales
$12,000,000
Internal failure costs
400,000
External failure costs
300,000
Appraisal costs
225,000
Prevention costs
150,000
Cost of goods sold
6,500,000
Required:
Calculate by how much profits would increase if quality costs were reduced to 2.0 percent of sales.
192. In 2016, Exceptional Foods instituted a quality improvement program. At the end of 2017, the management of the
corporation requested a report to show the amount saved by the measures taken during the year. The actual sales
and actual quality costs for 2016 and 2017 are as follows:
2016
2017
Sales
$1,000,000
$1,500,000
Scrap
30,000
37,500
Rework
40,000
25,000
Training program
10,000
12,000
Consumer complaints
20,000
12,500
Lost sales, incorrect labeling
16,000
—
Test labor
24,000
20,000
Inspection labor
50,000
60,000
Supplier evaluation
30,000
26,000
Exceptional’s management believes that quality costs can be reduced to 2.5 percent of sales within the next five
years. At the end of Year 2017, Exceptional’s sales are projected to have grown to $1,500,000. The relative
distribution of quality costs at the end of Year 2017 is as follows:
Scrap
15%
Training
20%
Supplier evaluation
25%
Test labor
25%
Inspection
15%
Total quality costs
100%
Required:
a. Prepare a long-range performance report that compares the quality costs incurred at the end of
2017 with the quality-cost structure expected at the end of 2020.
b. Are the targeted costs in Year 2017 all value-added costs?
c. What would be the increase in profits in 2017 if the 2.5 percent performance standard is met in
that year?
Chapter 14: Quality and Environmental Cost Management