Chapter 14 – Financial Statement Analysis
121. The following information pertains to Newman Company. Assume that all balance sheet amounts represent both
average and ending balance figures and that all sales were on credit.
Assets
Cash and short-term investments
$ 40,000
Accounts receivable (net)
30,000
Inventory
25,000
Property, plant, and equipment
215,000
Total Assets
$310,000
Liabilities and Stockholders’ Equity
Current liabilities
$ 60,000
Long-term liabilities
95,000
Stockholders’ equity—Common
155,000
Total liabilities and stockholders’ equity
$310,000
Income Statement
Sales
$90,000
Cost of goods sold
45,000
Gross margin
$45,000
Operating expenses
20,000
Net income
$25,000
Number of shares of common stock
6,000
Market price of common stock
$40
Dividends per share
$1.00
Cash provided by operations
$40,000
What is the return on total assets for this company?
a.
8.1%
b.
6.8%
c.
10.5%
d.
16.1%

Chapter 14 – Financial Statement Analysis
122. The following information pertains to Dallas Company. Assume that all balance sheet amounts represent both
average and ending balance figures and that all sales were on credit.
Assets
Cash and short-term investments
$ 40,000
Accounts receivable (net)
30,000
Inventory
25,000
Property, plant, and equipment
280,000
Total assets
$375,000
Liabilities and Stockholders’ Equity
Current liabilities
$ 60,000
Long-term liabilities
95,000
Stockholders’ equity—Common
220,000
Total liabilities and stockholders’ equity
$375,000
Income Statement
Sales
$90,000
Cost of goods sold
45,000
Gross margin
$45,000
Operating expenses
15,000
Net income
$30,000
Number of shares of common stock
6,000
Market price of common stock
$20
Dividends per share
$1.00
Cash provided by operations
$40,000
What is the return on stockholders’ equity?
a.
7.3%
b.
13.6%
c.
20.5%
d.
40.9%
Chapter 14 – Financial Statement Analysis
123. A company reports the following:
Net income
$160,000
Preferred dividends
$10,000
Shares of common stock outstanding
20,000
Market price per share of common stock
$35
The company’s earnings per share on common stock is
a.
$13.33
b.
$8.50
c.
$7.50
d.
$35.00
124. Corporate annual reports typically do not contain
a.
management discussion and analysis
b.
an SEC statement expressing an opinion
c.
accompanying notes
d.
an auditor’s report
125. The independent auditor’s report
a.
describes which financial statements are covered by the audit
b.
gives the auditor’s opinion regarding the fairness of the financial statements
c.
summarizes what the auditor did
d.
states that the financial statements were presented on time
Chapter 14 – Financial Statement Analysis
126. The purpose of an audit is to
a.
determine whether or not a company is a good investment
b.
render an opinion on the fairness of the statements
c.
determine whether or not a company complies with corporate social responsibility
d.
determine whether or not a company is a good credit risk
127. Which of the following is required by the Sarbanes-Oxley Act?
a.
a price-earnings ratio
b.
a report on internal control
c.
a vertical analysis
d.
a common-sized statement
128. All of the following are typically included in the management’s discussion and analysis in annual reports except
a.
explanations of any significant changes between the current and prior years’ financial statements
b.
management’s assessment of liquidity
c.
journal entries
d.
off-balance-sheet arrangements
Chapter 14 – Financial Statement Analysis
129. Which of the following would appear as an unusual item on the income statement?
a.
loss resulting from the sale of fixed assets
b.
gain resulting from the disposal of a segment of the business
c.
presentation of earnings per share
d.
stock split
130. A loss on disposal of a segment would be reported in the income statement as a(n)
a.
administrative expense
b.
other expense
c.
deduction from income from continuing operations
d.
selling expense
131. Which of the following is not an unusual item?
a.
a segment of the business being sold
b.
corporate income tax being paid
c.
a change from one accounting method to another acceptable accounting method
d.
closure of all outlet stores
Chapter 14 – Financial Statement Analysis
132. Which of the following is considered an unusual item affecting the prior period’s income statement?
a.
a change in accounting principles
b.
fixed asset impairments
c.
sale of company stores in Florida
d.
discontinued operations
133. A loss due to a discontinued operation should be reported on the income statement
a.
above income from continuing operations
b.
without related tax effect
c.
below income from continuing operations
d.
as an operating expense
134. A change from one acceptable accounting method to another is reported
a.
on the statement of retained earnings, as a correction to the beginning balance
b.
on the income statement, below income from continuing operations
c.
on the income statement, above income tax expense
d.
through a retroactive restatement of prior-period earnings
Chapter 14 – Financial Statement Analysis
135. Which of the following items should be classified as an unusual item on an income statement?
a.
gain on the retirement of a bond payable
b.
gain on a sale of a long-term investment
c.
loss due to a discontinued operation in Colorado
d.
selling treasury stock for more than the company paid for it
136. Which of the following items appear on the corporate income statement before income from continuing operations?
a.
cumulative effect of a change in accounting principle
b.
income tax expense
c.
presentation of earnings per share
d.
loss on discontinued operations
137. The price-earnings ratio on common stock is calculated as:
a.
market price per share of common stock, divided by earnings per share on common stock.
b.
earnings per share of common stock, divided by market price per share of common stock.
c.
market price per share of common stock, divided by dividends per share of common stock.
d.
dividends per share of common stock, divided by earnings per share on common stock.
138. Dividend yield on common stock is calculated as:
a.
dividends on common stock, divided by shares of common stock outstanding.
b.
net income minus preferred dividends, divided by shares of common stock outstanding.
c.
dividends per share of common stock, divided by earnings per share.
d.
dividends per share of common stock, divided by market price per share of common stock.
Chapter 14 – Financial Statement Analysis
139. Select the correct presentation for other comprehensive income on the financial statements of Puma Company.
a.
Puma Company
Income Statement
For the Year Ended December 31, 20Y3
Sales
$625,000
Cost of goods sold
350,000
Gross profit
$275,000
Operating expenses
135,000
Net income
$140,000
Other comprehensive income
20,000
Comprehensive income
$160,000
b.
Puma Company
Statement of Comprehensive Income
For the Year Ended December 31, 20Y3
Net income
$140,000
Other comprehensive income
20,000
Comprehensive income
$160,000
c.
Both are correct
d.
Neither is correct
140. Manx Company owns one investment, purchased several years ago for $20,000. As of the end of the year two years
ago, the investment had increased in value to $26,000. As of the end of the current year, the investment had decreased
somewhat in value, to $24,000. Manx anticipates selling the investment in the coming year and expects to receive
$28,000. Under fair value accounting, what would be the value of the investments account on the current year’s
December 31 balance sheet?
a.
$24,000
b.
$20,000
c.
$26,000
d.
$28,000
Chapter 14 – Financial Statement Analysis
(current) value at the balance sheet date.
141. Accumulated other comprehensive income is presented in the financial statements:
a.
either on the income statement or in a separate statement of comprehensive income.
b.
on the balance sheet as part of stockholders’ equity.
c.
on the income statement only.
d.
in a separate statement only.
comprehensive income.
FNMN.WARR.17.14-APP2 – LO: 14–APP2
BUSPROG – Analytic
Match each definition that follows with the term (a–h) it defines.
a.
solvency
b.
leverage
c.
times interest earned
d.
horizontal analysis
e.
vertical analysis
f.
common-sized financial statements
g.
current position analysis
h.
profitability analysis
DIFFICULTY:
Bloom’s: Remembering
Easy
LEARNING OBJECTIVES:
FNMN.WARD.17.14-01 – LO: 14–01
FNMN.WARD.17.14-02 – LO: 14–02
FNMN.WARD.17.14-03 – LO: 14–03
FNMN.WARD.17.14-04 – LO: 14–04
FNMN.WARD.17.14-05 – LO: 14–05
ACCREDITING STANDARDS:
ACCT.ACBSP.APC.02 – GAAP
ACCT.ACBSP.APC.23 – Financial Statement Analysis
ACCT.AICPA.FN.03 – Measurement
BUSPROG: Analytic
Chapter 14 – Financial Statement Analysis
142. a percentage analysis of increases and decreases in related items on comparative financial statements
143. use debt to increase the return on an investment
144. an analysis of a company’s ability to pay its current liabilities
145. the percentage analysis of the relationship of each component in a financial statement to a total within the statement
146. a company’s ability to make interest payments and repay debt at maturity
147. focuses on a company’s ability to generate net income
148. useful for comparing one company to another or to industry averages
149. measures the risk that interest payments will not be made if earnings decrease
Match each ratio that follows to its use (items a–h). Items may be used more than once.
a.
assess the profitability of the assets
b.
assess how effectively assets are used
c.
indicate the ability to pay current liabilities
d.
indicate how much of the company is financed by debt and equity
e.
indicate instant debt-paying ability
f.
assess the profitability of the investment by common stockholders
g.
indicate future earnings prospects
h.
indicate the extent to which earnings are being distributed to common stockholders
DIFFICULTY:
Bloom’s: Remembering
Moderate
LEARNING OBJECTIVES:
FNMN.WARD.17.14-03 – LO: 14–03
FNMN.WARD.17.14-04 – LO: 14–04
FNMN.WARD.17.14-05 – LO: 14–05
ACCREDITING STANDARDS:
ACCT.ACBSP.APC.23 – Financial Statement Analysis
ACCT.AICPA.FN.03 – Measurement
BUSPROG: Analytic
150. price-earnings (P/E) ratio
151. working capital
Chapter 14 – Financial Statement Analysis
152. return on total assets
153. ratio of liabilities to stockholders’ equity
154. quick ratio
155. return on common stockholders’ equity
156. current ratio
157. asset turnover ratio
158. dividends per share
159. earnings per share (EPS) on common stock
160. Cash and accounts receivable for Adams Company are provided below:
Current Year
Prior Year
Cash
$70,000
$50,000
Accounts receivable (net)
70,400
80,000
What is the amount and percentage of increase or decrease that would be shown with horizontal analysis?
Cash
$20,000 increase ($70,000 – $50,000) or 40%
Accounts receivable
$9,600 decrease ($80,000 – $70,400) or (12%)
Chapter 14 – Financial Statement Analysis
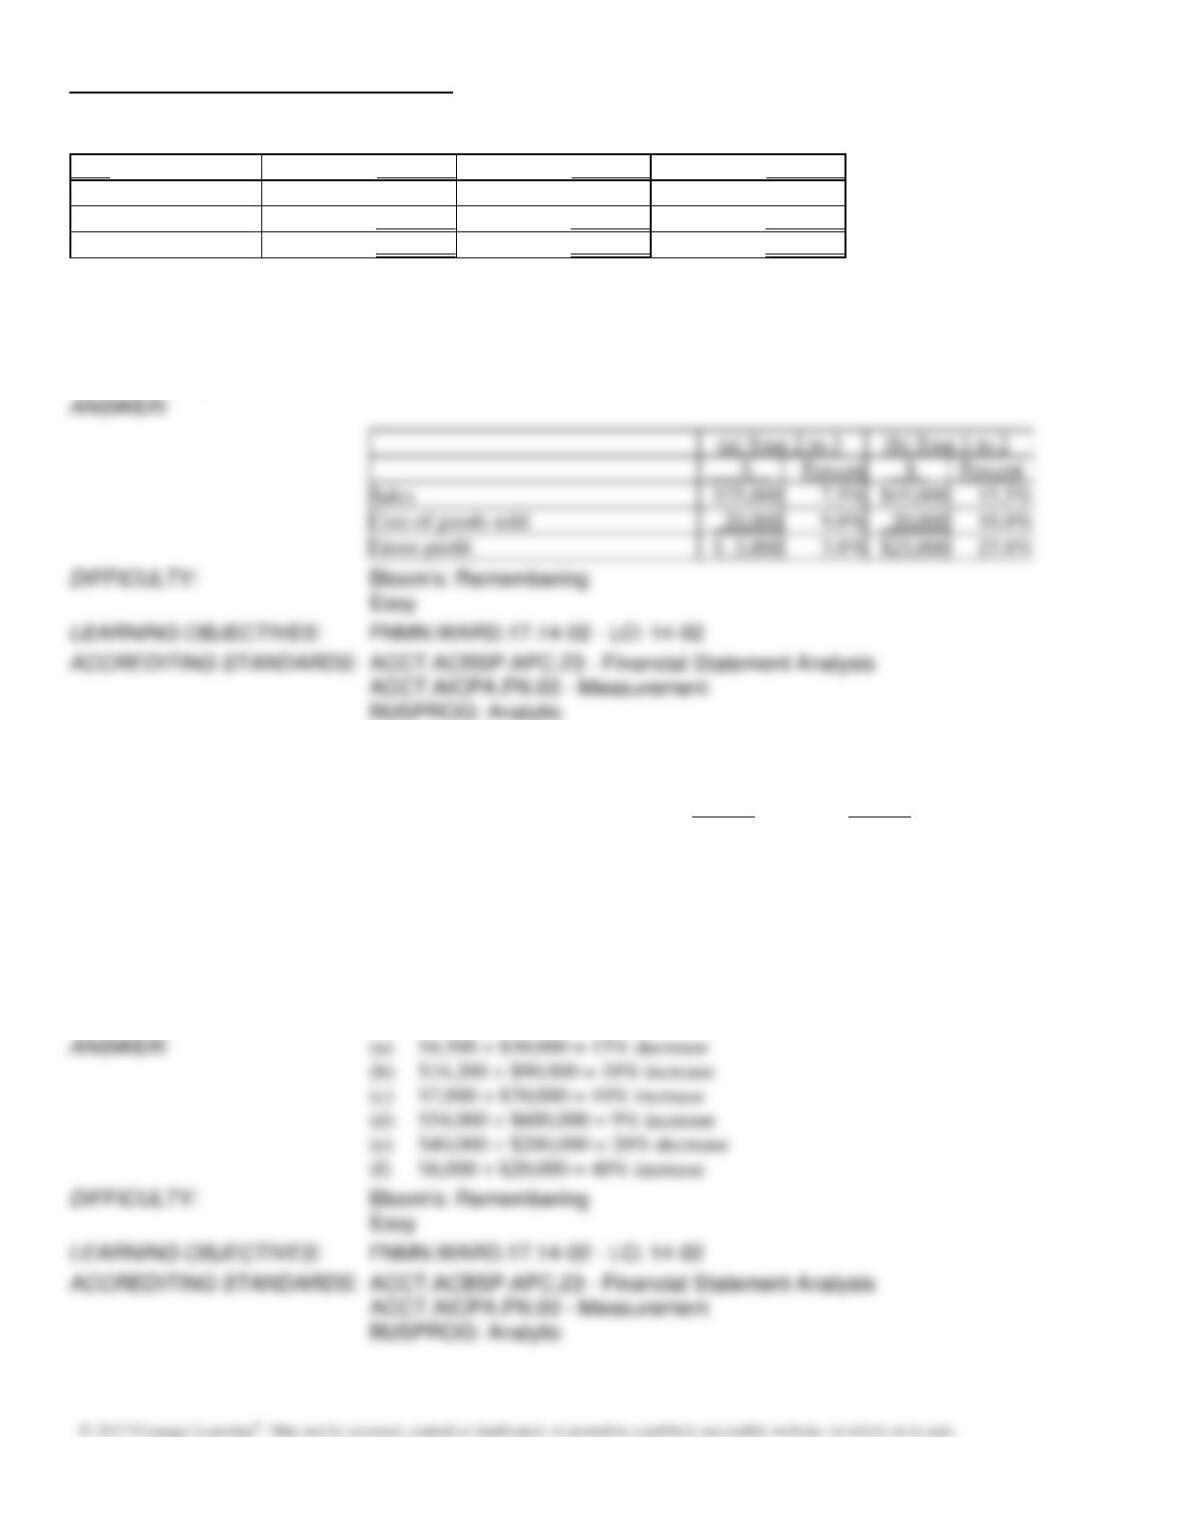
161. The following items were taken from the financial statements of Tilden, Inc., over a three-year period:
Item
Year 3
Year 2
Year 1
Sales
$360,000
$335,000
$290,000
Cost of goods sold
225,000
205,000
185,000
Gross profit
$135,000
$130,000
$105,000
Compute the following for each of the items listed.
(a)
The amount and percentage change from Year 2 to Year 3.
(b)
The amount and percentage change from Year 1 to Year 2.
Round percentages to one decimal place.
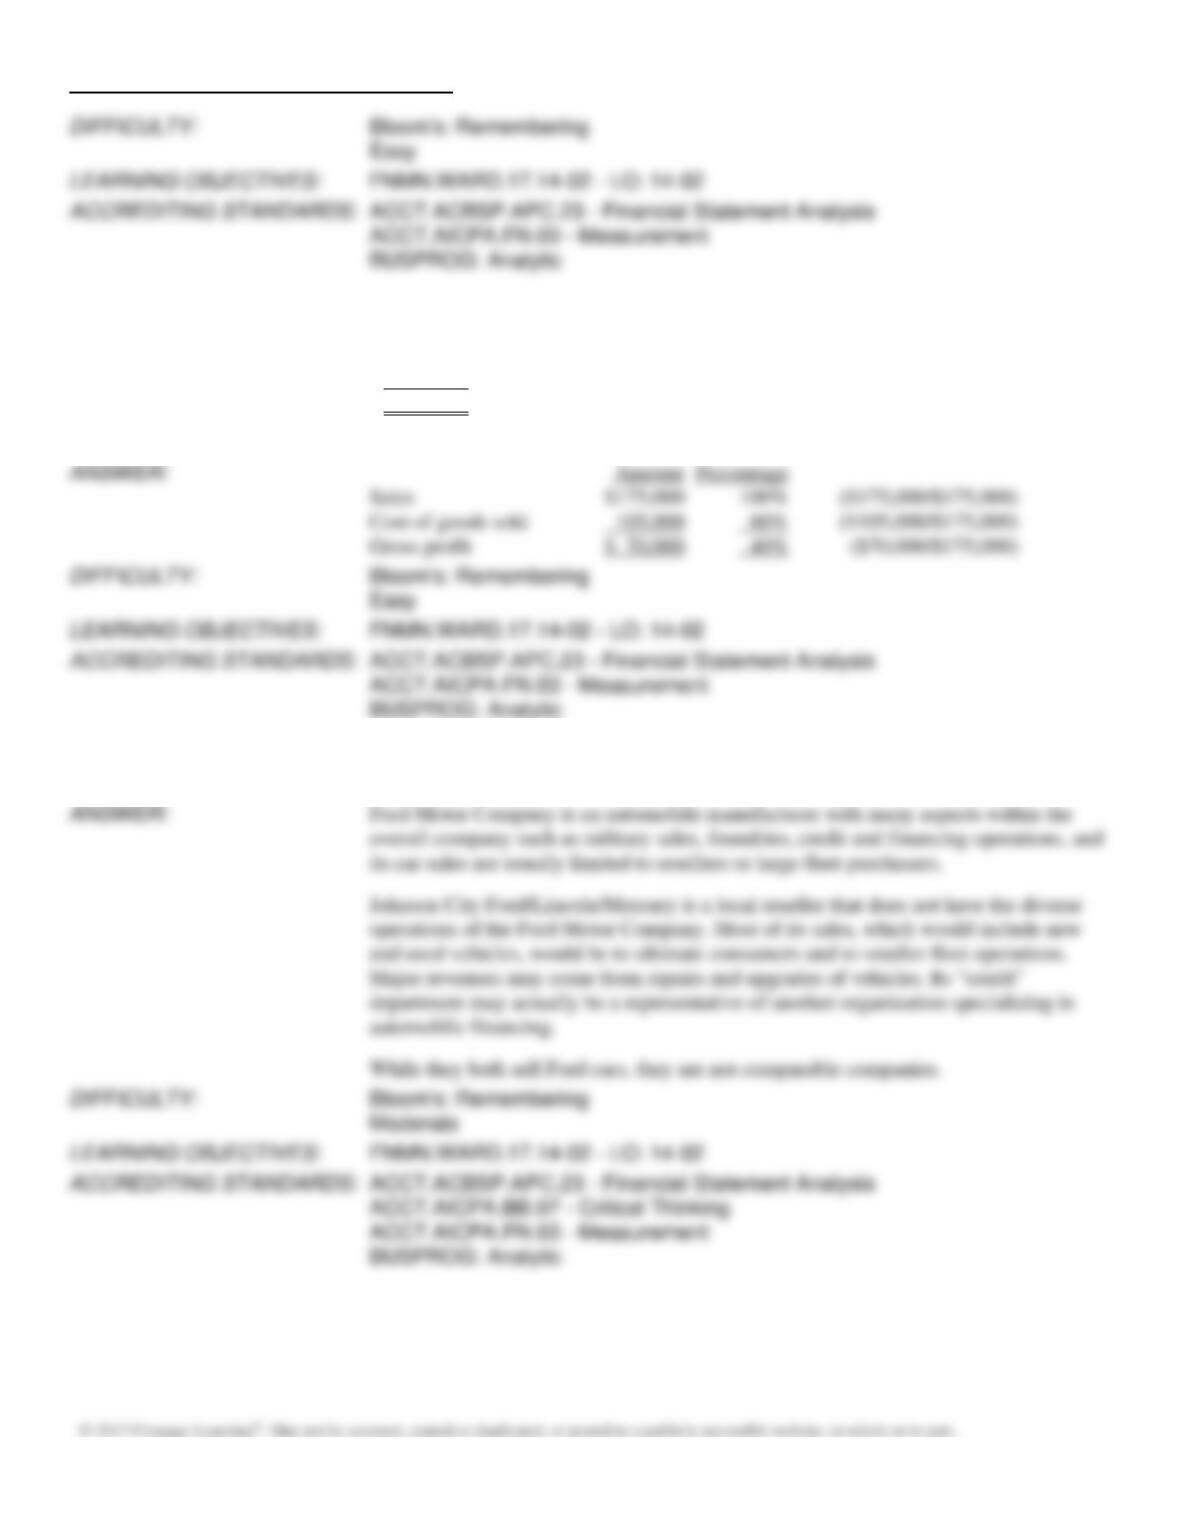
Sales
Cost of goods sold
Gross profit
162. Comparative information taken from the Friction Company’s financial statements is shown below:
Year 2
Year 1
(a)
Notes receivable
$ 25,500
$ 30,000
(b)
Accounts receivable
106,200
90,000
(c)
Retained earnings
77,000
70,000
(d)
Sales
654,000
600,000
(e)
Operating expenses
160,000
200,000
(f)
Income taxes payable
28,000
20,000
Using horizontal analysis, show the percentage change and direction (increase or decrease) from Year 1 to Year 2 with
Year 1 as the base year.
(a)
$4,500 ÷ $30,000 = 15% decrease
(b)
$16,200 ÷ $90,000 = 18% increase
(c)
$7,000 ÷ $70,000 = 10% increase
(d)
$54,000 ÷ $600,000 = 9% increase
(e)
$40,000 ÷ $200,000 = 20% decrease
(f)
$8,000 ÷ $20,000 = 40% increase
Chapter 14 – Financial Statement Analysis
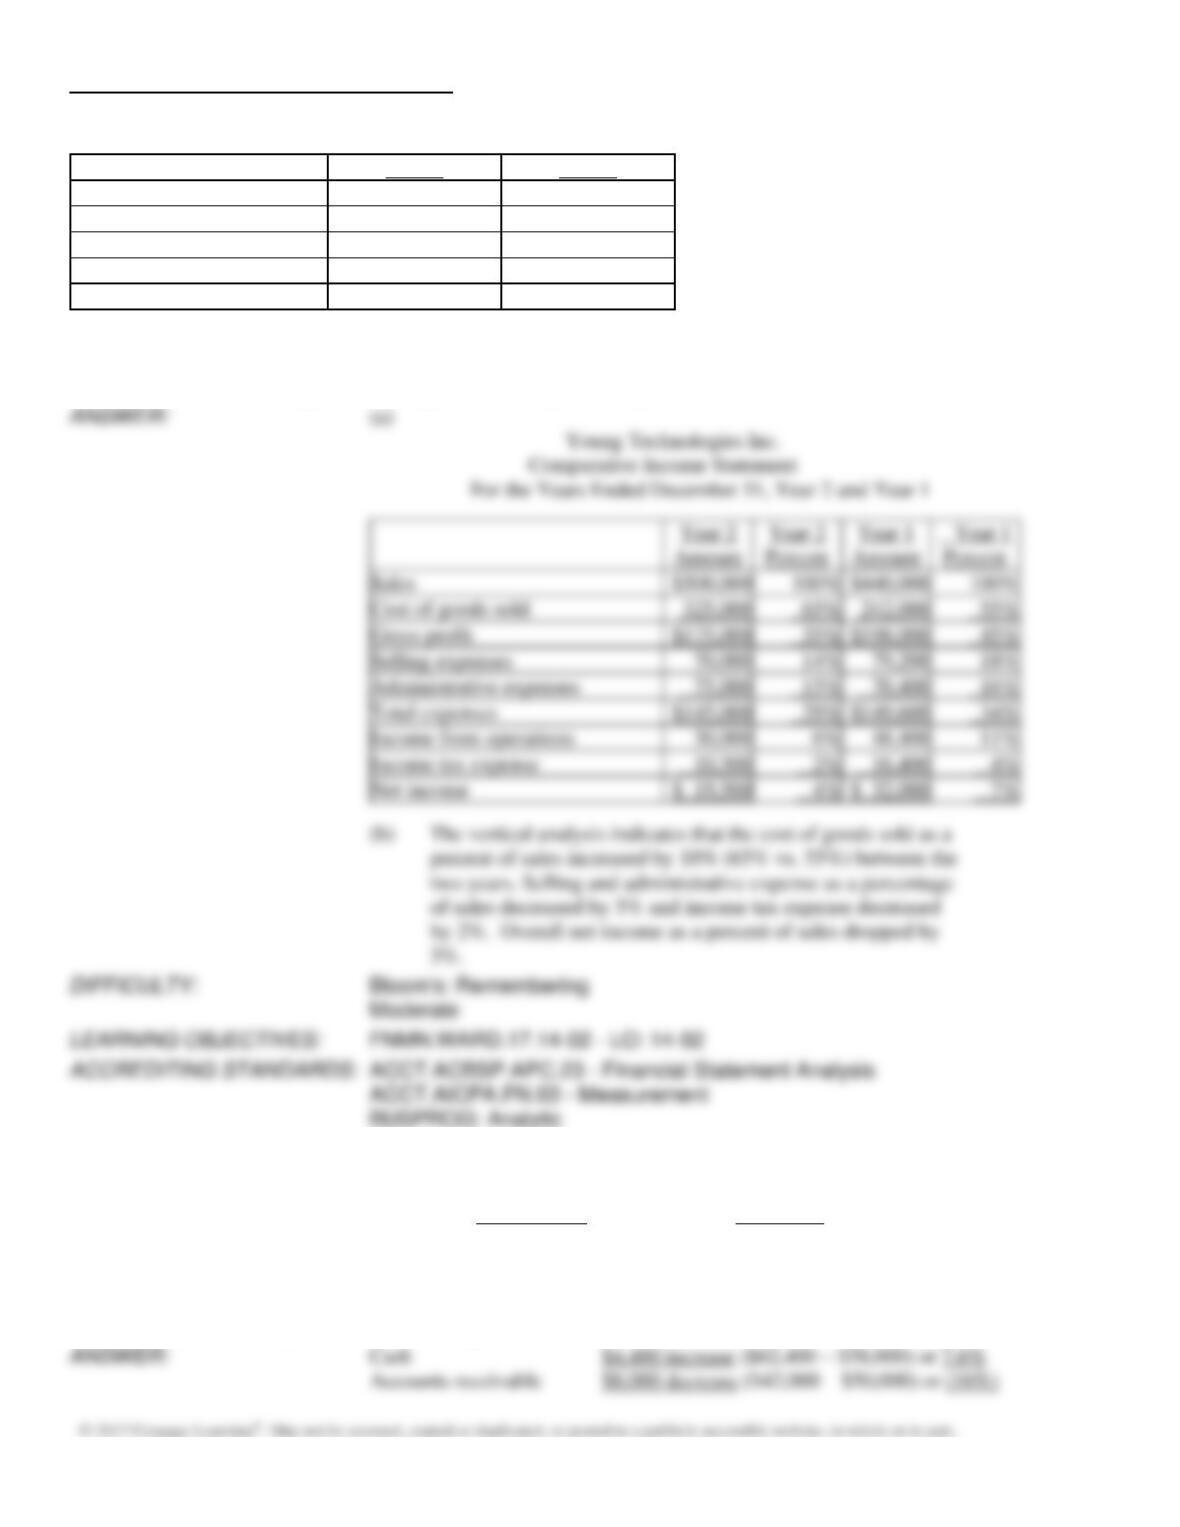
163. Revenue and expense data for Young Technologies Inc. are as follows:
Year 2
Year 1
Sales
$500,000
$440,000
Cost of goods sold
325,000
242,000
Selling expenses
70,000
79,200
Administrative expenses
75,000
70,400
Income tax expense
10,500
16,400
(a)
Prepare an income statement in comparative form, stating each item for both years as an
amount and as a percent of sales. Round to the nearest whole percent.
(b)
Comment on the significant changes disclosed by the comparative income statement.
Sales
Cost of goods sold
Gross profit
Selling expenses
Administrative expenses
Total expenses
Income from operations
Income tax expense
3%.
164. Cash and accounts receivable for Ashfall Co. are provided below:
Current Year
Prior Year
Cash
$62,400
$58,000
Accounts receivable (net)
42,000
50,000
Based on this information, what is the amount and percentage of increase or decrease that would be shown on a balance
sheet with horizontal analysis? Round percentages to one decimal place.
Cash
$4,400 increase ($62,400 – $58,000) or 7.6%
Accounts receivable
$8,000 decrease ($42,000 – $50,000) or (16%)
Chapter 14 – Financial Statement Analysis
165. Income statement information for Lucy Company is provided below:
Sales
$175,000
Cost of goods sold
105,000
Gross profit
$ 70,000
Prepare a vertical analysis of the income statement for Lucy Company.
Sales
Cost of goods sold
Gross profit
166. Why would you or why wouldn’t you compare an organization like Ford Motor Company to the local car dealer
“Johnson City Ford/Lincoln/Mercury” using vertical and horizontal analysis?
While they both sell Ford cars, they are not comparable companies.
Chapter 14 – Financial Statement Analysis
167. The balance sheet data of Randolph Company for two recent years appears below:
Assets:
Year 2
Year 1
Current assets
$ 445
$280
Plant assets
680
520
Total assets
$1,125
$800
Liabilities and stockholders’
equity:
Current liabilities
$ 285
$120
Long-term debt
255
160
Common stock
325
320
Retained earnings
260
200
Total liabilities and
stockholders’ equity
$1,125
$800
(a)
Using horizontal analysis, show the percentage change for each balance sheet item
using Year 1 as a base year.
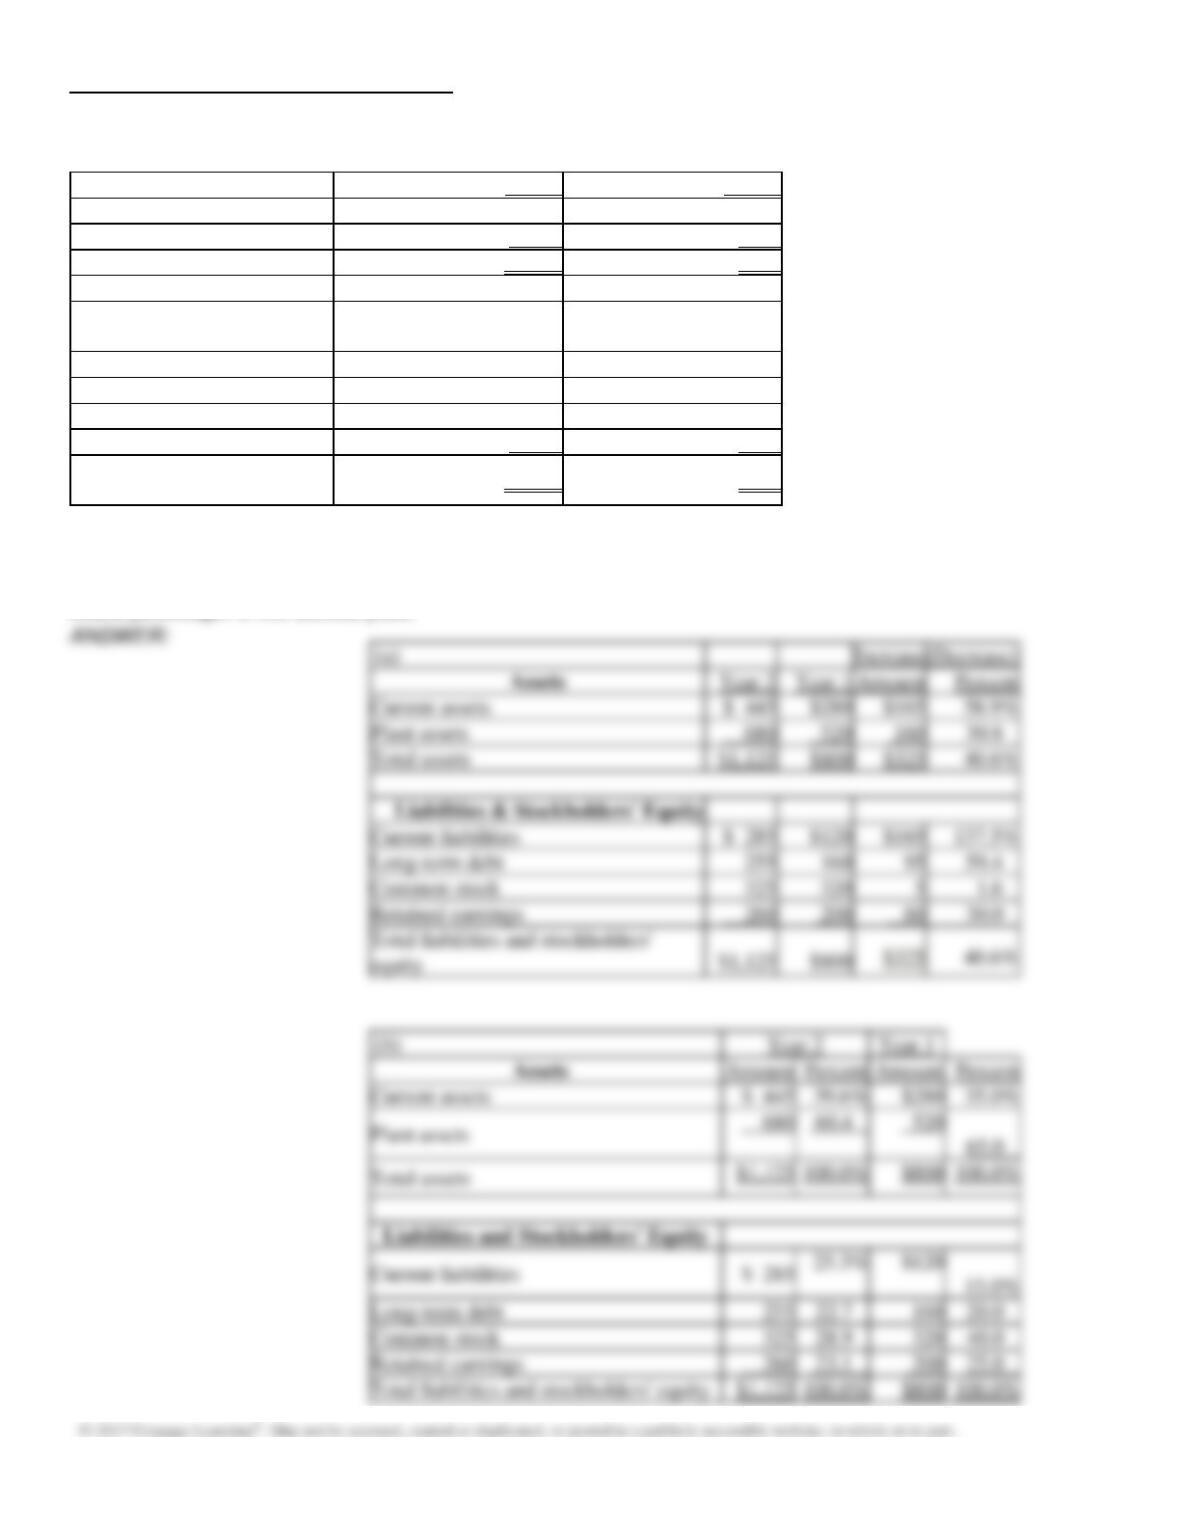
(b)
Using vertical analysis, prepare a comparative balance sheet.
Round percentages to one decimal place.
(a)
(Decrease)
Current assets
Plant assets
Total assets
Current liabilities
Long-term debt
Common stock
Retained earnings
Total liabilities and stockholders’
(b)
Current assets
Long-term debt
Common stock
Retained earnings
Total liabilities and stockholders’ equity
Chapter 14 – Financial Statement Analysis
168. Condensed data taken from the ledger of St. Louis Company at December 31, for the current and preceding years, are
as follows:
Year 2
Year 1
Current assets
$160,000
$130,000
Property, plant, and equipment
450,000
400,000
Intangible assets
20,700
30,000
Current liabilities
70,000
80,000
Long-term liabilities
210,000
250,000
Common stock
225,000
150,000
Retained earnings
125,700
80,000
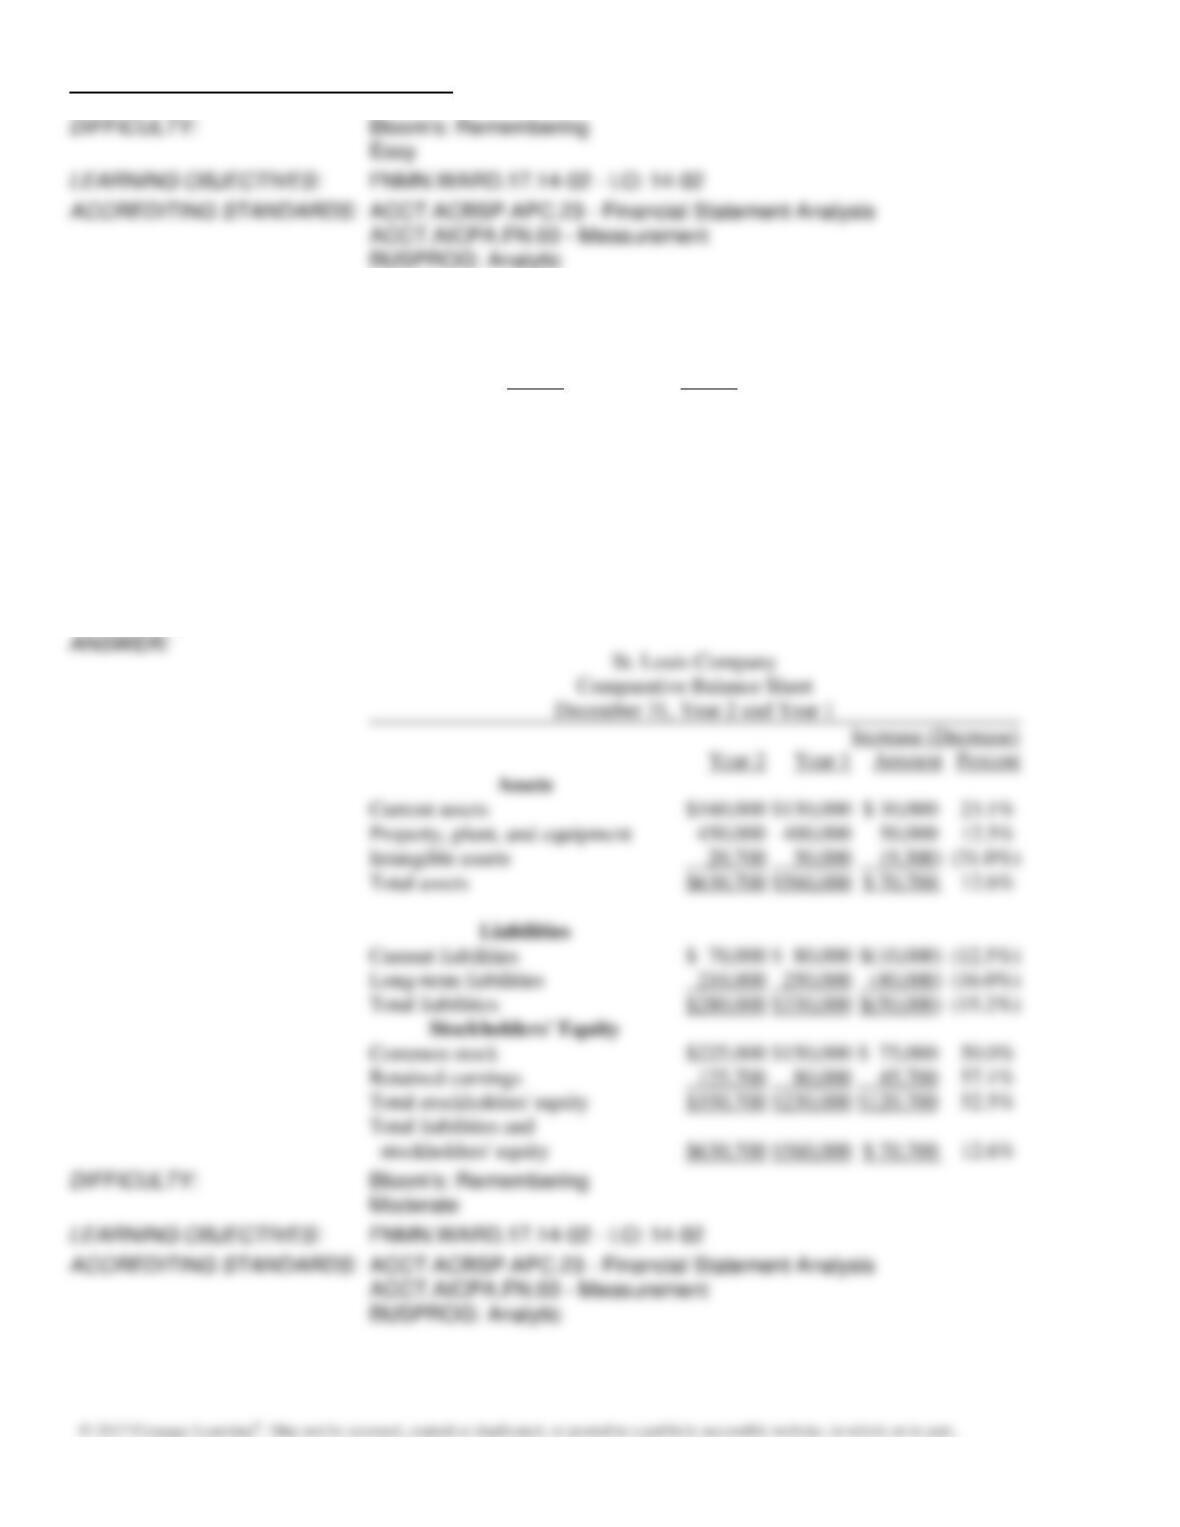
Prepare a comparative balance sheet, with horizontal analysis, for December 31, Year 2 and Year 1. (Round percents to
one decimal point.)
Increase (Decrease)
Current assets
Property, plant, and equipment
Intangible assets
Total assets
Current liabilities
Long-term liabilities
Total liabilities
Common stock
Retained earnings
Total stockholders’ equity
Total liabilities and
Chapter 14 – Financial Statement Analysis
169. Revenue and expense data for Bluestem Company are as follows:
Year 2
Year 1
Administrative expenses
$ 37,000
$ 20,000
Cost of goods sold
350,000
320,000
Income tax
40,000
32,000
Sales
800,000
700,000
Selling expenses
150,000
110,000
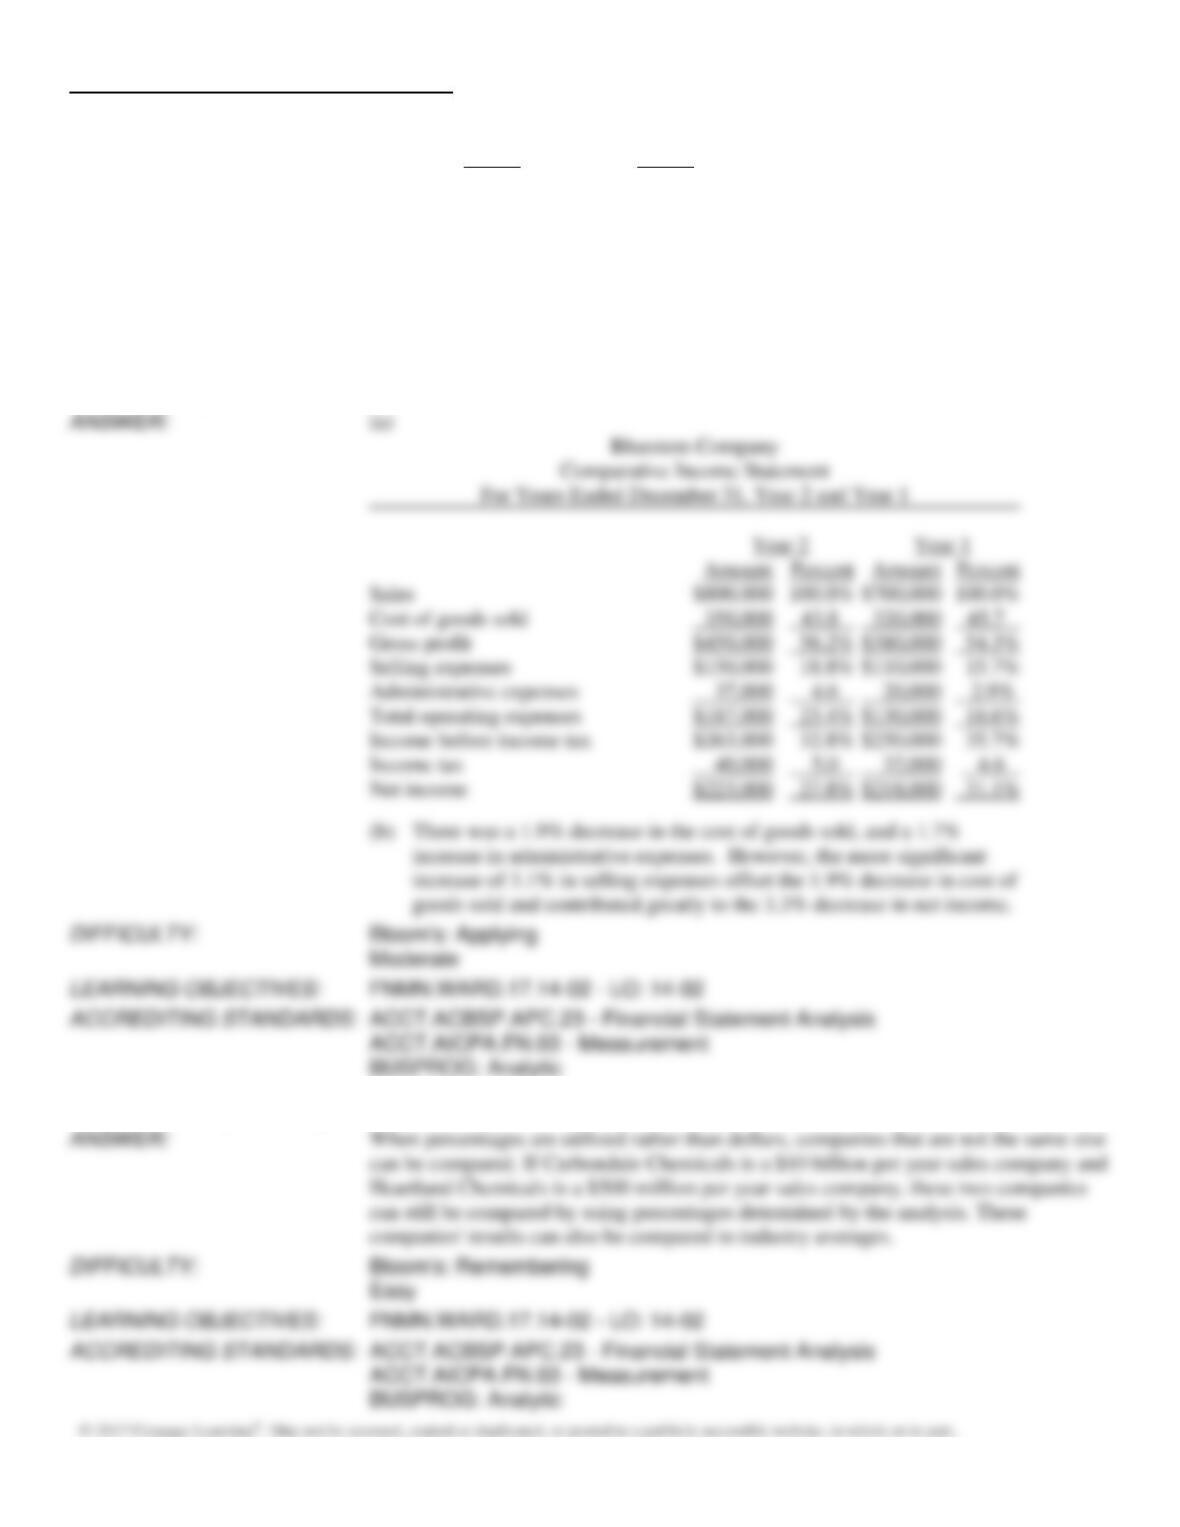
(a)
Prepare a comparative income statement, with vertical analysis, stating each item for both
years as a percent of sales.
(b)
Comment upon significant changes disclosed by the comparative income statement.
Round percentages to one decimal place.
Sales
Cost of goods sold
Gross profit
Selling expenses
Administrative expenses
Total operating expenses
Income before income tax
Income tax
170. What is a major advantage of using percentages rather than dollar changes in doing horizontal and vertical analysis?
Chapter 14 – Financial Statement Analysis
171. The following items are reported on a company’s balance sheet:
Cash
$230,000
Marketable securities
50,000
Accounts receivable
200,000
Inventory
240,000
Accounts payable
300,000
Determine the (a) current ratio, and (b) quick ratio. Round your answer to one decimal place.
Current ratio = ($230,000 + $50,000 + $200,000 + $240,000)/$300,000
Current ratio = 2.4
Quick ratio = ($230,000 + $50,000 + $200,000)/$300,000
Quick ratio = 1.6
172. The following items are reported on a company’s balance sheet:
Cash
$400,000
Marketable securities
50,000
Accounts receivable
150,000
Inventory
200,000
Accounts payable
250,000
Determine the (a) current ratio, and (b) quick ratio. Round your answer to one decimal place.
Current ratio = ($400,000 + $50,000 + $150,000 + $200,000)/$250,000
Current ratio = 3.2
Quick ratio = ($400,000 + $50,000 + $150,000)/$250,000
Quick ratio = 2.4
Chapter 14 – Financial Statement Analysis
173. The following items are reported on Denver Company’s balance sheet:
Cash
$190,000
Marketable securities
160,000
Accounts receivable (net)
240,000
Inventory
350,000
Accounts payable
600,000
Determine (a) the current ratio and (b) the quick ratio. Round to one decimal place.
(a)
Current ratio = Current assets ÷ Current liabilities
Current ratio = ($190,000 + $160,000 + $240,000 + $350,000) ÷ $600,000
Current ratio = 1.6
(b)
Quick ratio = Quick assets ÷ Current liabilities
Quick ratio = ($190,000 + $160,000 + $240,000) ÷ $600,000
Quick ratio = 1.0
174. For Garrison Corporation, the working capital at the end of the current year is $10,000 more than the working capital
at the end of the preceding year, reported as follows:
Year 2
Year 1
Current assets:
Cash, marketable securities, and receivables
$ 80,000
$ 84,000
Inventories
120,000
66,000
Total current assets
$200,000
$150,000
Current liabilities
100,000
60,000
Working capital
$100,000
$ 90,000
Has the current position of Garrison Corporation improved? Explain.
Working capital
Current ratio
Quick ratio
and the quick ratio has fallen from 1.4 to 0.8.