Chapter 14 – Financial Statement Analysis
175. A company reports the following:
Sales
$720,000
Average accounts receivable (net)
45,000
Determine the (a) accounts receivable turnover, and (b) number of days’ sales in receivables. Round your answer to one
decimal place.
(a)
Number of days’ sales in receivables = 22.8
176. A company reports the following:
Sales
$1,200,000
Average accounts receivable (net)
50,000
Determine the (a) accounts receivable turnover, and (b) number of days’ sales in receivables. Round your answer to one
decimal place.
(a)
Accounts receivable turnover = Sales/Average accounts receivable
Accounts receivable turnover = $1,200,000/$50,000
Accounts receivable turnover = 24.0
Number of days’ sales in receivables = $50,000/($1,200,000/365)
Number of days’ sales in receivables = 15.2
Chapter 14 – Financial Statement Analysis
177. A company reports the following:
Cost of goods sold
$610,000
Average inventory
80,000
Determine the (a) inventory turnover, and (b) number of days’ sales in inventory. Round your answer to one decimal
place.
Inventory turnover = Cost of goods sold/Average inventory
Inventory turnover = $610,000/$80,000
Inventory turnover = 7.6
Number of days’ sales in inventory = $80,000/($610,000/365)
Number of days’ sales in inventory = 47.9 days
178. The following information was taken from Slater Company’s balance sheet:
Fixed assets (net)
$1,250,000
Long-term liabilities
500,000
Total liabilities
672,000
Total stockholders’ equity
1,680,000
Determine the company’s (a) ratio of fixed assets to long-term liabilities, and (b) ratio of liabilities to stockholders’
equity. Round your answer to one decimal place.
Ratio of fixed assets to long-term liabilities = $1,250,000/$500,000
Ratio of fixed assets to long-term liabilities = 2.5
Ratio of liabilities to stockholders’ equity = $672,000/$1,680,000
Ratio of liabilities to stockholders’ equity = 0.4
Chapter 14 – Financial Statement Analysis
179. The following data are available for Martin Solutions, Inc.
Year 2
Year 1
Sales
$1,139,600
$1,192,320
Beginning inventory
80,000
64,000
Cost of goods sold
500,800
606,000
Ending inventory
72,000
80,000
(1)
Determine for each year:
(a)
The inventory turnover
(b)
The number of days’ sales in inventory (Round intermediate calculation to the nearest
whole number and your final answer to one decimal place).
(2)
What conclusions can be drawn from these data concerning the inventories?
(1)
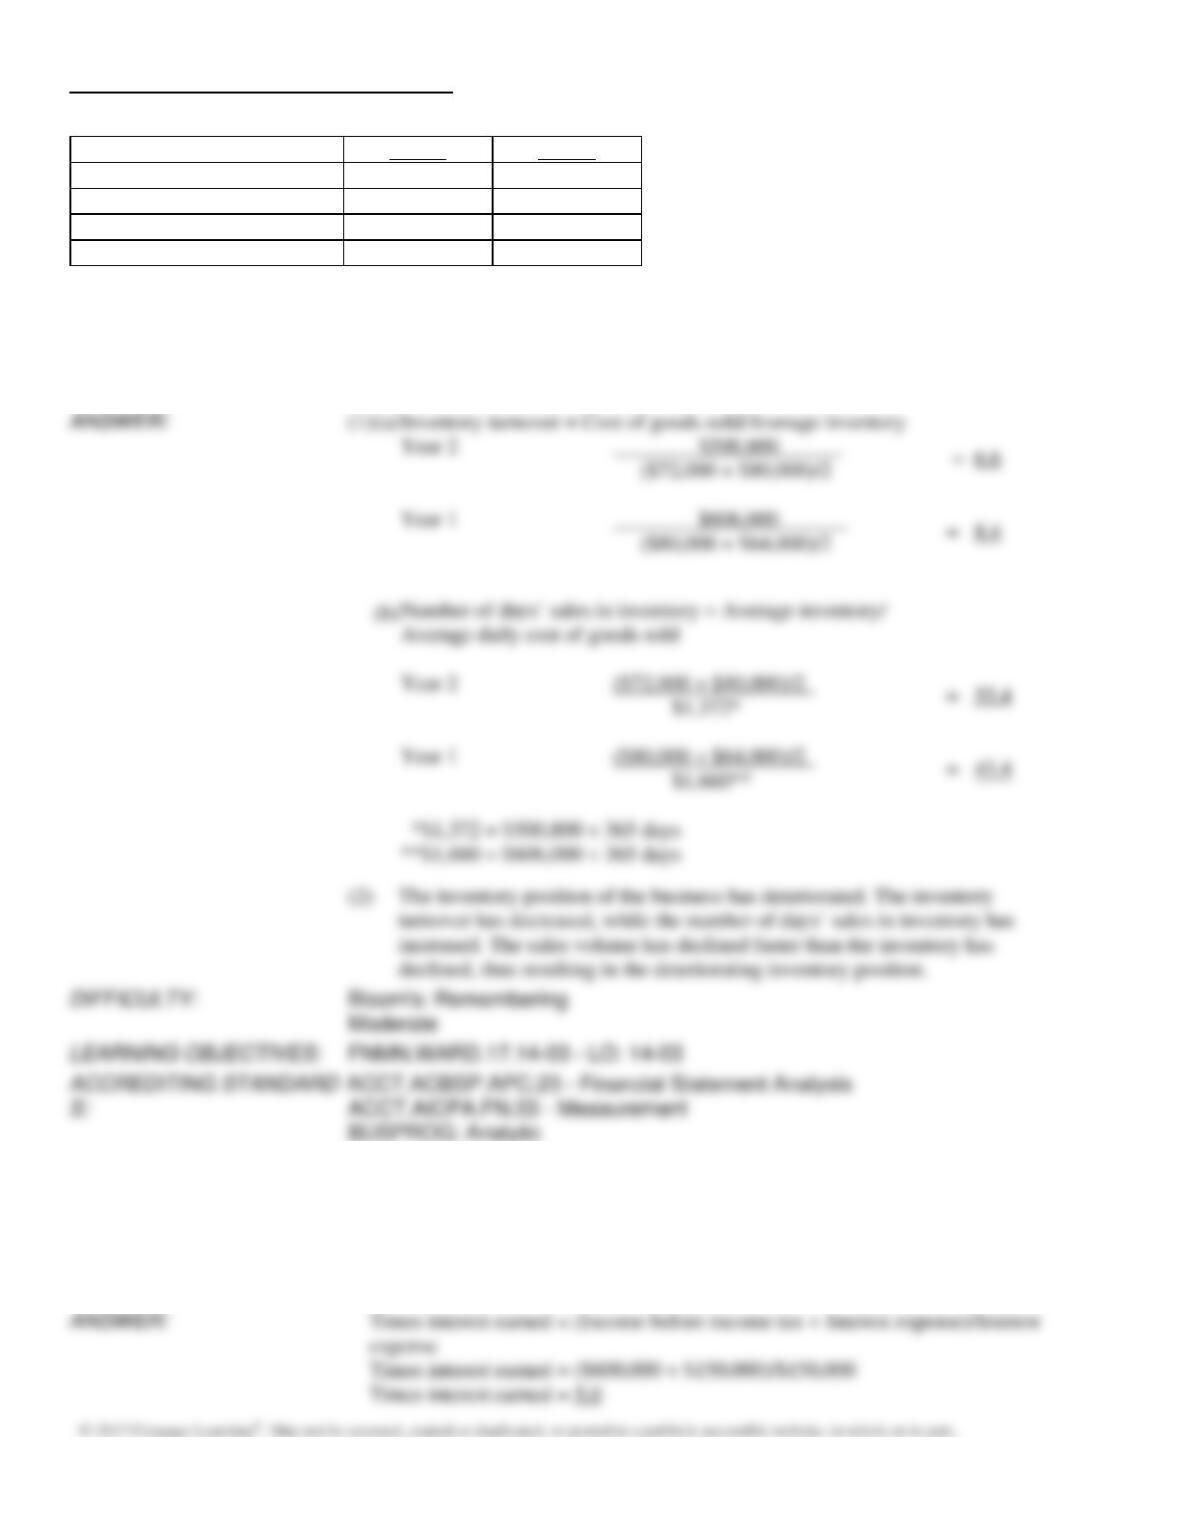
(a)
Inventory turnover = Cost of goods sold/Average inventory
($72,000 + $80,000)/2
$606,000
($80,000 + $64,000)/2
Average daily cost of goods sold
($72,000 + $80,000)/2
$1,372*
($80,000 + $64,000)/2
$1,660**
*$1,372 = $500,800 ÷ 365 days
**$1,660 = $606,000 ÷ 365 days
declined, thus resulting in the deteriorating inventory position.
180. A company reports the following:
Income before income tax
$600,000
Interest expense
150,000
Determine the times interest earned. Round your answer to one decimal place.
Chapter 14 – Financial Statement Analysis
181. The following data are taken from the balance sheet at the end of the current year.
Cash
$154,000
Accounts receivable
210,000
Inventory
240,000
Prepaid expenses
15,000
Temporary investments
350,000
Property, plant, and equipment
375,000
Accounts payable
245,000
Accrued liabilities
4,000
Income tax payable
10,000
Notes payable, short-term
85,000
Determine the (a) working capital, (b) current ratio, and (c) quick ratio. Round ratios to one decimal place.
(a)
Current assets ($969,000) – Current liabilities ($344,000) = $625,000
(b)
Current assets ($969,000)/Current liabilities ($344,000) = 2.8
182. The following data are taken from the financial statements:
Current
Preceding
Year
Year
Average accounts receivable (net)
$123,000
$ 95,000
Accounts receivable (net), end of year
129,012
87,516
Sales on account
950,000
825,000
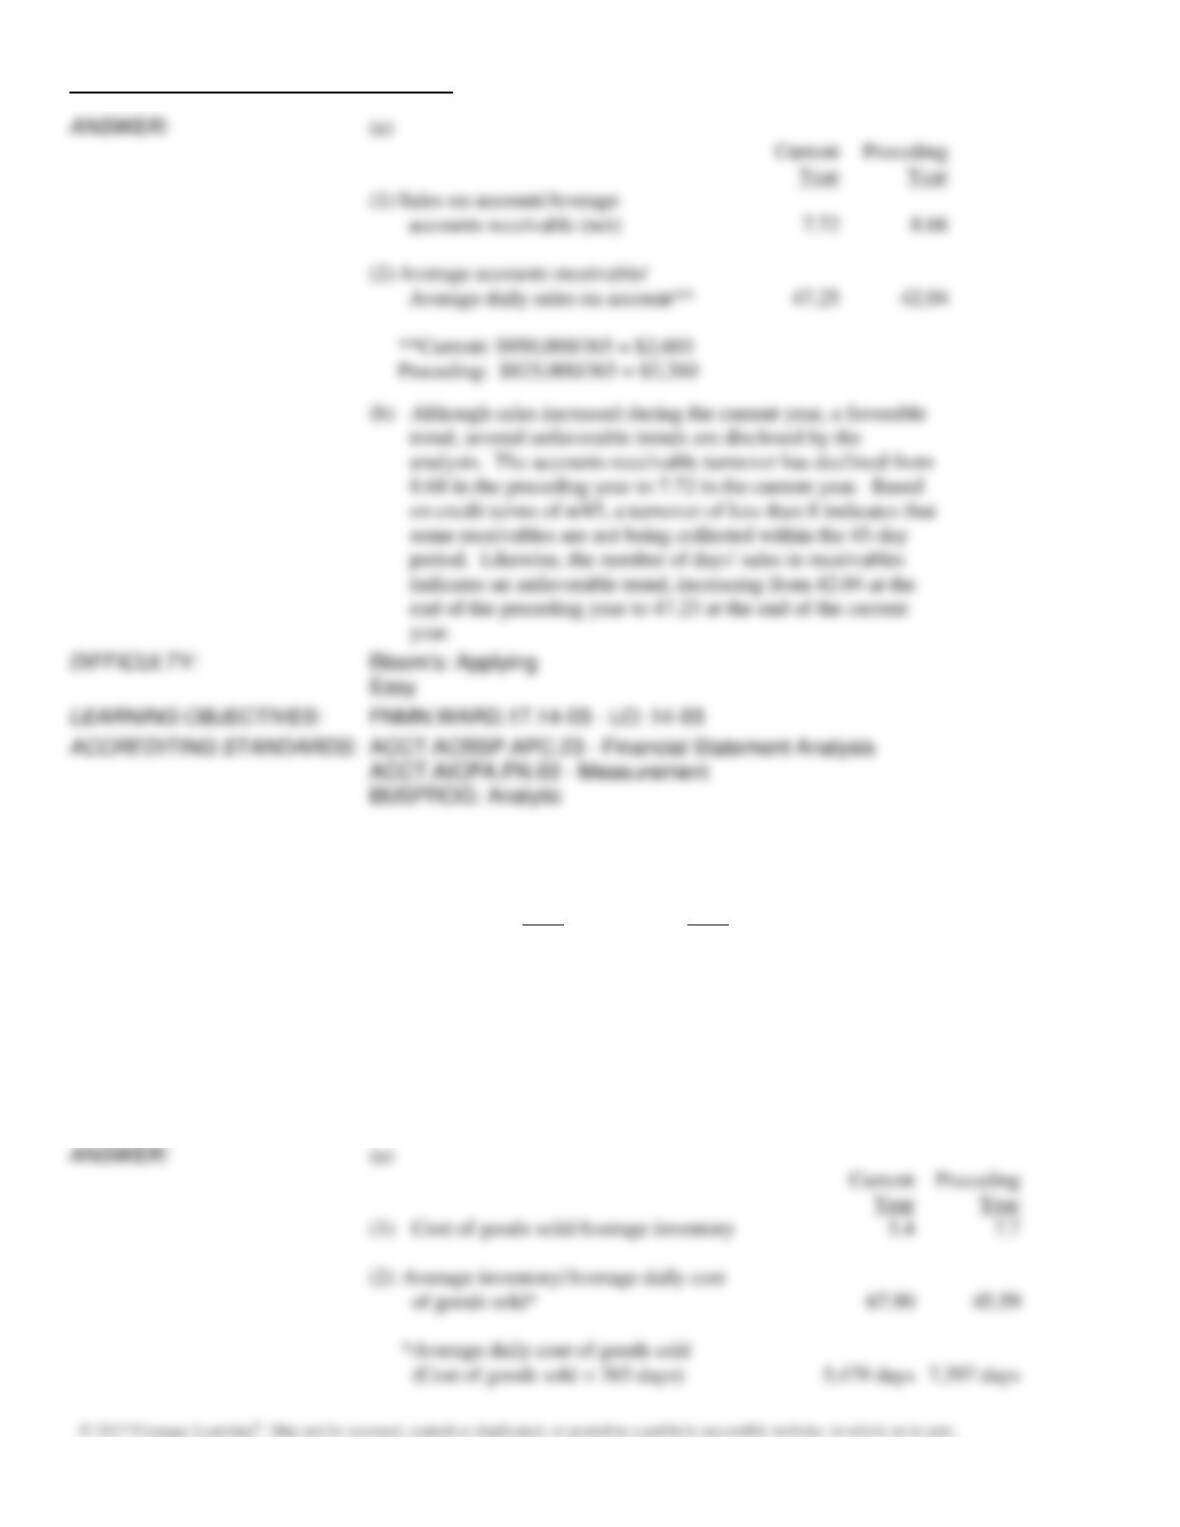
(a)
Assuming that credit terms on all sales are n/45, determine for each year (1) the accounts receivable
turnover and (2) the number of days’ sales in receivables.
Round intermediate calculations to whole numbers and final answers to two decimal places.
(b)
Comment on any significant trends revealed by the data.
Chapter 14 – Financial Statement Analysis
(1)
Sales on account/Average
(2)
Average accounts receivable/
Average daily sales on account**
**Current: $950,000/365 = $2,603
Preceding: $825,000/365 = $2,260
183. The following data are taken from the financial statements:
Current
Preceding
Year
Year
Sales
$3,600,000
$4,000,000
Cost of goods sold
2,000,000
2,700,000
Average inventory
372,000
352,000
Inventory, end of year
372,000
347,000
(a)
Determine for each year (1) the inventory turnover, round answer to one decimal place.
(2) the number of days’ sales in inventory. Round intermediate calculations to whole
numbers and final answers to two decimal places.
(b)
Comment on the favorable and unfavorable trends revealed by the data.
(1)
(2)
Average inventory/Average daily cost
*Average daily cost of goods sold
Chapter 14 – Financial Statement Analysis
unfavorable trends.
184. The balance sheet for Seuss Company at the end of the current fiscal year indicated the following:
Bonds payable, 10% (20-year term)
$5,000,000
Preferred 10% stock, $100 par
1,000,000
Common stock, $10 par
2,000,000
Income before income tax was $1,500,000 and income taxes were $200,000 for the current year. Cash dividends paid on
common stock during the current year totaled $150,000. The common stock sells for $75 per share at the end of the year.
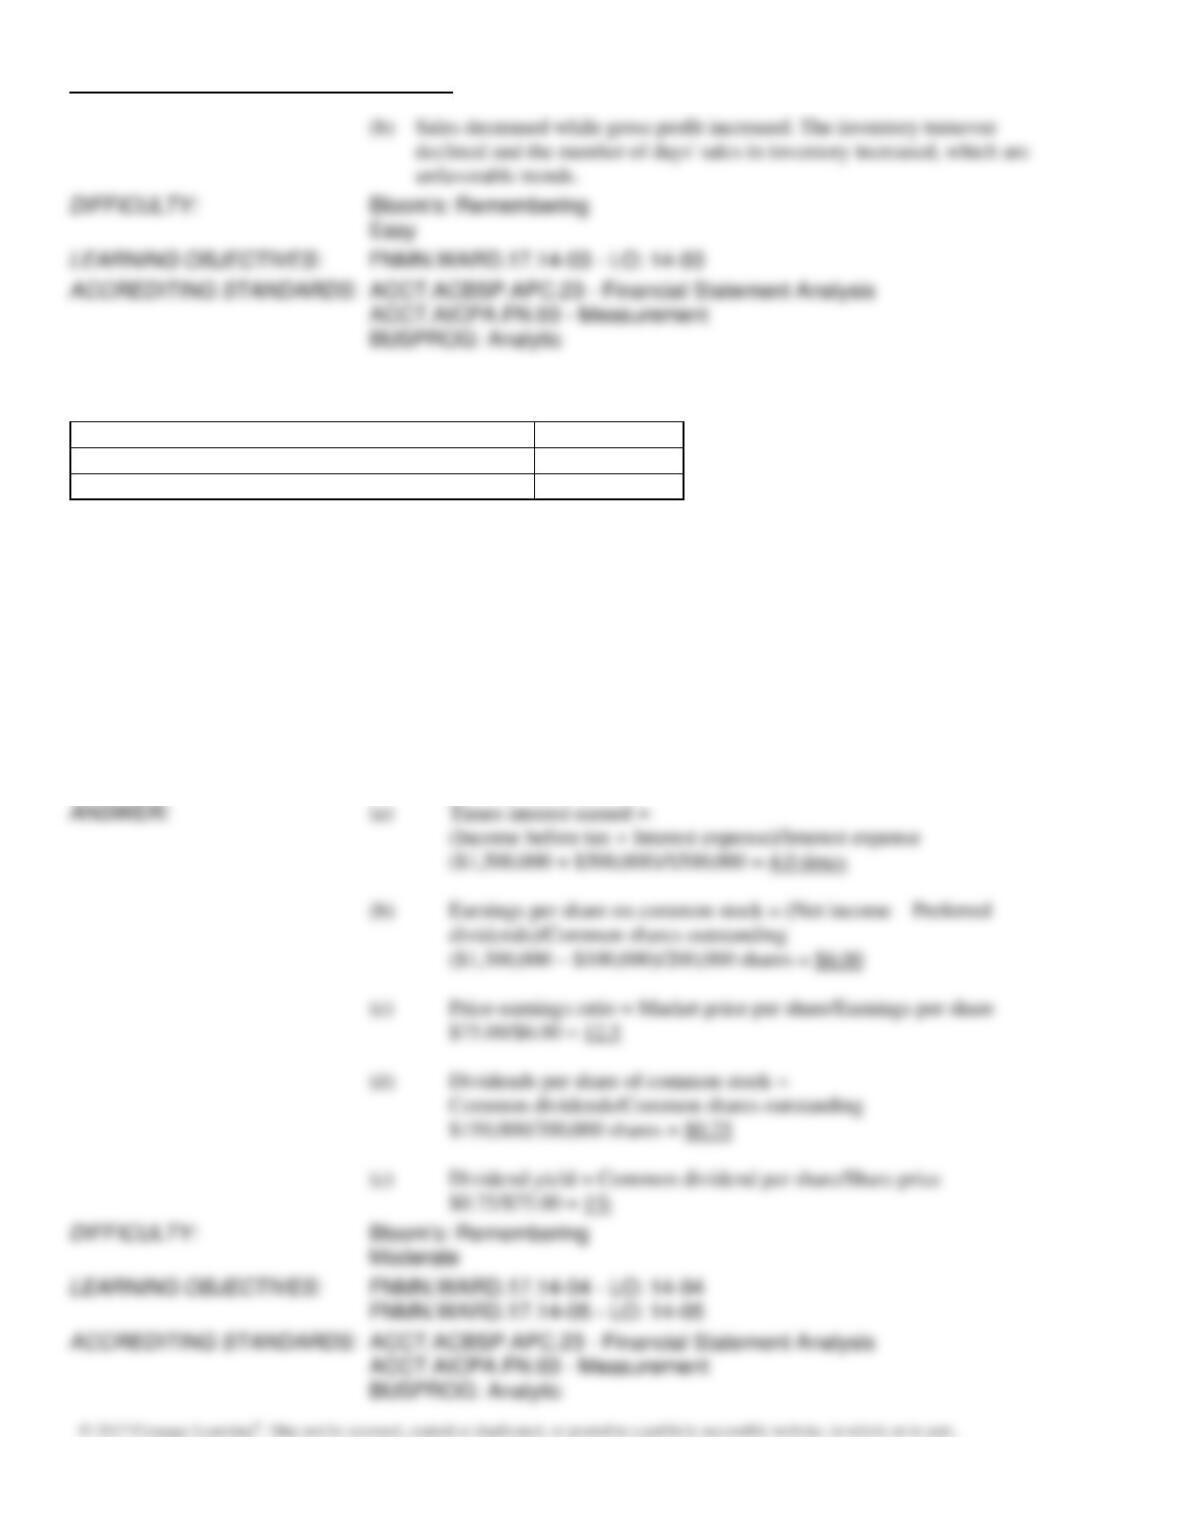
Determine each of the following:
(a)
Times interest earned
(b)
Earnings per share on common stock
(c)
Price-earnings ratio
(d)
Dividends per share of common stock
(e)
Dividend yield
Round to one decimal place except earnings per share and dividends per share, which should be rounded to two decimal
places.
(a)
Times interest earned =
(Income before tax + Interest expense)/Interest expense
($1,500,000 + $500,000)/$500,000 = 4.0 times
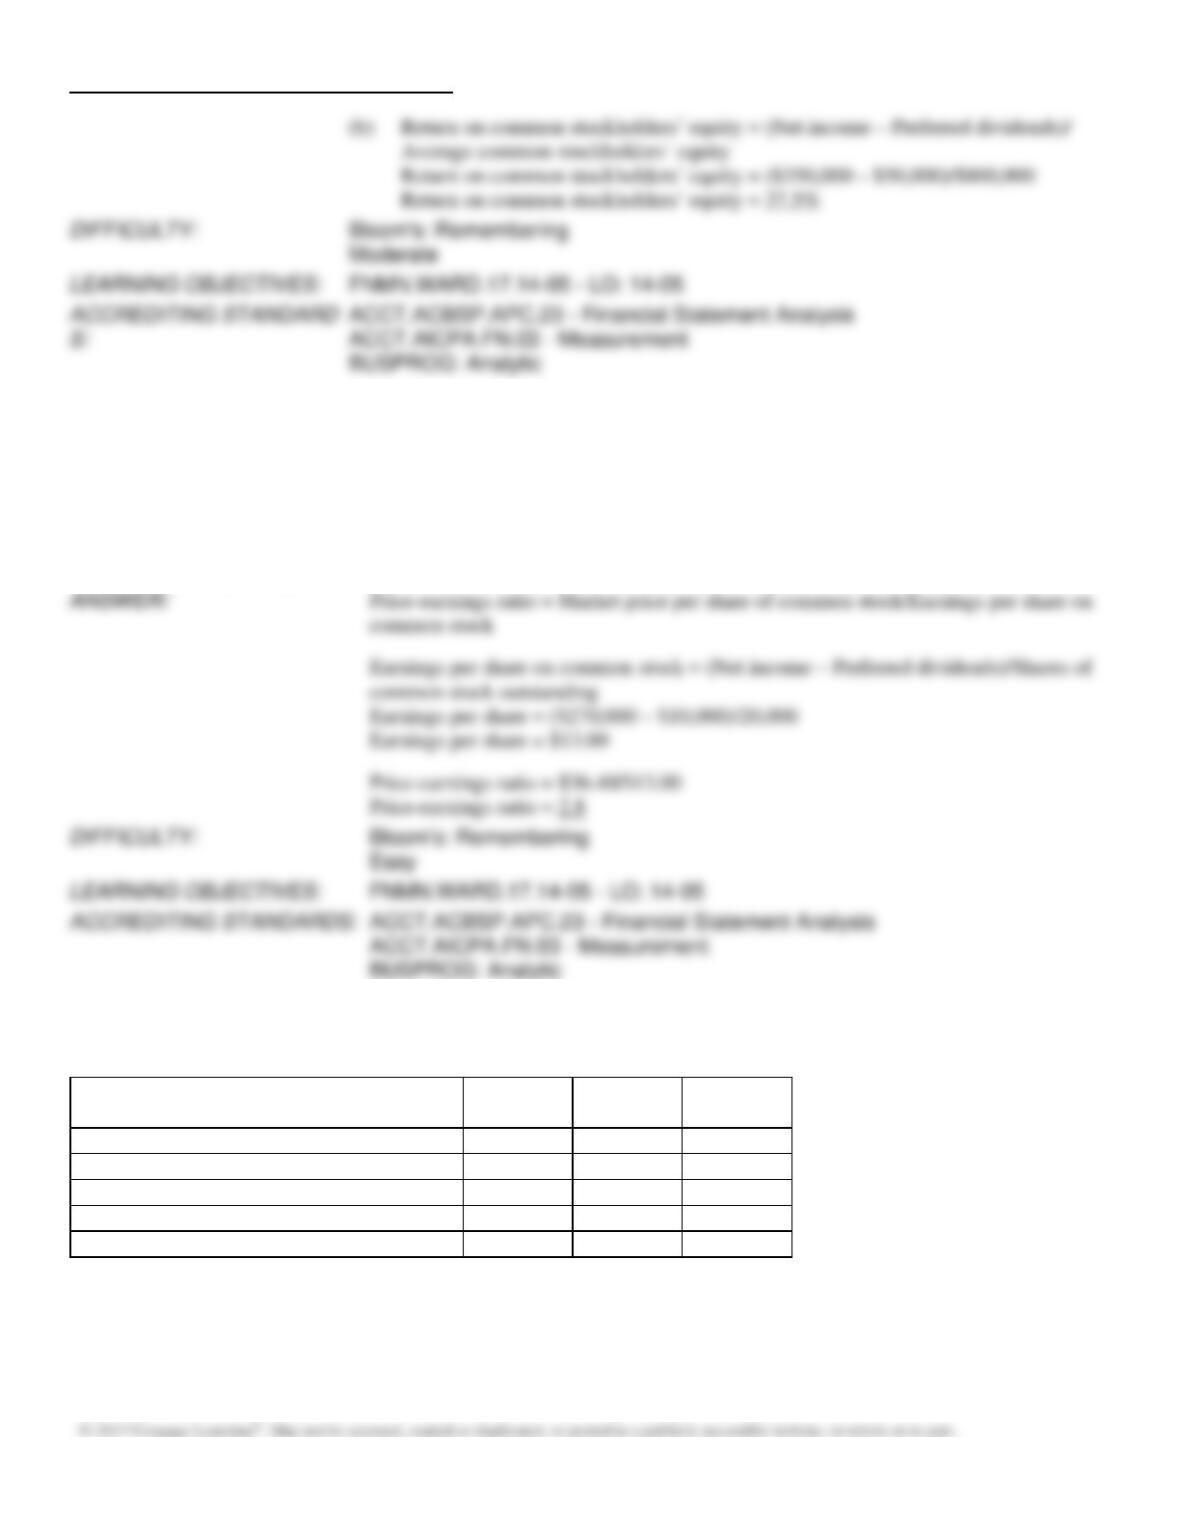
($1,300,000 – $100,000)/200,000 shares = $6.00
(c)
Price-earnings ratio = Market price per share/Earnings per share
$75.00/$6.00 = 12.5
(d)
Dividends per share of common stock =
Common dividends/Common shares outstanding
$150,000/200,000 shares = $0.75
(e)
Dividend yield = Common dividend per share/Share price
$0.75/$75.00 = 1%
Chapter 14 – Financial Statement Analysis
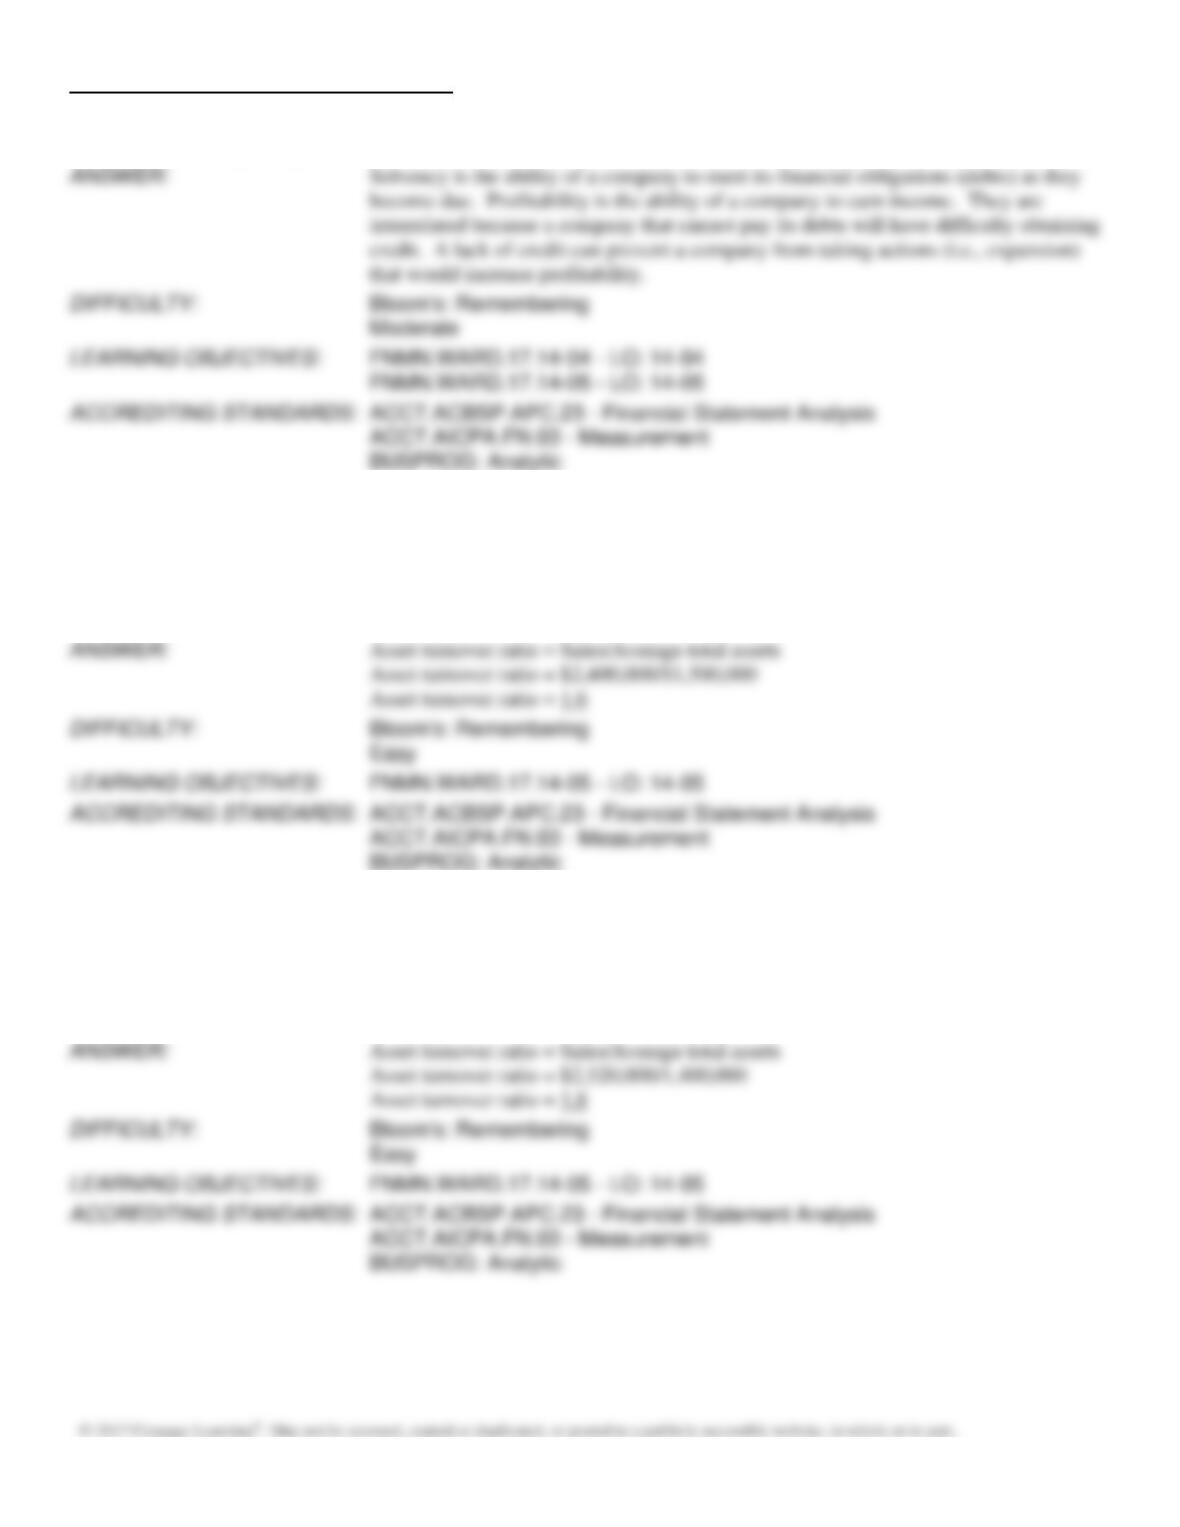
185. Define solvency and profitability. How are they alike?
186. A company reports the following:
Sales
$2,400,000
Average total assets (excluding long-term investments)
1,500,000
Determine the asset turnover ratio. Round your answer to one decimal place.
187. A company reports the following:
Sales
$2,520,000
Average total assets (excluding long-term investments)
1,400,000
Determine the asset turnover ratio. Round your answer to one decimal place.
Chapter 14 – Financial Statement Analysis
188. A company reports the following income statement and balance sheet information for the current year:
Net income
$ 180,000
Interest expense
20,000
Average total assets
2,000,000
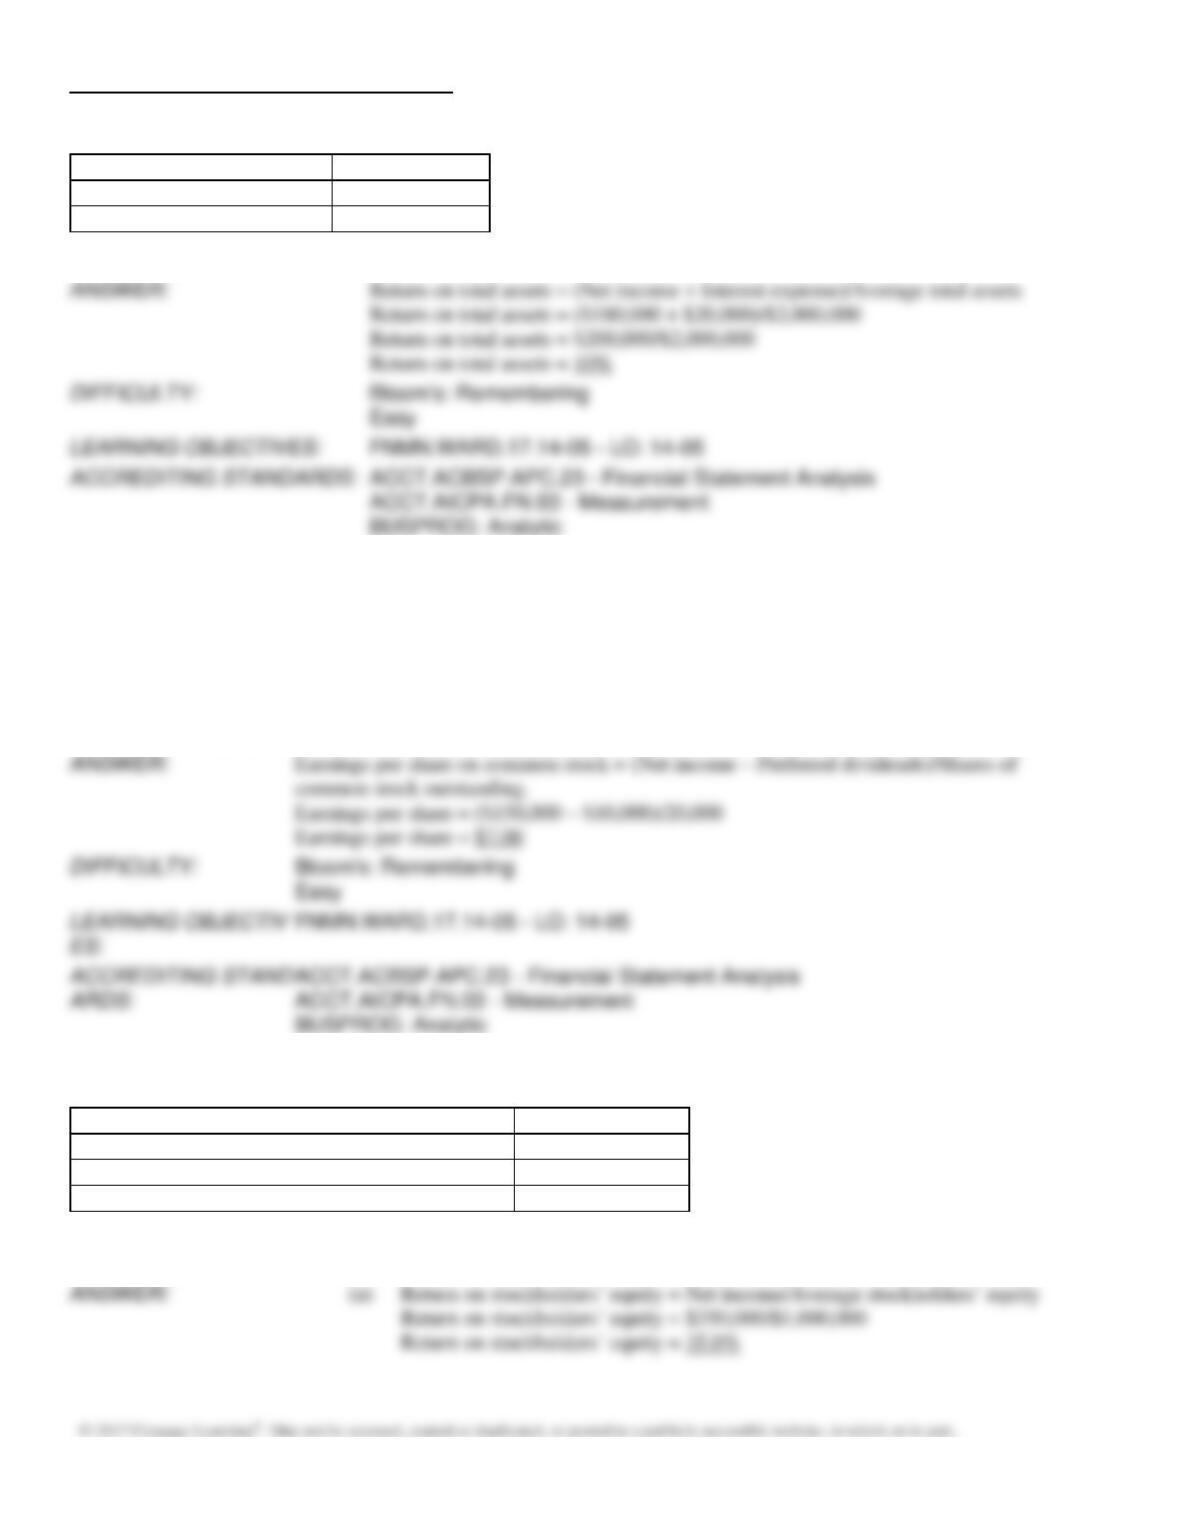
Determine the return on total assets. Round your answer to one decimal place.
Return on total assets = 10%
189. A company reports the following:
Net income
$150,000
Preferred dividends
$10,000
Shares of common stock outstanding
20,000
Market price per share of common stock
$35
Calculate the company’s earnings per share on common stock.
190. A company reports the following:
Net income
$ 350,000
Preferred dividends
50,000
Average stockholders’ equity
1,000,000
Average common stockholders’ equity
800,000
Determine the (a) return on stockholders’ equity, and (b) return on common stockholders’ equity. Round your answer to
one decimal place.
Return on stockholders’ equity = Net income/Average stockholders’ equity
Chapter 14 – Financial Statement Analysis
Return on common stockholders’ equity = (Net income – Preferred dividends)/
Average common stockholders’ equity
Return on common stockholders’ equity = ($350,000 – $50,000)/$800,000
Return on common stockholders’ equity = 37.5%
191. A company reported the following:
Net income
$270,000
Preferred dividends
$10,000
Shares of common stock outstanding
20,000
Market price per share of common stock
$36.40
Calculate the company’s price-earnings ratio. Round your answer to one decimal place.
192. The following selected data were taken from the financial statements of the Winter Group for the three most recent
years of operations:
Dec. 31,
Year 3
Dec.31,
Year 2
Dec. 31,
Year 1
Total assets
$3,000,000
$2,700,000
$2,400,000
Notes payable (10% interest)
1,000,000
1,000,000
1,000,000
Common stock
400,000
400,000
400,000
Preferred $6 stock, $100 par
200,000
200,000
200,000
Retained earnings
1,126,000
896,000
600,000
The Year 3 net income was $242,000 and the Year 2 net income was $308,000. No dividends on common stock were
declared during the 3 years.
(a) Determine the return on total assets, the return on stockholders’ equity, and the return on
common stockholders’ equity for Years 2 and 3. Round to one decimal place.
(b) What conclusion can be drawn from these data as to the company’s profitability?
Chapter 14 – Financial Statement Analysis
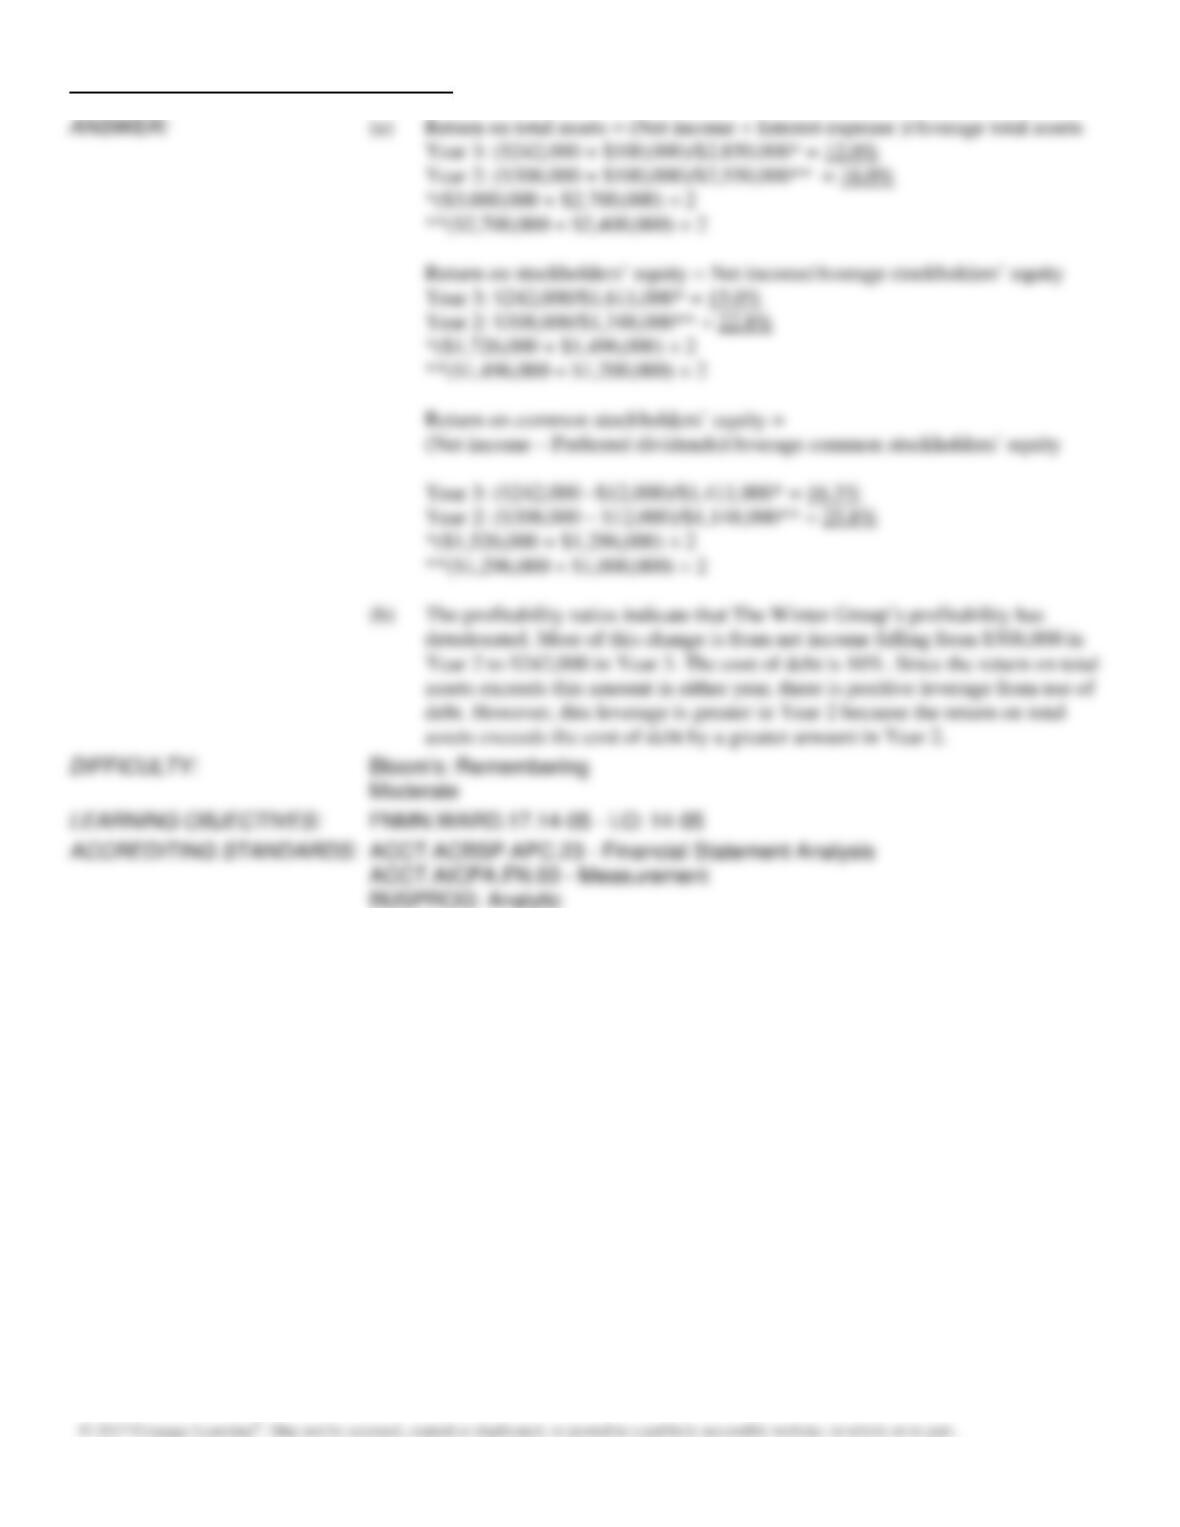
(a)
Return on total assets = (Net income + Interest expense )/Average total assets
Year 3: ($242,000 + $100,000)/$2,850,000* = 12.0%
Year 2: ($308,000 + $100,000)/$2,550,000** = 16.0%
*($3,000,000 + $2,700,000) ÷ 2
**($2,700,000 + $2,400,000) ÷ 2
Return on stockholders’ equity = Net income/Average stockholders’ equity
Year 3: $242,000/$1,611,000* = 15.0%
Year 2: $308,000/$1,348,000** = 22.8%
*($1,726,000 + $1,496,000) ÷ 2
**($1,496,000 + $1,200,000) ÷ 2
Return on common stockholders’ equity =
(Net income – Preferred dividends)/Average common stockholders’ equity
Year 3: ($242,000 –$12,000)/$1,411,000* = 16.3%
Year 2: ($308,000 – $12,000)/$1,148,000** = 25.8%
*($1,526,000 + $1,296,000) ÷ 2
**($1,296,000 + $1,000,000) ÷ 2
assets exceeds the cost of debt by a greater amount in Year 2.
193. Selected data from the Carmen Company at year end are presented below:
Total assets
$2,000,000
Average total assets
2,200,000
Net income
250,000
Sales
1,300,000
Average common stockholders’ equity
1,000,000
Net cash provided by operating activities
275,000
Shares of common stock outstanding
10,000
Long-term investments
400,000
Calculate: (a) asset turnover ratio; (b) return on total assets; (c) return on common stockholders’ equity; and (d) earnings
per share on common stock. Assume the company had no preferred stock or interest expense. Round dollar values to two
decimal places and other final answers to one decimal place.
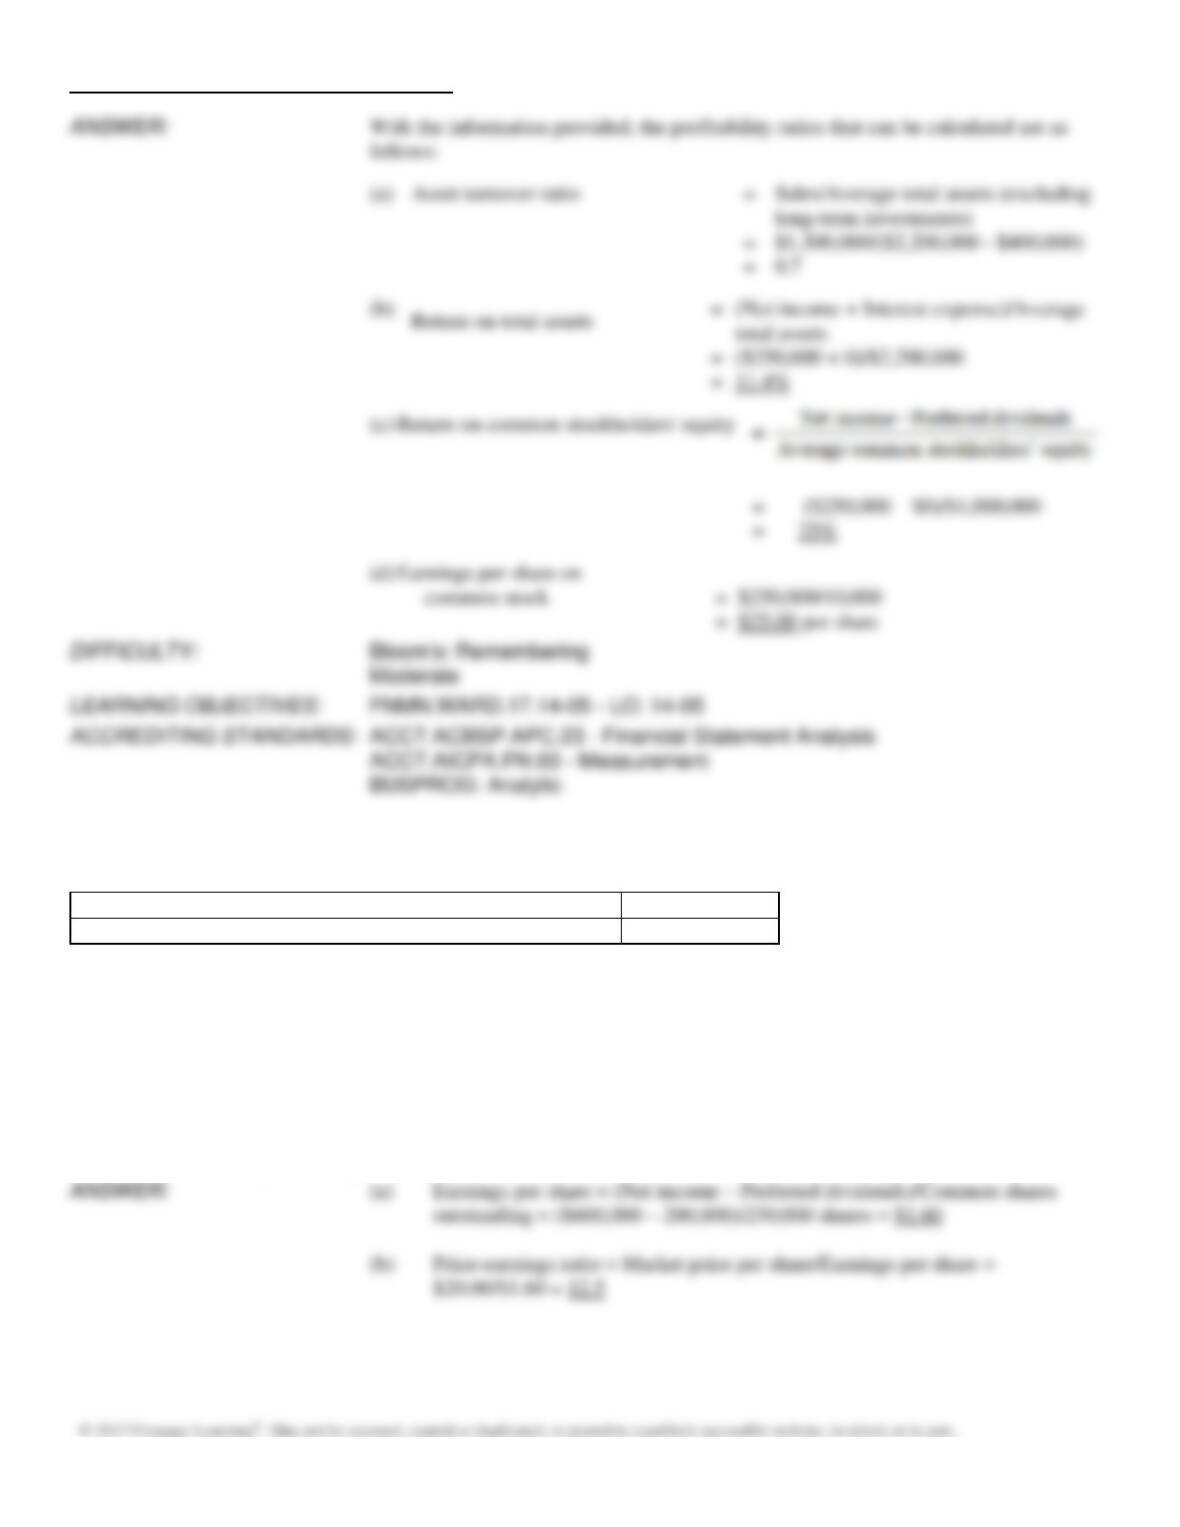
Chapter 14 – Financial Statement Analysis
=
$1,300,000/($2,200,000 – $400,000)
=
($250,000 + 0)/$2,200,000
Return on common stockholders’ equity
=
($250,000 – $0)/$1,000,000
=
Earnings per share on
$25.00 per share
194. The following information was taken from the financial statement of Fox Resources for December 31 of the current
fiscal year:
Common stock, $20 par value (no change during the year)
$5,000,000
Preferred 10% stock, $40 par (no change during the year)
2,000,000
The net income was $600,000, and the declared dividends on the common stock were $125,000 for the current year. The
market price of the common stock is $20 per share.
Calculate for the common stock:
(a) earnings per share
(b) the price-earnings ratio
(c) the dividends per share and the dividend yield
Round to one decimal place except earnings per share, which should be rounded to two decimal places.
Chapter 14 – Financial Statement Analysis
195. The following data are taken from the financial statements:
Current
Year
Preceding
Year
Current assets
$ 745,000
$ 820,000
Property, plant, and equipment
1,510,000
1,400,000
Current liabilities
(non-interest-bearing)
160,000
140,000
Long-term liabilities, 12%
400,000
400,000
Preferred 10% stock
250,000
250,000
Common stock, $25 par
1,200,000
1,200,000
Retained earnings,
beginning of year
230,000
160,000
Net income for year
110,000
155,000
Preferred dividends declared
(25,000)
(25,000)
Common dividends declared
(70,000)
(60,000)
Determine for the current year the (a) return on total assets, (b) return on stockholders’ equity, (c) return on common
stockholders’ equity, (d) earnings per share on common stock, (e) price-earnings ratio on common stock, and (f) dividend
yield. The current market price per share of common stock is $25.
Round dollar values to two decimal places and other final answers to one decimal place.
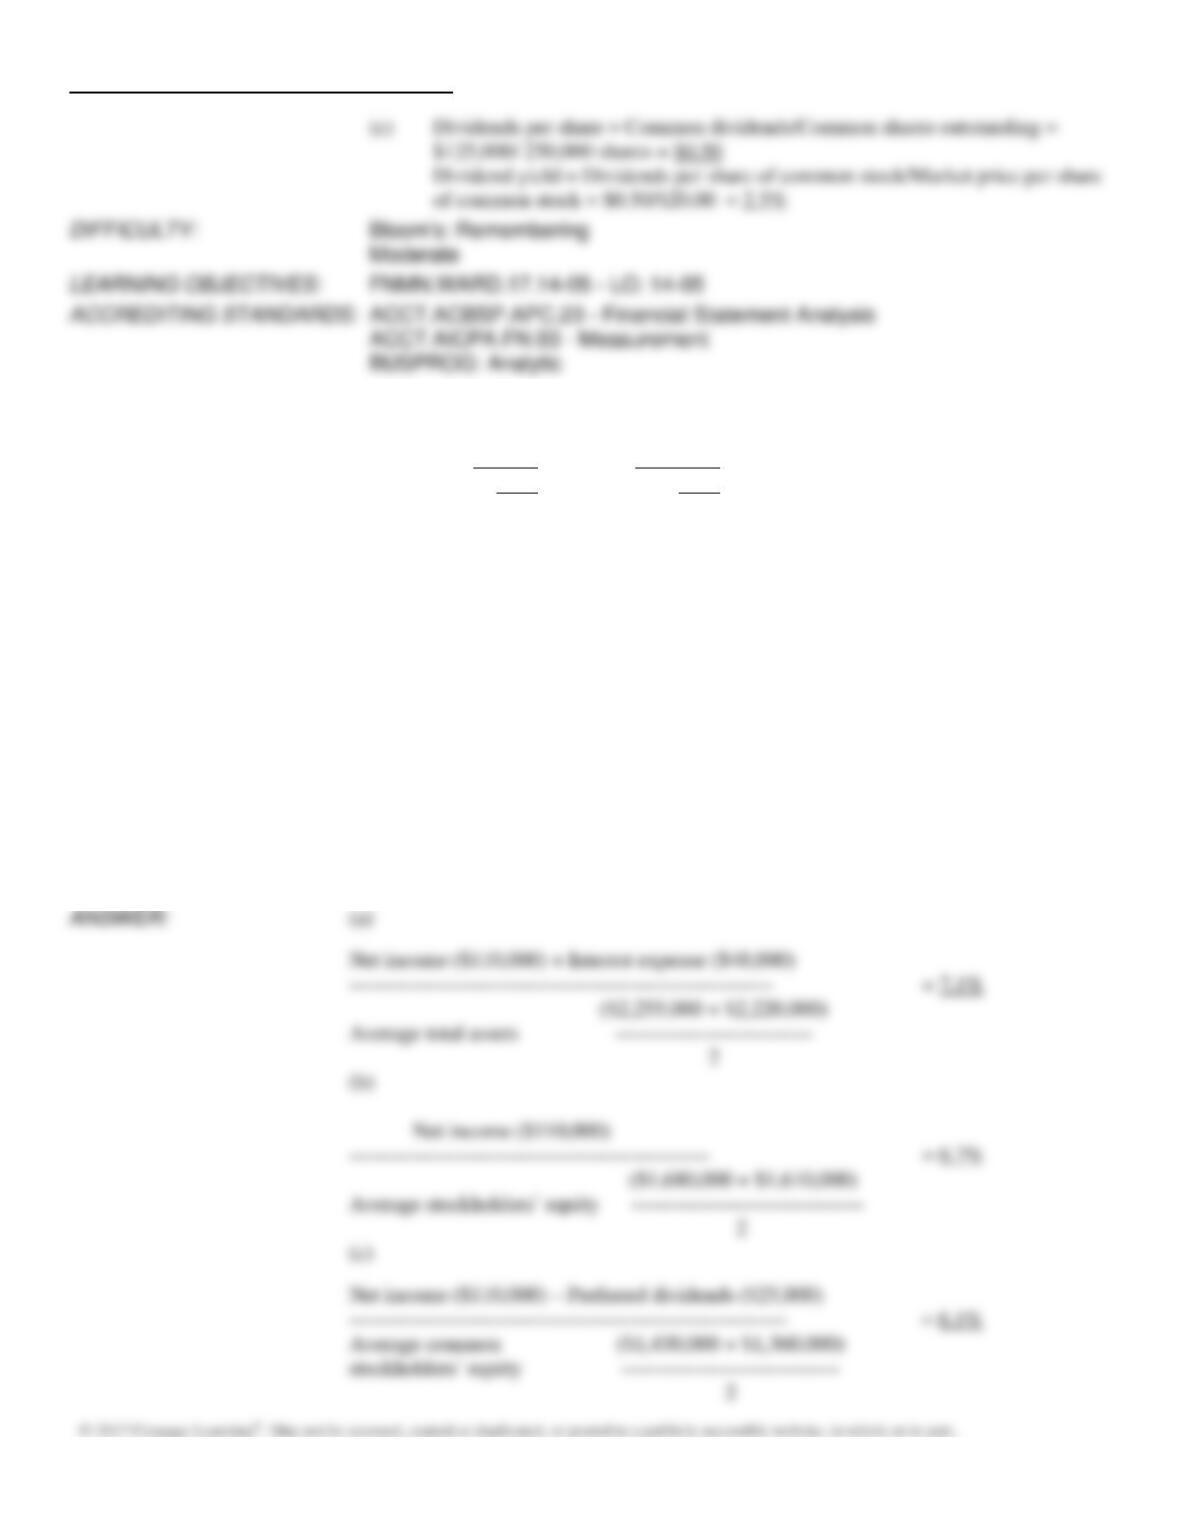
Net income ($110,000) + Interest expense ($48,000)
= 7.1%
Average total assets
Net income ($110,000)
($1,680,000 + $1,610,000)
Average stockholders’ equity ———————————
2
Net income ($110,000) – Preferred dividends ($25,000)
Average common
Chapter 14 – Financial Statement Analysis
Shares of common stock outstanding (48,000)
= $1.77
Market price per share of common stock ($25)
= 14.1
Earnings per share of common stock ($1.77)
Dividends per share of common stock ($1.46)
= 5.8%
Market price per share of common stock ($25)
196. The following information has been condensed from the December 31 balance sheets of Gabriel Co.:
Year 2
Year 1
Assets:
Current assets
$ 825,500
$ 674,300
Fixed assets (net)
1,473,600
1,275,300
Total assets
$2,299,100
$1,949,600
Liabilities:
Current liabilities
$ 313,500
$ 309,600
Long-term liabilities
703,000
545,000
Total liabilities
$1,016,500
$ 854,600
Stockholders’ equity
$1,282,600
$1,095,000
Total liabilities and
stockholders’ equity
$2,299,100
$1,949,600
(a)
Determine the ratio of fixed assets to long-term liabilities for each year.
(b)
Determine the ratio of liabilities to stockholders’ equity for each year.
(c)
Comment on the year-to-year changes for both ratios.
Round your answers to two decimal places.
Ratio of fixed assets to
long-term liabilities
Ratio of liabilities to
stockholders’ equity
Chapter 14 – Financial Statement Analysis
197. Abigail Company reports the following:
Net income
$ 295,000
Preferred dividends
30,000
Average stockholders’ equity
1,000,000
Average common stockholders’ equity
700,000
Determine the (a) return on stockholders’ equity, and (b) return on common stockholders’ equity. Round your answer to
one decimal place.
Return on stockholders’ equity = Net income/Average stockholders’ equity
Return on stockholders’ equity = $295,000/$1,000,000
Return on stockholders’ equity = 29.5%
Return on common stockholders’ equity = ($295,000 – $30,000)/$700,000
Return on common stockholders’ equity = 37.9%
198. Gallant Company reported net income of $2,500,000. The income statement included a $200,000 loss on
discontinued operations, after applicable income tax. There were 100,000 shares of $10 par common stock and 40,000
shares of 4% preferred stock of $100 par outstanding throughout the current year.
Prepare the earnings per share section of Gallant Company’s income statement.
Earnings per common share:
Net income
Net income
Loss on discontinued operations
Income from continuing operations
Earnings per share on common stock =
shares = $25.40 per share
Chapter 14 – Financial Statement Analysis
199. What information is generally included in the Management Discussion and Analysis (MD&A) section of a corporate
annual report?
200. Rho, Sigma, and Tau Companies have the following data for the current year:
Rho Company
Sigma Company
Tau Company
Price-earnings ratio
23.7
16.9
30.1
Which company would be expected to have the best potential for future common stock price appreciation?
Chapter 14 – Financial Statement Analysis
201. CorpCo gathered the following information as of the end of the current fiscal year:
Dividends on common stock
$125,000
Market price per share of common stock
$115.00
Shares of common stock outstanding
5,000
Dividends on preferred stock
$65,000
Shares of preferred stock outstanding
600
Earnings per share on common stock
$102.00
Dividends per share of common stock
$25.00
Net income
$575,000
What is CorpCo’s dividend yield? Write your answer as a percent, rounded to one decimal place.
$25.00/$115.00 = 21.7%
202. CorpCo gathered the following information at the end of the current fiscal year:
Dividends on common stock
$125,000
Market price per share of common stock
$115.00
Shares of common stock outstanding
5,000
Dividends on preferred stock
$65,000
Shares of preferred stock outstanding
600
Earnings per share on common stock
$102.00
Dividends per share of common stock
$25.00
Net income
$575,000
What is CorpCo’s price-earnings ratio? Round your answer to one decimal place.
$115.00/$102.00 = 1.1
Chapter 14 – Financial Statement Analysis
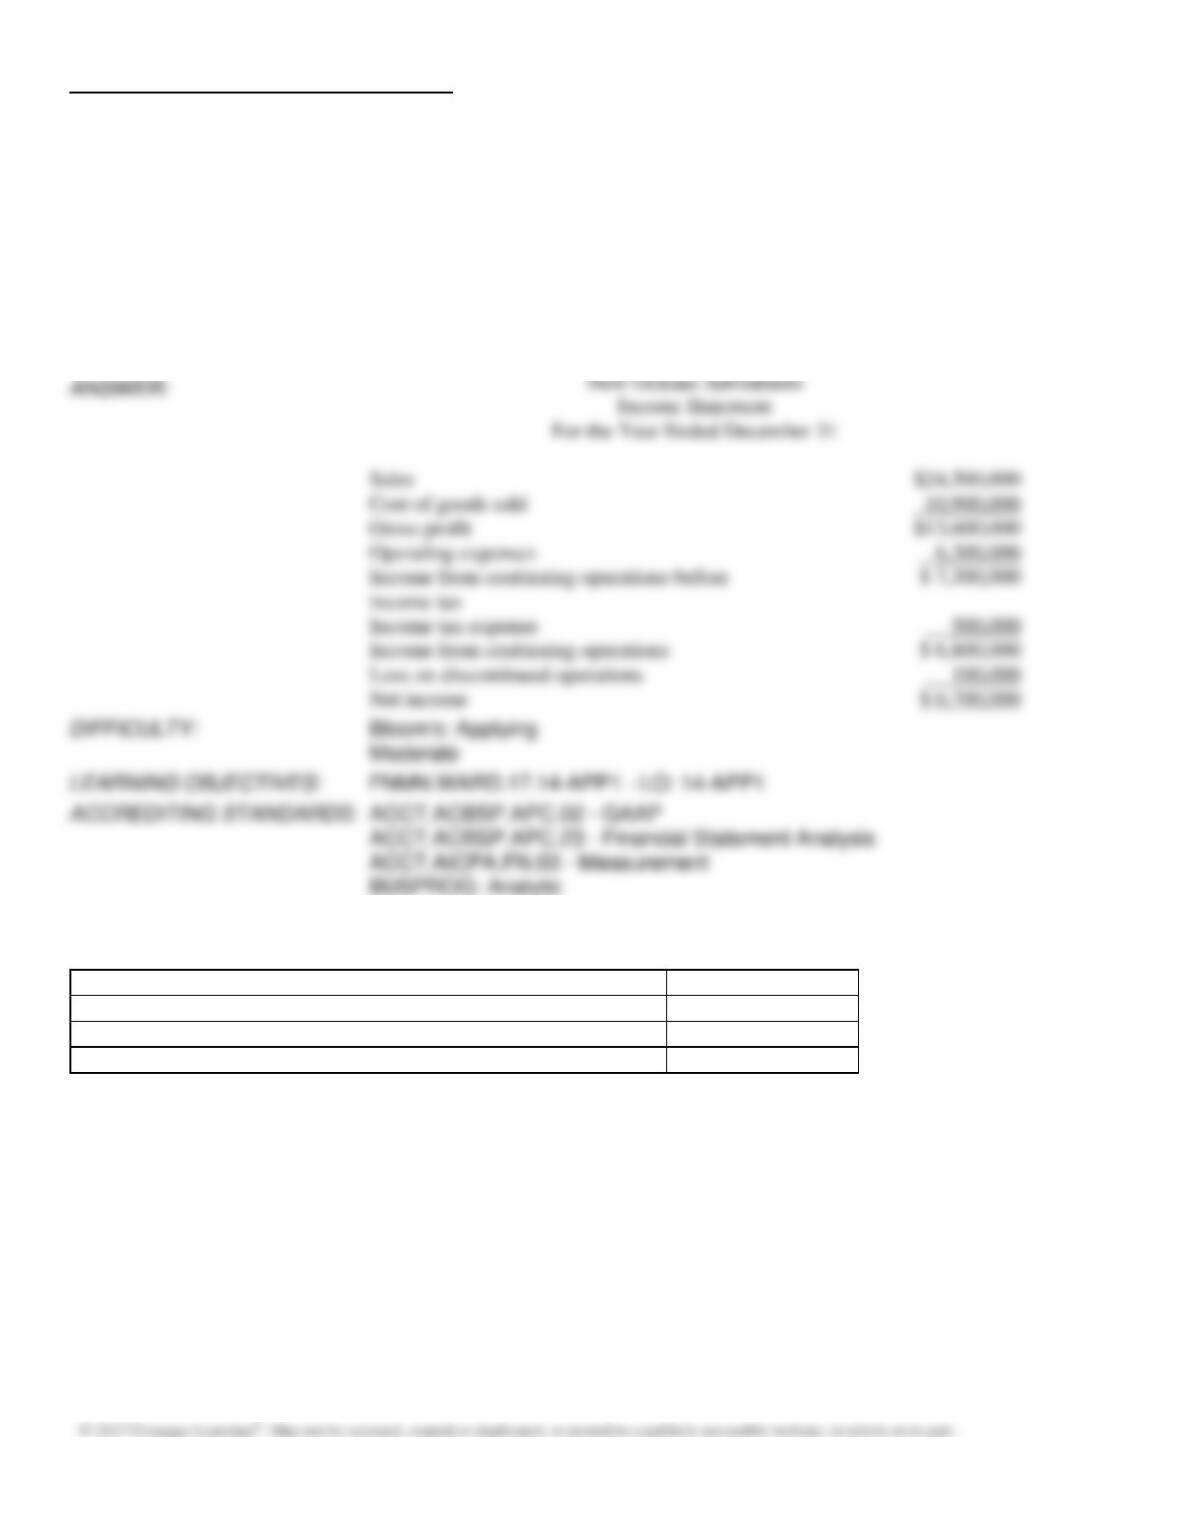
203. Prepare an income statement using the following data for New Orleans Adventures for the year ended December 31:
New Orleans Adventures
Income Statement
For the Year Ended December 31
Sales
$24,500,000
Cost of goods sold
10,900,000
Operating expenses
6,300,000
Income tax expense
500,000
Loss on discontinued operations
100,000
Sales
Cost of goods sold
Gross profit
Operating expenses
Income from continuing operations before
income tax
Income tax expense
Income from continuing operations
Loss on discontinued operations
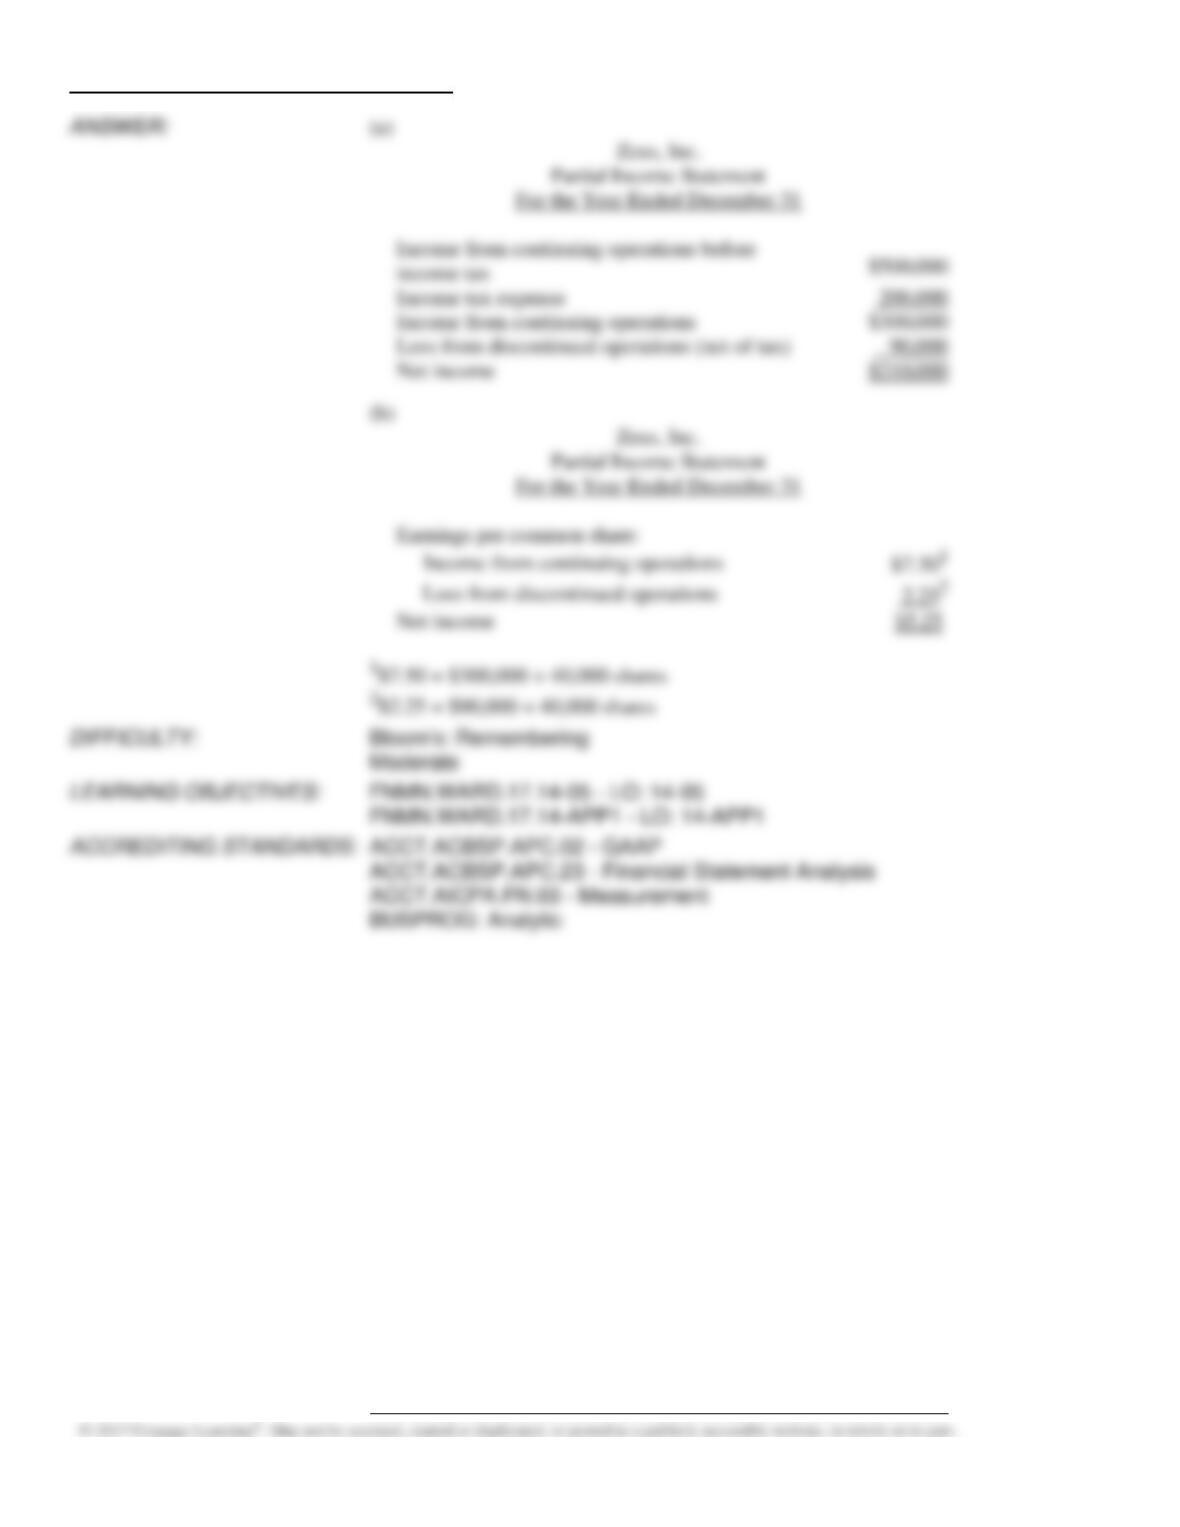
204. Zeus Company reports the following for the current year:
Income from continuing operations before income tax
$500,000
Loss from discontinued operations
$90,000*
Weighted average number of common shares outstanding
40,000
Applicable tax rate
40%
*Net of any tax effect
(a)
Prepare a partial income statement for Zeus Company beginning with income from
continuing operations before income tax.
(b)
Calculate the earnings per common share for Zeus.
Chapter 14 – Financial Statement Analysis
Income tax expense
Income from continuing operations
Loss from discontinued operations (net of tax)
Earnings per common share:
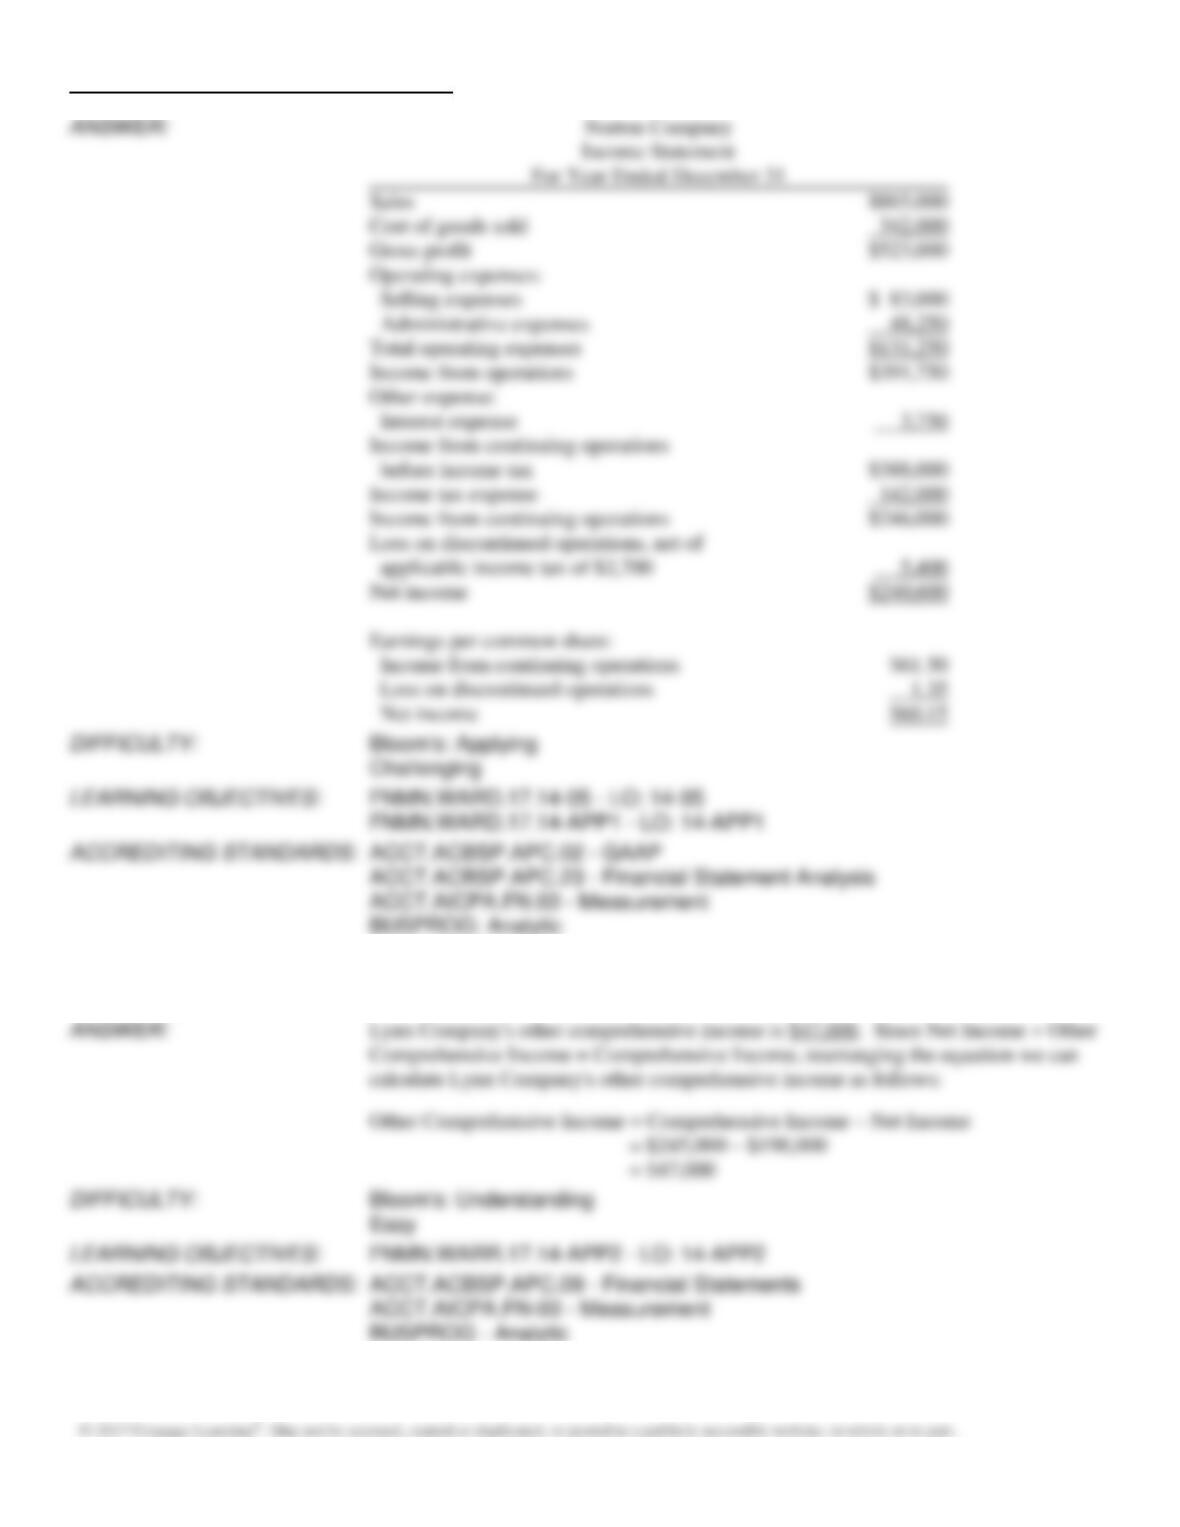
205. From the following data for Norton Company for the year ended December 31, prepare a multiple-step income
statement. Include the earnings per share presentation on the income statement.
Common stock, $50 par
$200,000
Cost of goods sold
342,000
Administrative expenses
48,250
Income tax (applicable to continuing operations)
142,000
Interest expense
3,750
Loss on discontinued operations,
net of applicable tax of $2,700
5,400
Sales
865,000
Selling expenses
83,000
Chapter 14 – Financial Statement Analysis
206. For the current year, Lynx Company’s comprehensive income was $245,000 and its net income was $198,000. What
is Lynx Company’s other comprehensive income?