
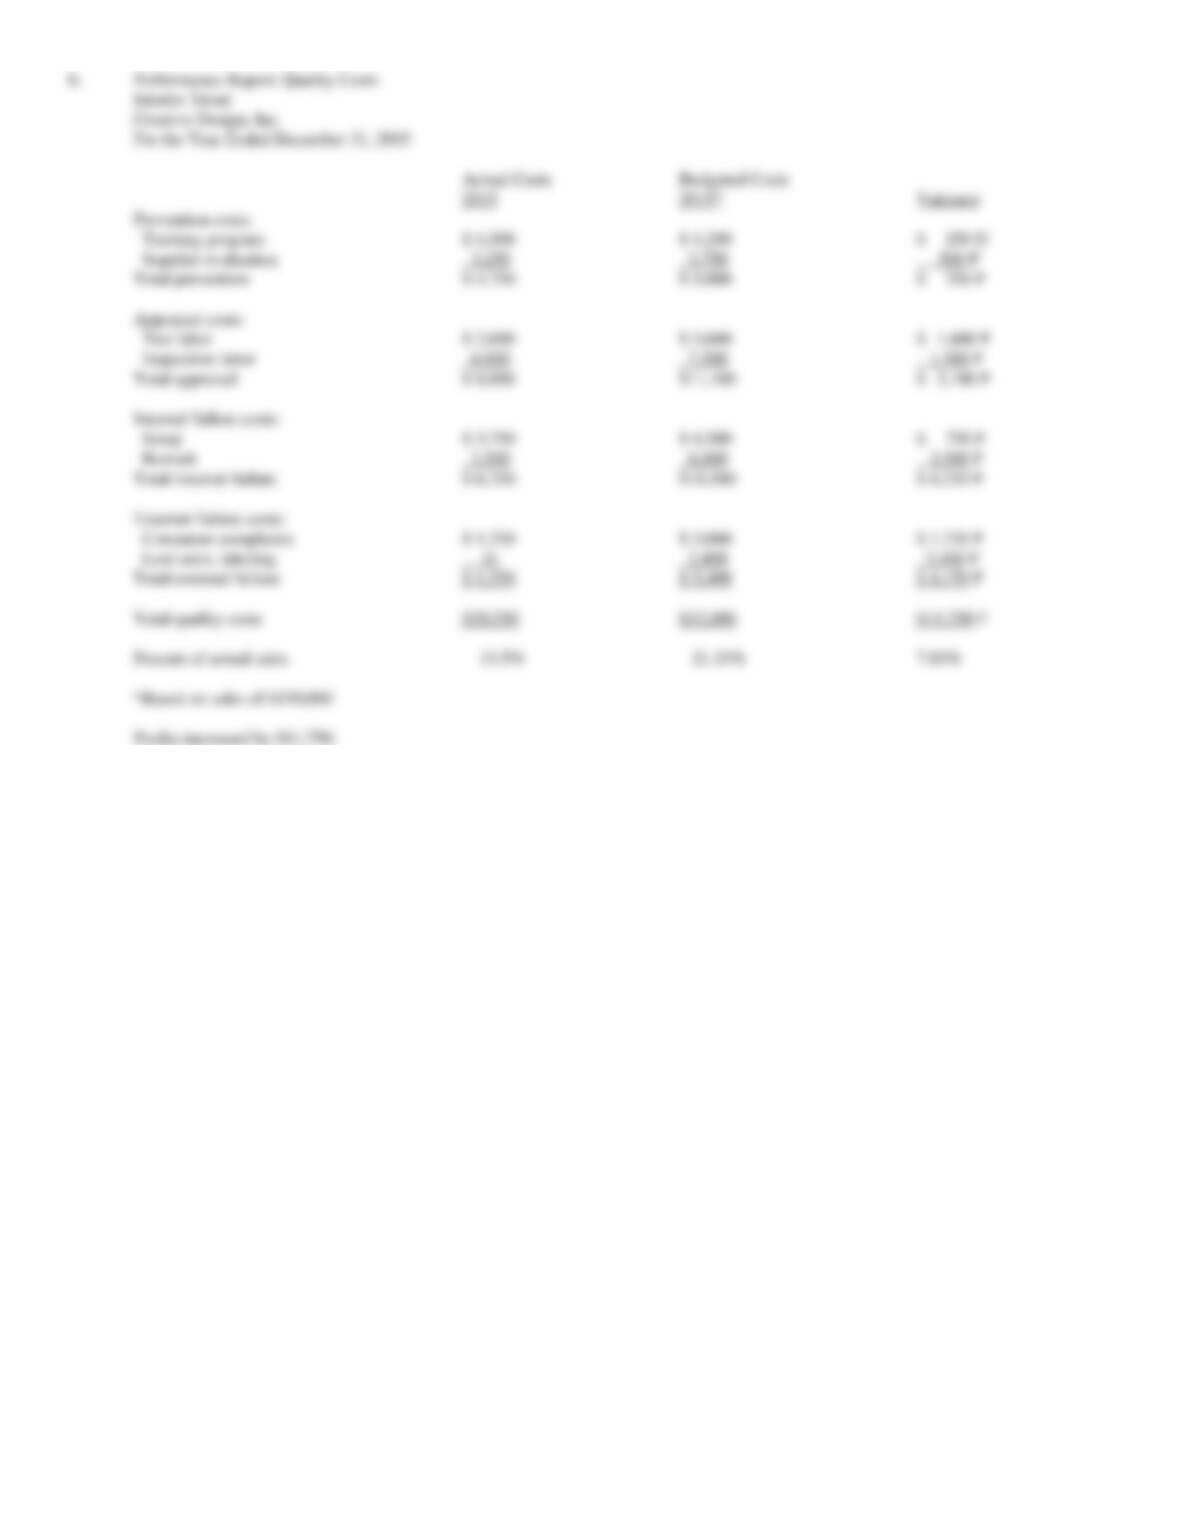
193. In 2014, Creative Design, Inc., instituted a quality improvement program. At the end of 2015, the
management of the corporation requested a report to show the amount saved by the measures taken during the
year. The actual sales and actual quality costs for 2014 and 2015 are as follows:
2014
2015
Sales
$125,000
$150,000
Scrap
3,750
3,750
Rework
5,000
2,500
Training program
1,250
1,500
Consumer complaints
2,500
1,250
Lost sales, incorrect labeling
2,000
—
Test labor
3,000
2,000
Inspection labor
6,250
6,000
Supplier evaluation
3,750
3,250
Required:
a.
Classify each cost as variable or fixed with respect to sales and compute the variable cost ratio for 2014. Be careful—costs may change
because of quality improvement, not cost behavior.
b.
How much did profits increase because of quality improvements made in 2015, assuming all reductions in quality costs are attributable to
quality improvements?
c.
Prepare an interim trend quality costs report for Creative Design, Inc.
a.
Scrap:
variable 3%
Rework:
variable 4%
Training program:
fixed
Lost sales, incorrect labeling:
variable 1.6%
Test labor:
variable 2.4%
Inspection labor:
variable 5%
Supplier evaluation:
fixed
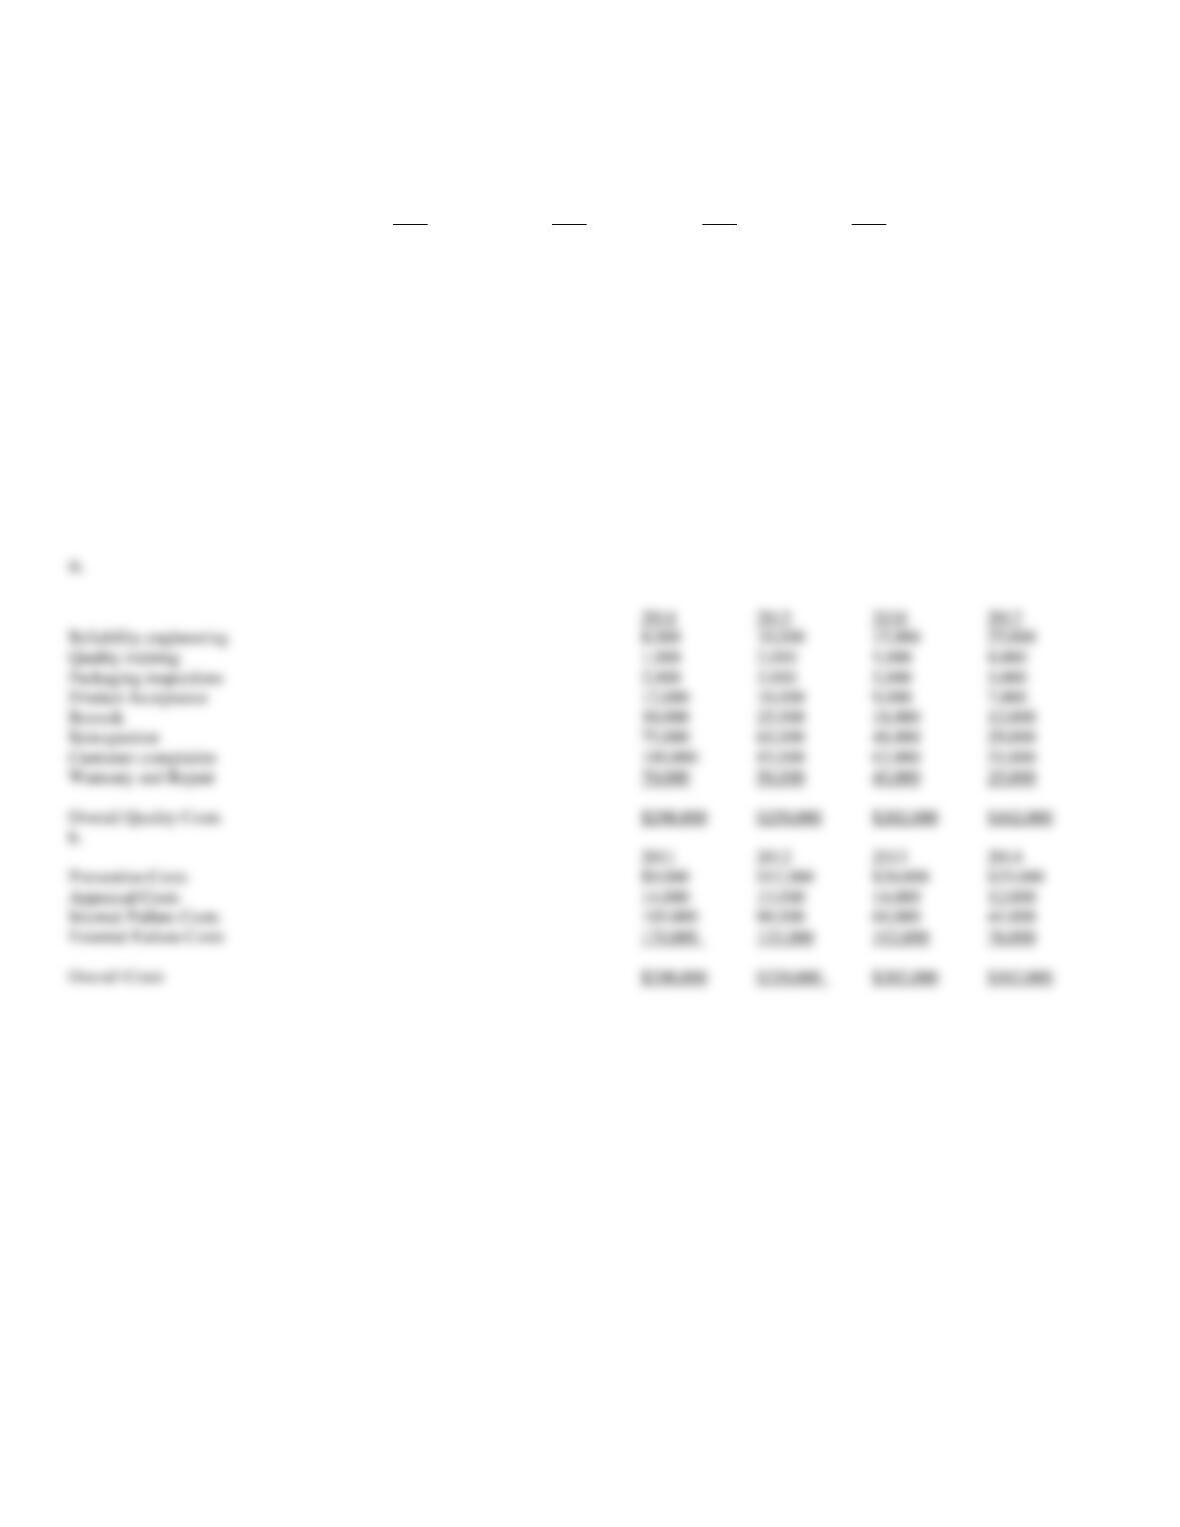
194. At the beginning of the year, Alejandro Corporation initiated a quality improvement program. The program
was successful in reducing scrap and rework costs. To help assess the impact of the quality improvement
program, the following data were collected for the current and preceding years:
2014
2015
2016
2017
Reliability engineering
$8,000
$10,000
$15,000
$25,000
Quality training
1,000
2,000
5,000
8,000
Packaging inspections
2,000
3,000
5,000
5,000
Product Acceptance
12,000
10,000
9,000
7,000
Rework
30,000
25,000
18,000
12,000
Reinspection
75,000
65,000
48,000
29,000
Customer complaints
100,000
85,000
62,000
51,000
Warranty and Repair
70,000
50,000
40,000
25,000
Required:
a. Prepare a multiple-year trend report for overall costs of quality.
b. Prepare a multiple-year trend report for each category of quality costs.
c. Graph the results.
2014
2015
2016
2017
Reliability engineering
8,000
10,000
15,000
25,000
Quality training
1,000
2,000
5,000
8,000
Packaging inspections
2,000
3,000
5,000
5,000
Product Acceptance
12,000
10,000
9,000
7,000
Rework
30,000
25,000
18,000
12,000
Reinspection
75,000
65,000
48,000
29,000
Customer complaints
100,000
85,000
62,000
51,000
Warranty and Repair
70,000
50,000
40,000
25,000
Overall Quality Costs
$298,000
$250,000
$202,000
$162,000
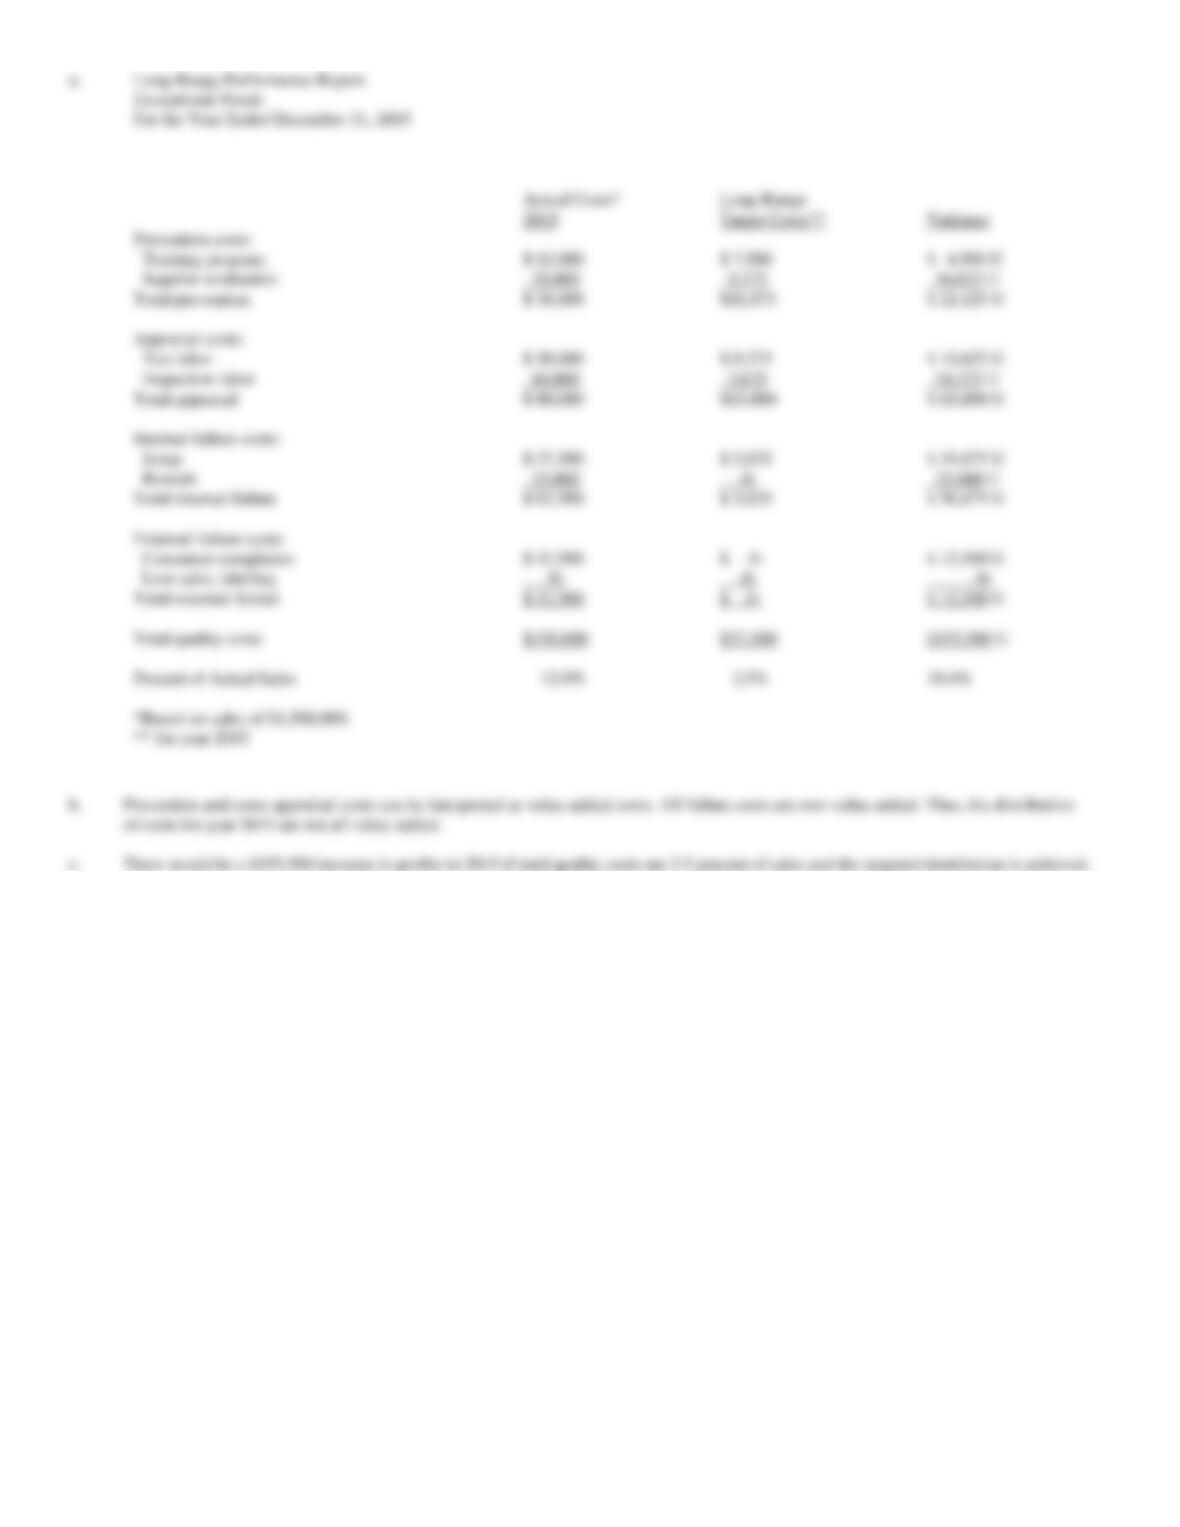
2011
2012
2013
2014
Prevention Costs
$9,000
$12,000
$20,000
$33,000
Appraisal Costs
14,000
13,000
14,000
12,000
Internal Failure Costs
105,000
90,000
66,000
41,000
External Failure Costs
170,000
135,000
102,000
76,000
Overall Costs
$298,000
$250,000
$202,000
$162,000
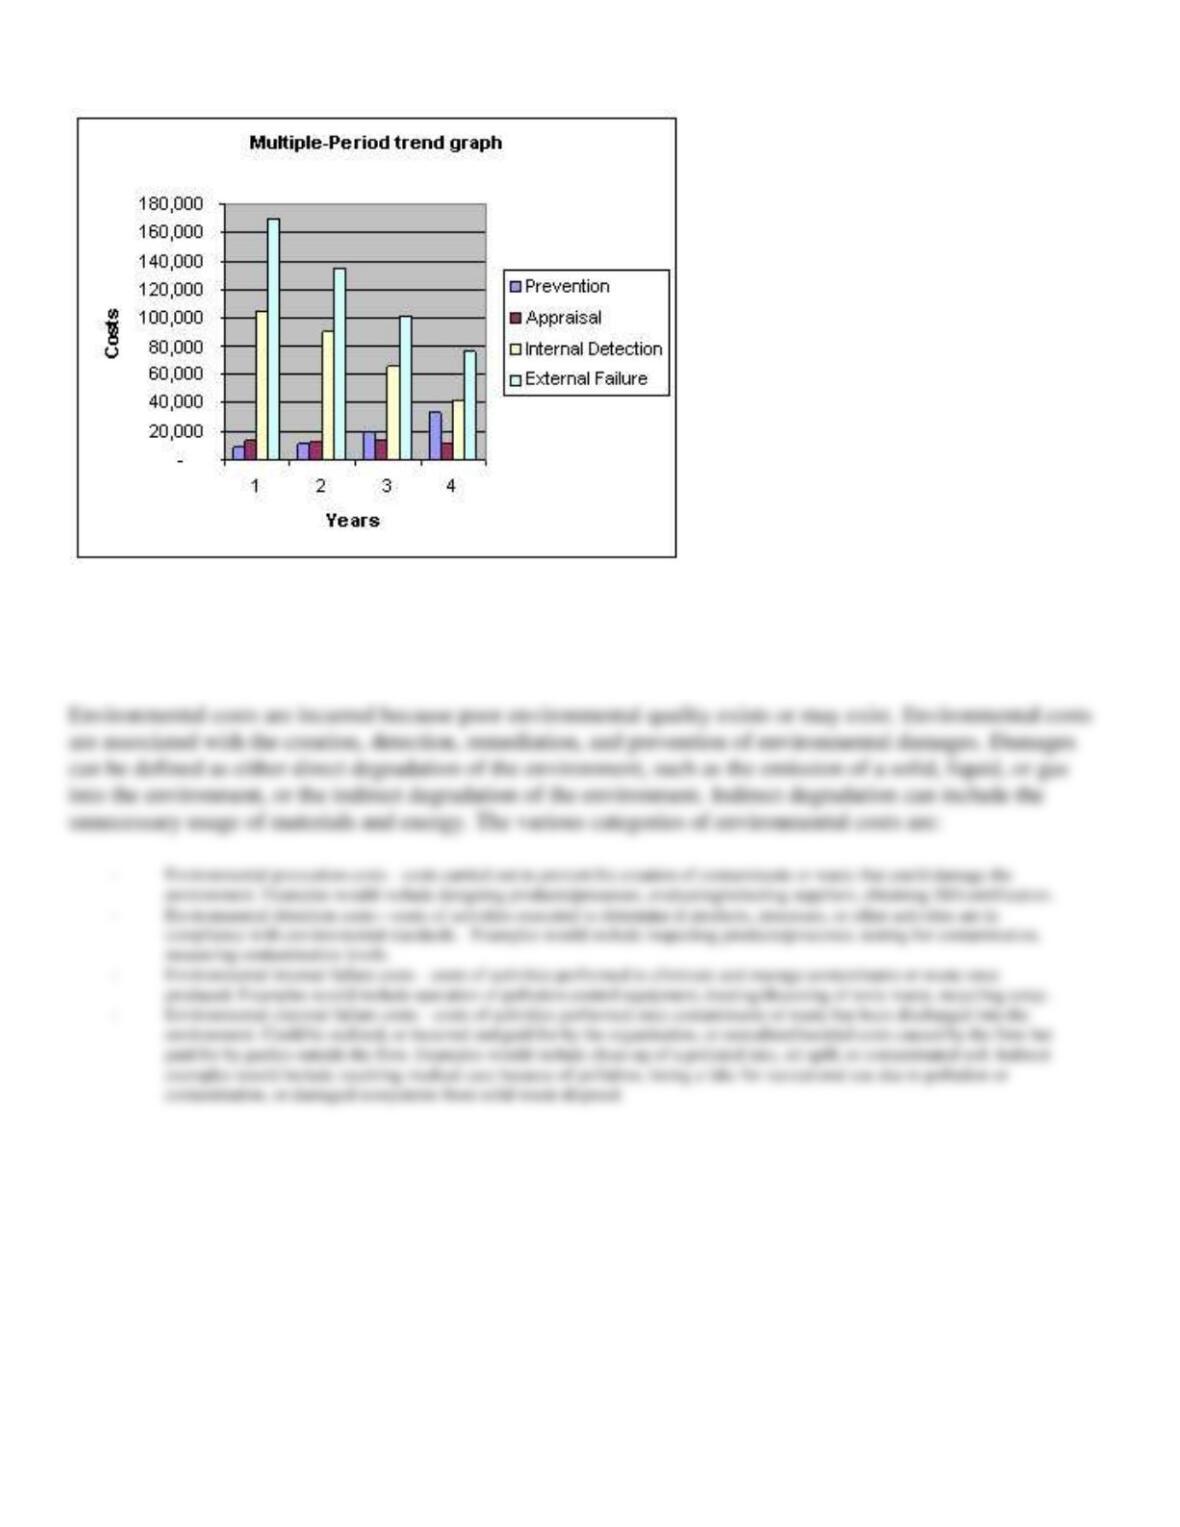
c.
195. Define environmental costs and identify the four categories of environmental costs. Give an example of
each category.
196. Using the abbreviations listed below, indicate for each of the costs whether the cost should be classified as:
P
=
Prevention
D
=
Detection
I
=
Internal Failure
E
=
External Failure
N
=
none of the above
1.
Cleaning up contaminated soil
2.
Designing processes
3.
Recycling scrap
4.
Auditing environmental activities
5.
Testing for contamination
6.
Losing a lake for recreational use
7.
Measuring contamination levels
8.
Recycling products
9.
Maintaining pollution equipment
10.
Evaluating and selecting suppliers
E
1.
Cleaning up contaminated soil
P
2.
Designing processes
I
3.
Recycling scrap
D
4.
Auditing environmental activities
D
5.
Testing for contamination
E
6.
Losing a lake for recreational use
D
7.
Measuring contamination levels
P
8.
Recycling products
I
9.
Maintaining pollution equipment
P
10.
Evaluating and selecting suppliers
197. Using the abbreviations listed below, indicate for each of the costs whether the cost should be classified as:
P
=
Prevention
D
=
Detection
I
=
Internal Failure
E
=
External Failure
N
=
none of the above
1.
Inspecting products and processes
2.
Verifying supplier environmental performance
3.
Testing for contamination
4.
Obtaining ISO 14001 certification
5.
Carrying out environmental studies
6.
Operating pollution control equipment
7.
Cleaning up a polluted lake
8.
Recycling scrap
9.
Recycling products
10.
Cleaning up oil spills
D
1.
Inspecting products and processes
D
2.
Verifying supplier environmental performance
D
3.
Testing for contamination
P
4.
Obtaining ISO 14001 certification
P
5.
Carrying out environmental studies
I
6.
Operating pollution control equipment
E
7.
Cleaning up a polluted lake
I
8.
Recycling scrap
P
9.
Recycling products
E
10.
Cleaning up oil spills
198. At the beginning of the year, Michelina, Inc., initiated an environmental cost reduction program. To help
assess the impact of the environmental cost reduction improvement program, the following data was collected
for the current and preceding year:
Preceding Year
Current Year
Operating costs
$4,000,000
$4,000,000
Designing products
18,000
20,000
Auditing environmental activities
40,000
64,000
Recycling scrap
200,000
180,000
Restoring land to natural state
360,000
320,000
Operating pollution control equipment
250,000
240,000
Testing for contamination
80,000
80,000
Required:
a.
Compute each category of environmental quality costs as a percentage of operating costs for each year.
Prevention costs
Detection costs
Internal failure costs
External failure costs
b.
How much has profit increased as a result of the environmental cost reduction improvements?
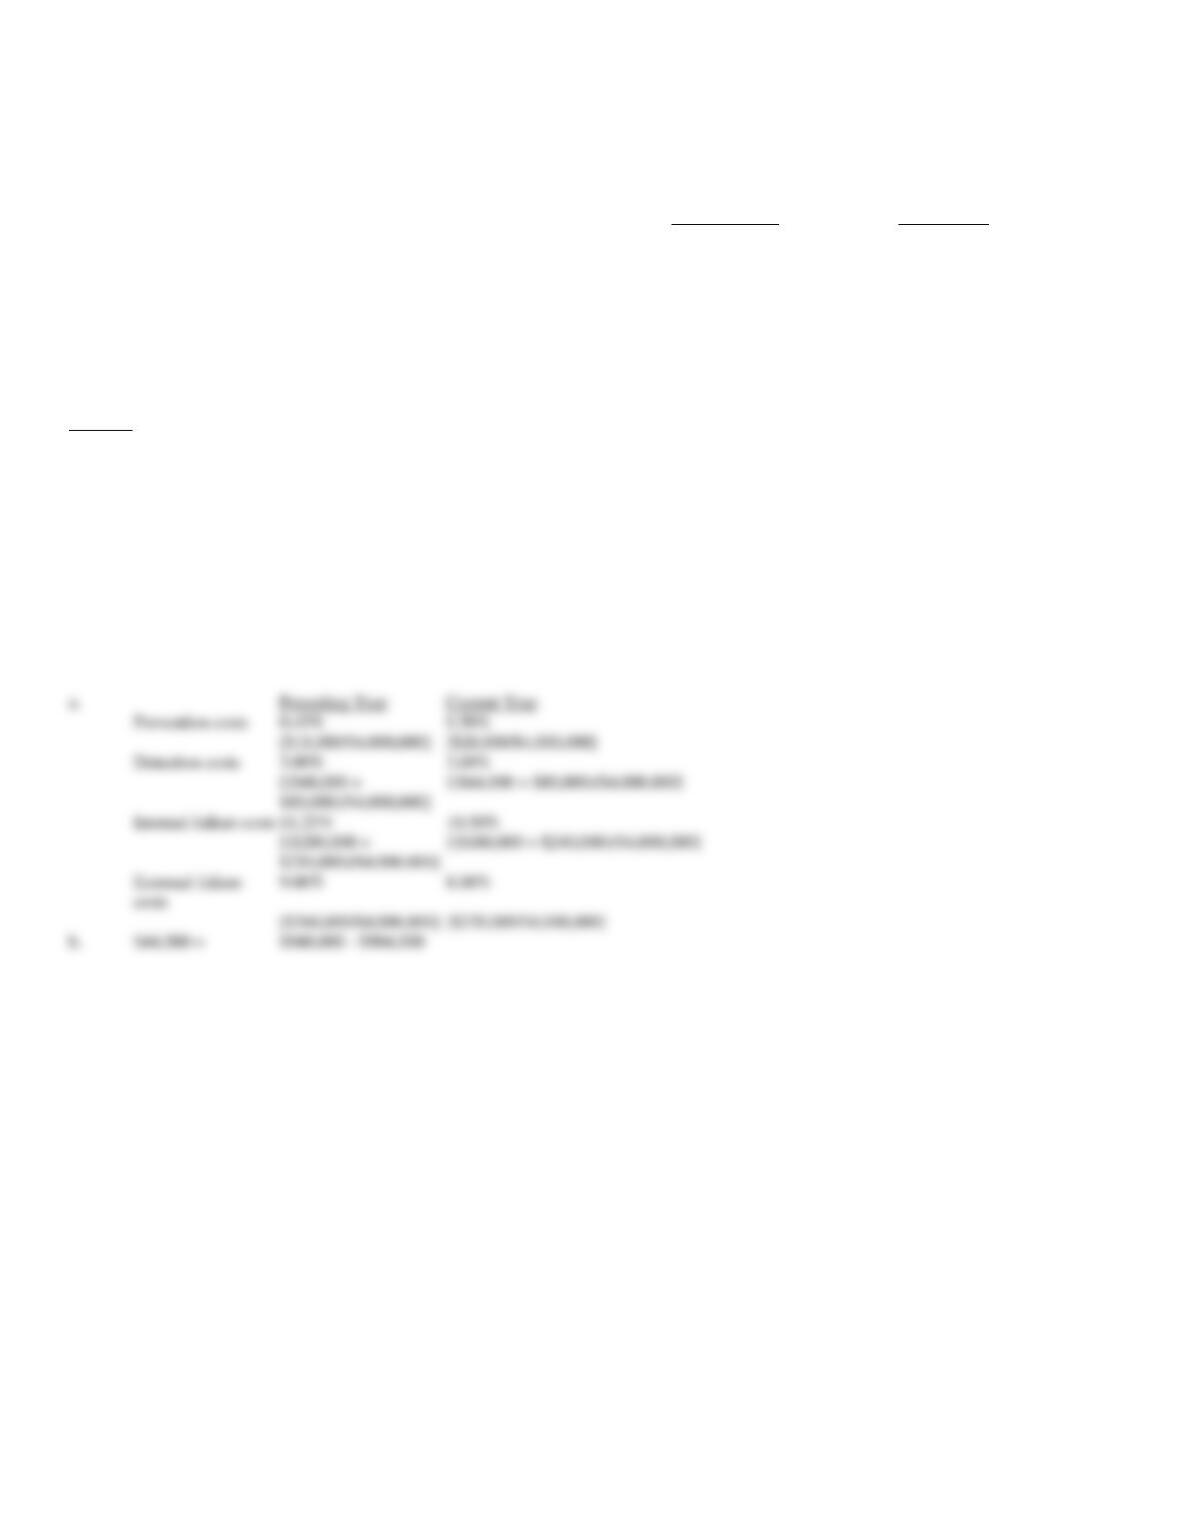
Preceding Year
Current Year
Prevention costs
0.45%
0.50%
[$18,000/$4,000,000]
[$20,000/$4,000,000]
Detection costs
3.00%
3.60%
Internal failure costs
11.25%
10.50%
[$360,000/$4,000,000]
[$320,000/$4,000,000]
$44,000 =
$948,000 – $904,000
199. Amenities Corporation reported the following operating costs and environmental quality costs for the past
four years. Assume that all environmental quality costs are variable and that all changes in the quality cost
ratios are due to an environmental cost reduction program.
Environmental Costs as
Year
Operating Cost
Percent of Operating Costs
1
$2,000,000
23.0
2
2,200,000
20.0
3
2,200,000
16.0
4
2,400,000
12.0
Required:
a.
Compute the environmental quality costs for all four years.
b.
How much did net income increase from Year 1 to Year 2 because of quality improvements? From Year 2 to Year 3? From Year 3 to Year
4?
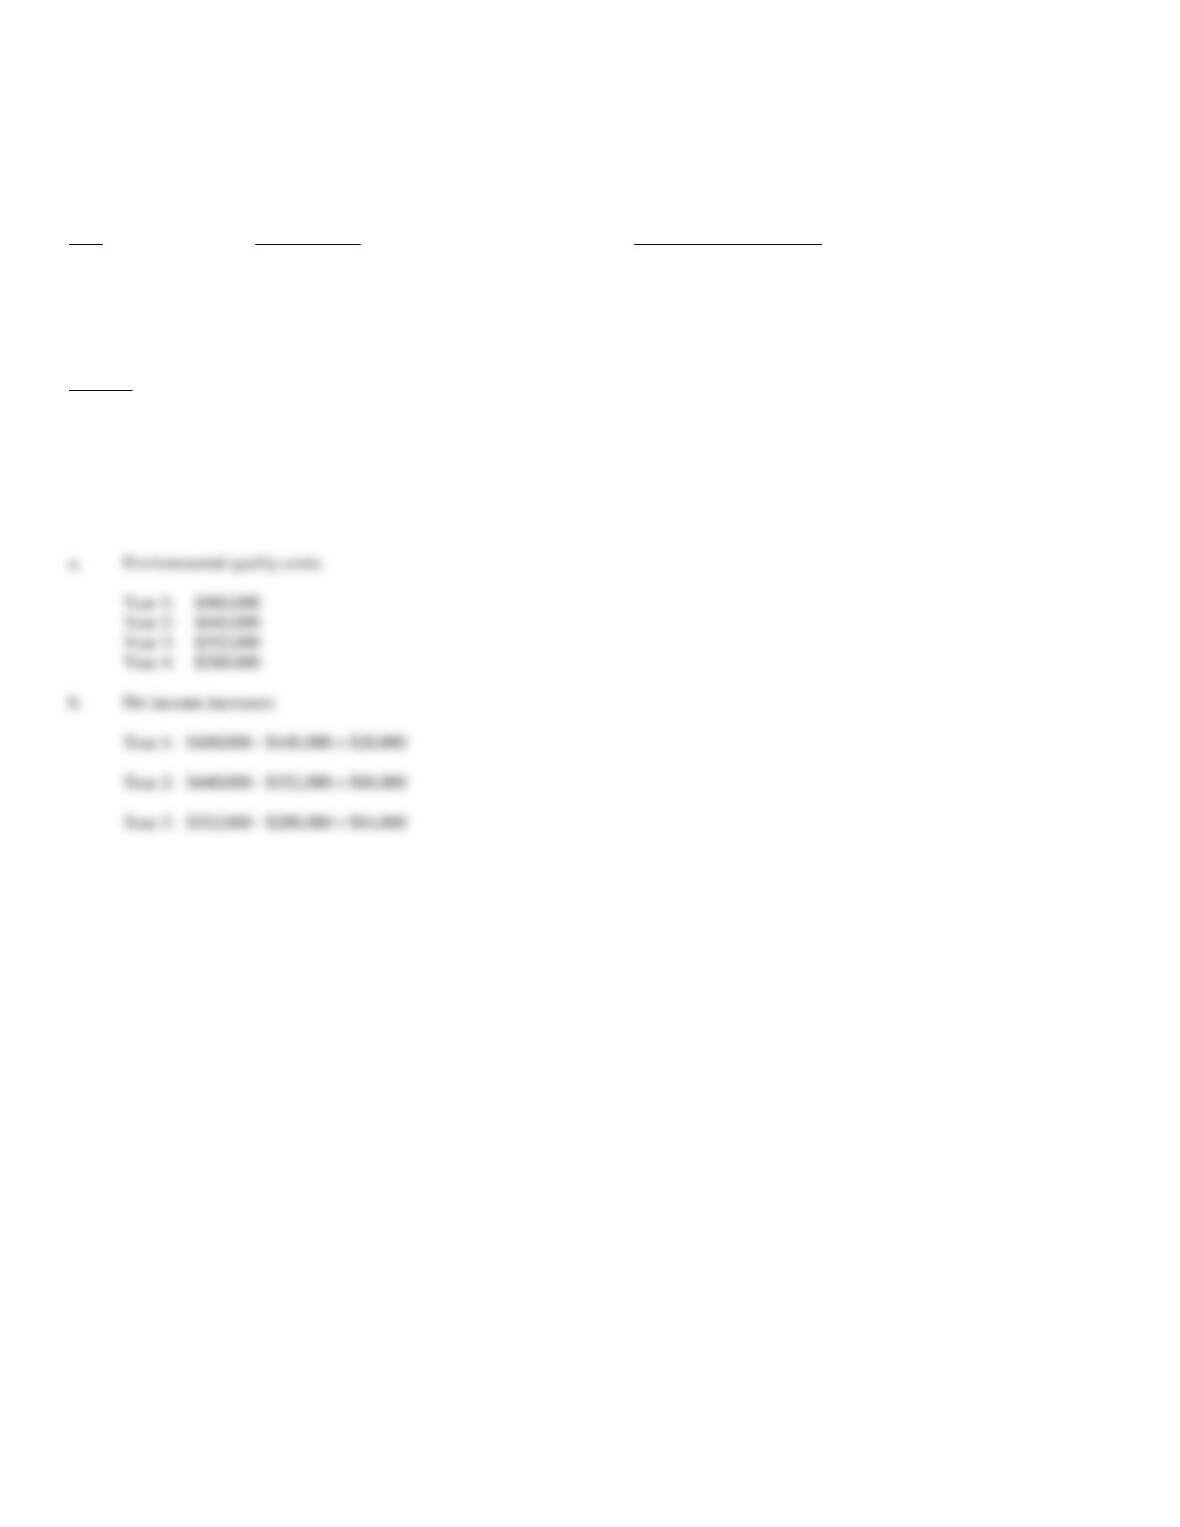
a.
Environmental quality costs:
Year 1: $460,000
Year 2: $440,000
Year 3: $352,000
Year 4: $288,000
Net income increases:
Year 1: $460,000 – $440,000 = $20,000
Year 2: $440,000 – $352,000 = $88,000
Year 3: $352,000 – $288,000 = $64,000
200. At the beginning of the year, Heathrow, Inc., initiated an environmental cost reduction program. To help
assess the impact of the environmental cost reduction improvement program, the following data was collected
for the current and preceding year:
Preceding Year
Operating costs
$2,500,000
Cost reduction, contaminants (ongoing)
187,500
Designing products
10,000
Auditing environmental risks
12,500
Recycling scrap
62,500
Recycling income
125,000
Restoring land to natural state
75,000
Operating pollution control equipment
62,500
Packaging cost reductions ( current year)
150,000
Testing for contamination
100,000
Required:
a.
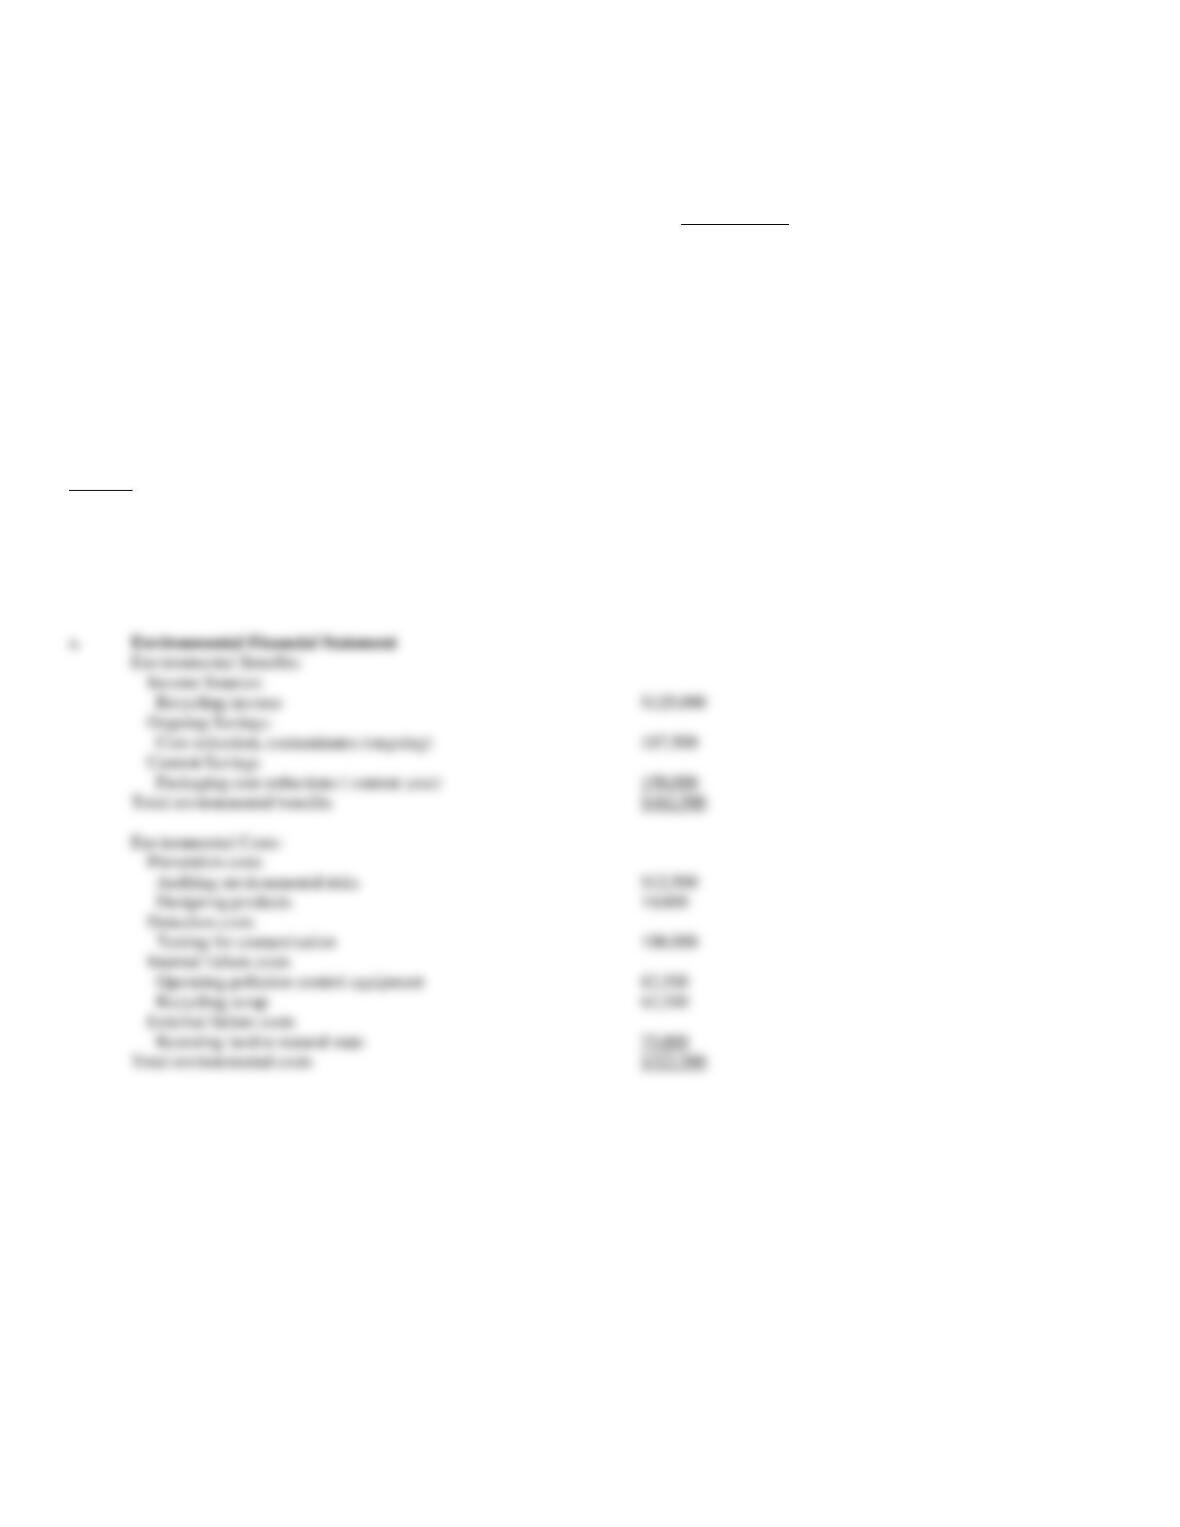
Prepare an environmental financial statement for the year.
Environmental Benefits:
Income Sources:
Recycling income
$125,000
Ongoing Savings:
Cost reduction, contaminants (ongoing)
187,500
Current Savings
Packaging cost reductions ( current year)
150,000
Environmental Costs:
Prevention costs
$12,500
Designing products
10,000
Detection costs
Testing for contamination
100,000
Internal failure costs
Operating pollution control equipment
62,500
Recycling scrap
62,500
External failure costs
Restoring land to natural state
75,000
Total environmental costs
$322,500
201. Maldovar Chemical produces a number of chemical products, two of which are Product A and Product B.
The controller and environmental manager have identified the following environmental activities and costs
associated with the two products:
Product A
Product B
Pounds produced
1,000,000
2,500,000
Packaging materials (pounds)
300,000
150,000
Energy usage (kilowatt hours)
100,000
50,000
Toxic releases (pounds into air)
250,000
50,000
Pollution control (machine hours)
40,000
10,000
Costs of activities:
Using packaging materials
$450,000
Using energy
120,000
Releasing toxins (fines)
60,000
Operating pollution control equipment
140,000
Required:
a.
Calculate the environmental cost per pound for each product.
b.
Which of the two appears to cause the most degradation to the environment?
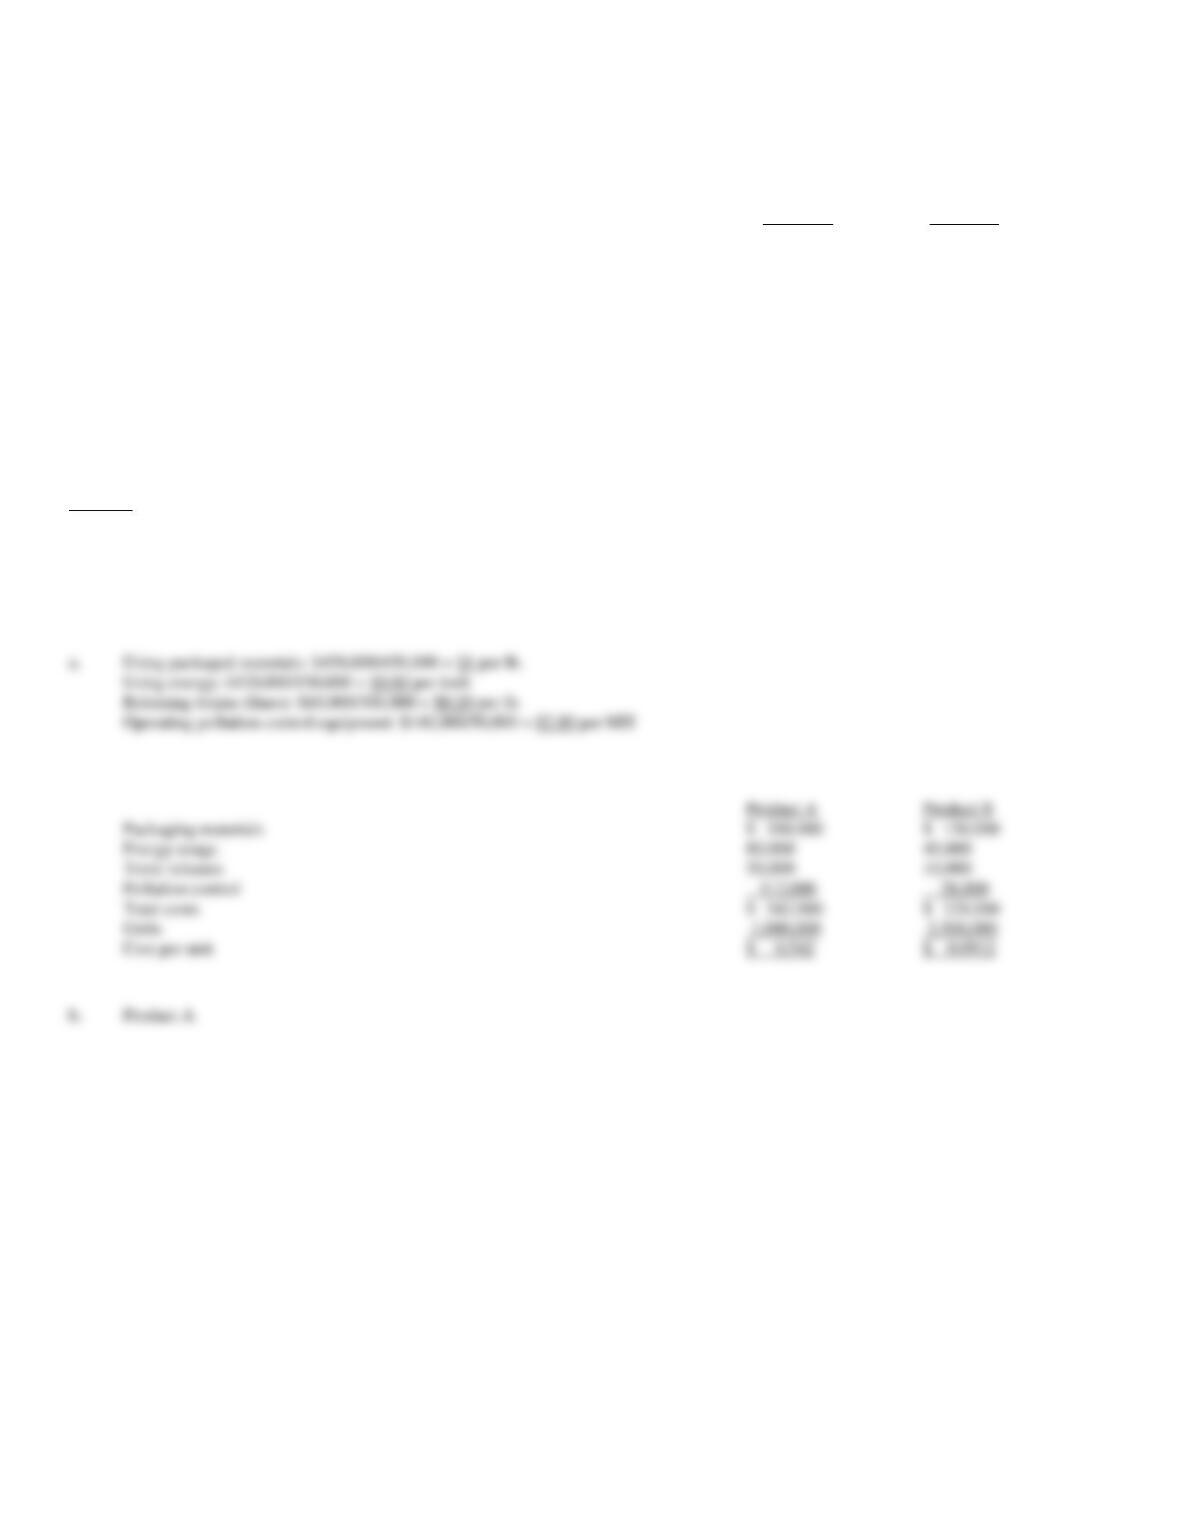
a.
Using packaged materials: $450,000/450,000 = $1 per lb.
Using energy: $120,000/150,000 = $0.80 per kwh
Releasing toxins (fines): $60,000/300,000 = $0.20 per lb.
Operating pollution control equipment: $140,000/50,000 = $2.80 per MH
Product A
Product B
Packaging materials
$ 150,000
Energy usage
80,000
40,000
Toxic releases
50,000
10,000
Pollution control
112,000
28,000
Total costs
$ 542,000
$ 228,000
Units
1,000,000
2,500,000
Cost per unit
$ 0.542
$ 0.0912
b.
Product A
202. Growfast Fertilizer Company produces a number of chemical products, two of which are Product X and
Product Y. The controller and environmental manager have identified the following environmental activities
and costs associated with the two products:
Product X
Product Y
Gallons produced
312,500
781,250
Energy usage (kilowatt hours)
31,250
15,625
Pollution control (machine hours)
12,500
3,125
Toxic releases (pounds into air)
78,125
15,625
Packaging materials (pounds)
93,750
46,875
Costs of activities:
Using packaging materials
$281,250
Using energy
75,000
Releasing toxins (fines)
37,500
Operating pollution control equipment
87,500
Required:
a.
Calculate the environmental cost per pound for each product.
b.
Which of the two appears to cause the most degradation to the environment?
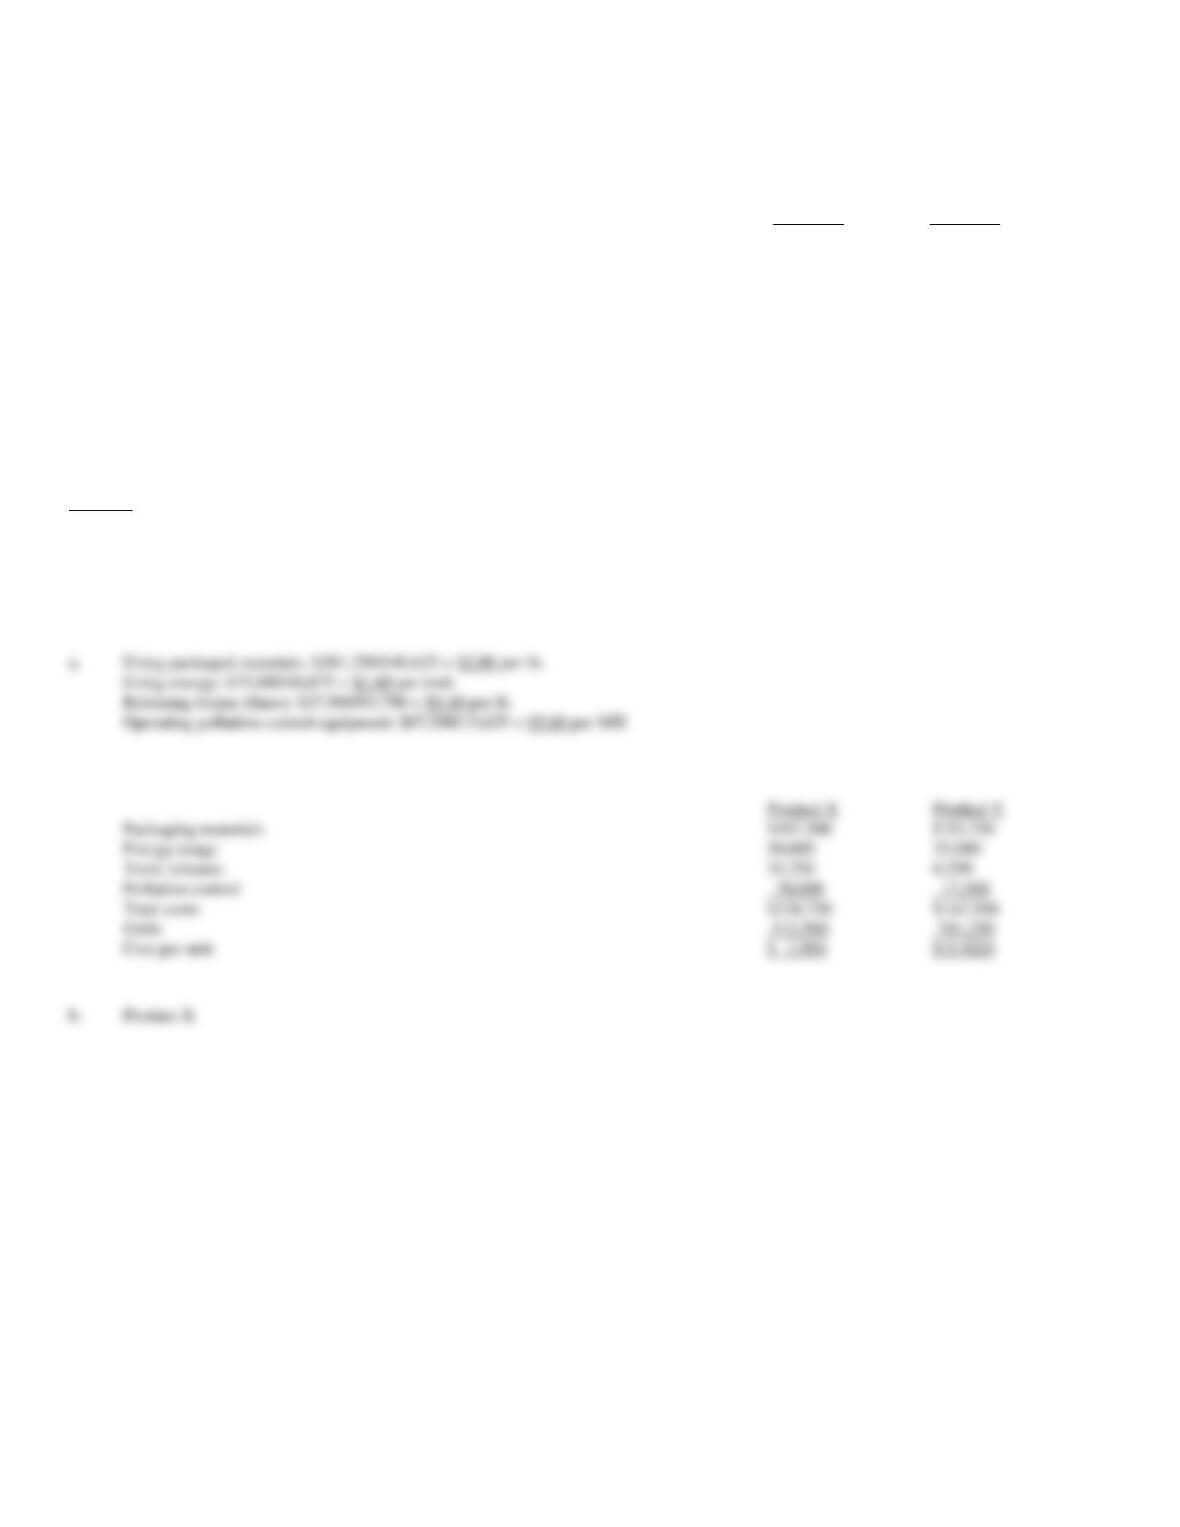
a.
Using packaged materials: $281,250/140,625 = $2.00 per lb.
Using energy: $75,000/46,875 = $1.60 per kwh
Releasing toxins (fines): $37,500/93,750 = $0.40 per lb.
Operating pollution control equipment: $87,500/15,625 = $5.60 per MH
Product X
Product Y
Packaging materials
$187,500
$ 93,750
Energy usage
50,000
25,000
Toxic releases
31,250
6,250
Pollution control
70,000
17,500
Total costs
$338,750
$142,500
Units
312,500
781,250
Cost per unit
$ 1.084
$ 0.1824
b.
Product X