Financial Statement Analysis ♦ 689
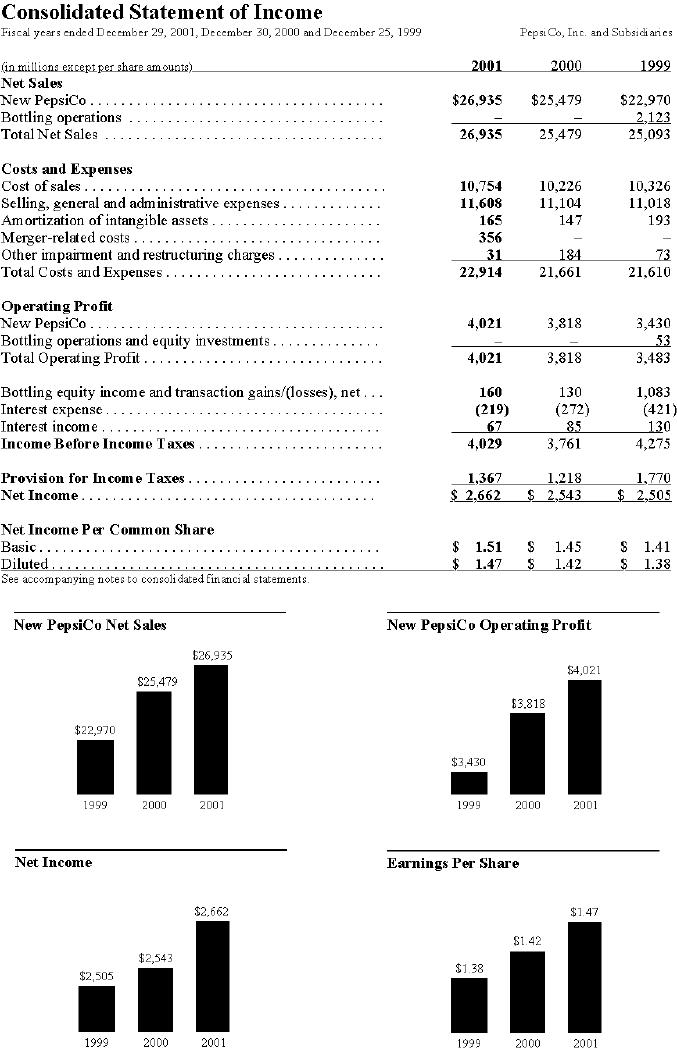
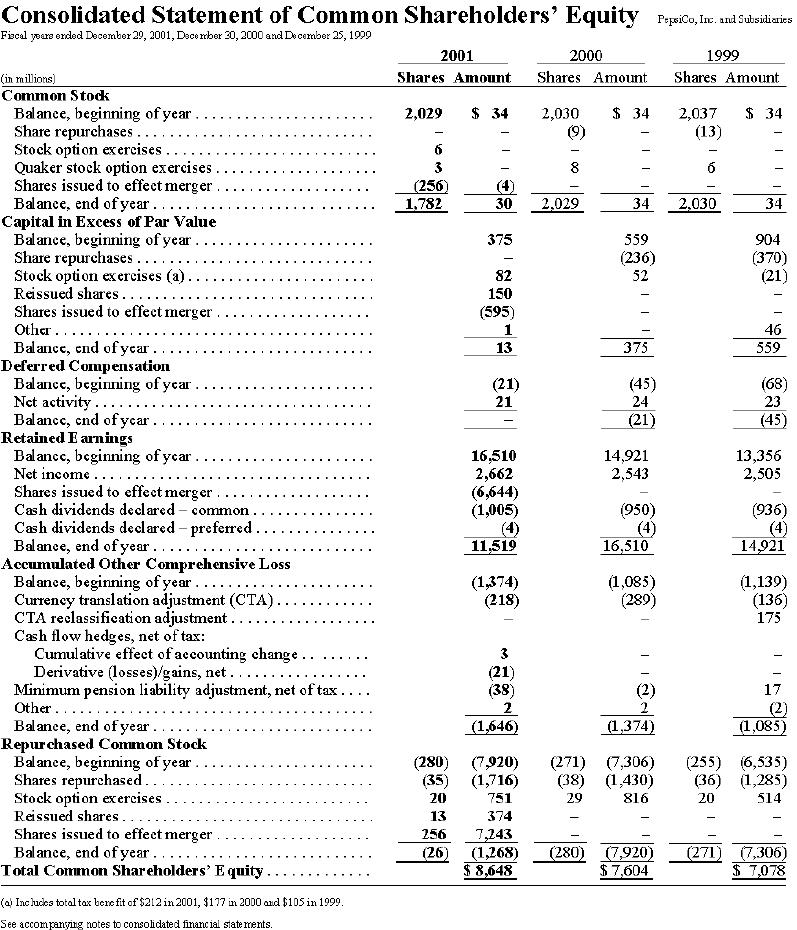
50. Refer to PepsiCo’s Financial Statements. Compute the rate earned on stockholders’ equity for
PepsiCo for 2001.
a.
2.62
b.
12.3%
c.
32.8%
d.
None of the above
51. Refer to PepsiCo’s Financial Statements. Compute the rate earned on total assets for PepsiCo for
2001.
a.
12.5%
b.
6.1%
c.
15%
d.
None of the above
690 ♦ Chapter 14
52. Refer to PepsiCo’s Financial Statements. Compute the accounts receivable turnover for PepsiCo
for 2001.
a.
2.5
b.
12.6
c.
30 days
d.
2/10 net 30
53. Refer to PepsiCo’s Financial Statements. Compute the number of days’ sales in receivables
PepsiCo for 2001.
a.
365
b.
2/10 net 30
c.
29
d.
5.9
54. Refer to PepsiCo’s Financial Statements. Compute the inventory turnover for PepsiCo for 2001.
a.
8.6
b.
10
c.
365
d.
30 days
55. Refer to PepsiCo’s Financial Statements. Compute the number of days’ sales in inventory for
PepsiCo for 2001.
a.
365
b.
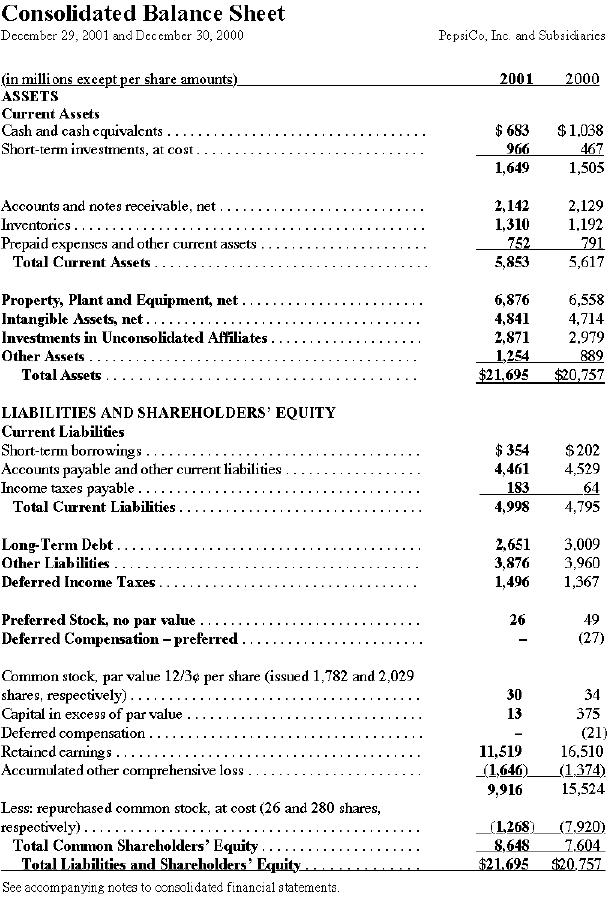
1,310
c.
30
d.
44.5
56. Refer to PepsiCo’s Financial Statements. Compute the current ratio for PepsiCo for 2001.
a.
1.17
b.
$21,695
c.
0.14
d.
0.19

Financial Statement Analysis ♦ 691
57. Refer to PepsiCo’s Financial Statements. Compute the quick ratio for PepsiCo for 2001.
a.
1.17
b.
0.76
c.
1.00
d.
None of the above
58. Refer to PepsiCo’s Financial Statements. What is the total of the Quick Assets for PepsiCo for
2001?
a.
1,649
b.
5,853
c.
21,695
d.
3,791
59. Refer to PepsiCo’s Financial Statements. Compute the ratio of liabilities to stockholders’ equity for
PepsiCo for 2001.
a.
1.5
b.
0.66
c.
1.0
d.
None of the above
60. Refer to PepsiCo’s Financial Statements. Compute the number of times interest charges are earned
for PepsiCo for 2001.
a.
19.4
b.
219
c.
12.1
d.
None of the above
TRUE/FALSE
1. Horizontal analysis considers the percentage change in a specific account over time.
2. The percentage analysis of increases or decreases in related items in comparative financial
statements is called vertical analysis.
692 ♦ Chapter 14
3. Using vertical analysis, each income statement item is stated as a percent of total assets.
4. The following income statement is an illustration of vertical analysis.
Change
2006
2005
Amount
Percent
Total Revenue
$500
$450
$50
10%
Cost of Goods Sold
300
260
40
15.38%
Gross Profit
200
190
10
5.26%
5. Vertical analysis of the balance sheet, each asset item is expressed as a percent of total current
assets.
6. Common-size statements are not useful in making comparisons between periods.
7. The rate earned on total assets measures the profitability of total assets, by considering how the
assets are financed.
8. It is possible to analyze profitability by combining net income and balance sheet information into
a single ratio.
9. The cost of capital is the cost of financing operations from both debt and common stock,
expressed in percentage terms.

Financial Statement Analysis ♦ 693
10. The leverage formula shows the relationship between the rate earned on stockholders’ equity and
the rate earned on total assets.
11. The rate earned on total assets can be broken into margin analysis and asset efficiency.
12. The size and makeup of accounts receivable are usually fairly constant during business operations.
13. Cash collected from receivables improves liquidity.
14. An excessive amount of inventory reduces liquidity by tying up funds.
15. Fixed asset turnover is a measure of fixed asset efficiency.
16. In common size financial statements, all items are expressed in percentages.
17. The rate earned on stockholders ‘equity is part of leverage analysis.
18. The number of days’ sales in receivables is an estimate of the length of time the accounts
receivable has been outstanding.
694 ♦ Chapter 14
19. Positive leverage causes the rate earned on stockholders’ equity to exceed the rate earned on total
assets.
20. If a company borrows money at a 7% interest rate, it must generate a rate of return below 7% to be
successful.
21. Firms with significant debt and negative leverage are candidates for bankruptcy.
22. Positive leverage can improve a firm’s financial performance, without risk.
23. To be useful in assessing solvency, a ratio must relate to a business’s ability to pay its liabilities.
24. The current ratio does NOT consider the makeup of current assets.
25. For corporations with high ratios of debt to equity, the relative risk of the debt holders is normally
measured as the number of shares of stock to the interest charges.
26. The stock price and / or dividend performance are the analytical approaches used by shareholders
to assess performance of their equity investments.
27. Earnings per share is a profitability measure used by investors that is often quoted in the financial
press and is reported in the income statement.
Financial Statement Analysis ♦ 695
28. Earnings per share is generally not compared between companies because it is a relative
performance measure.
29. The price-earnings ratio is an indicator of past performance.
30. A ratio that is used by investors to assess alternative stock investments is dividend yield.
31. The Management Discussion and Analysis required by the SEC usually (among other things)
discusses social implications of corporate policies.
32. The Management Discussion and Analysis discusses significant risk exposure and off balance
sheet financing.
33. An unqualified or clean opinion given by the CPAs who conduct the financial statement audit
indicates that the financial statements fairly represent the financial condition of the company.
ESSAY
1. Discuss and describe horizontal analysis.
696 ♦ Chapter 14
2. Discuss and describe vertical analysis.
3. Discuss the importance of issuing comparative financial statements as opposed to statements for a
single period.
4. What are common size statements and how are they useful?
5. Discuss the importance of the rate of return on stockholders’ equity and the rate earned on total
assets.
Financial Statement Analysis ♦ 697
6. What does the “cost of capital” mean, and how is it used to benchmark investments and projects?
7. It is important to know the rate of return on total assets and the efficiency of those assets. Discuss
how this analysis is accomplished in relation to the DuPont formula.
8. Why is it important to analyze how often accounts receivables turnover?
698 ♦ Chapter 14
9. Discuss some of the reasons that inventory analysis is important.
10. Discuss the similarities and differences between the quick and current ratios.
Financial Statement Analysis ♦ 699
PROBLEM
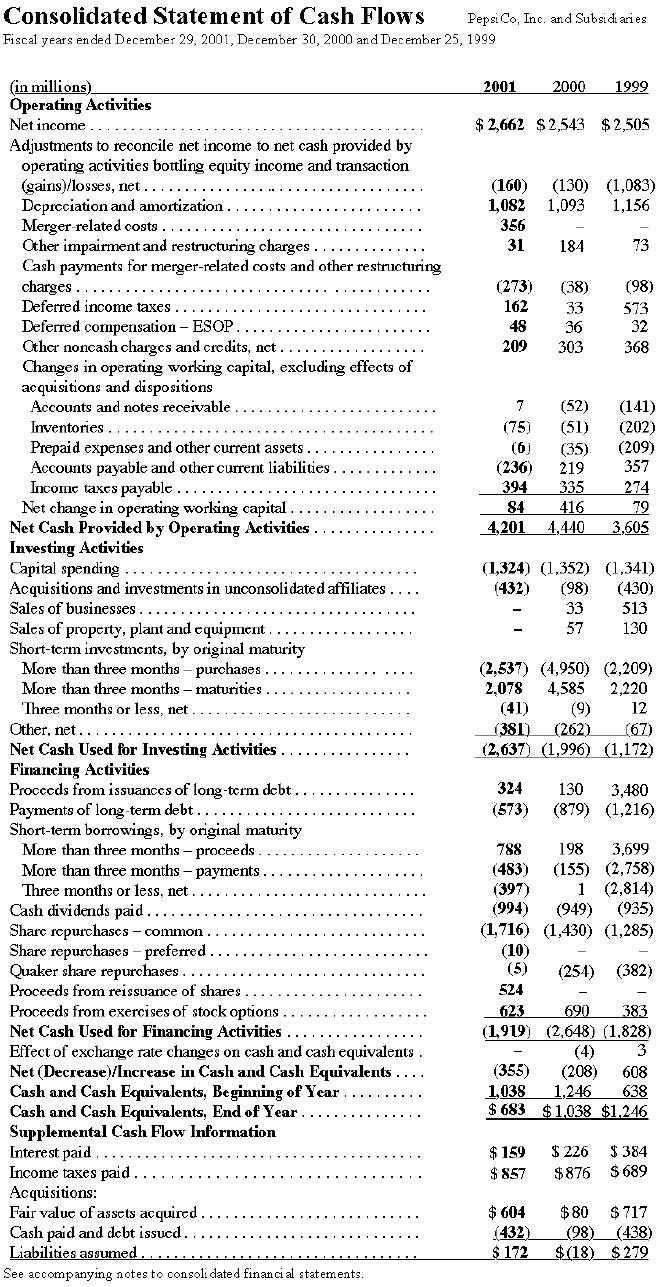
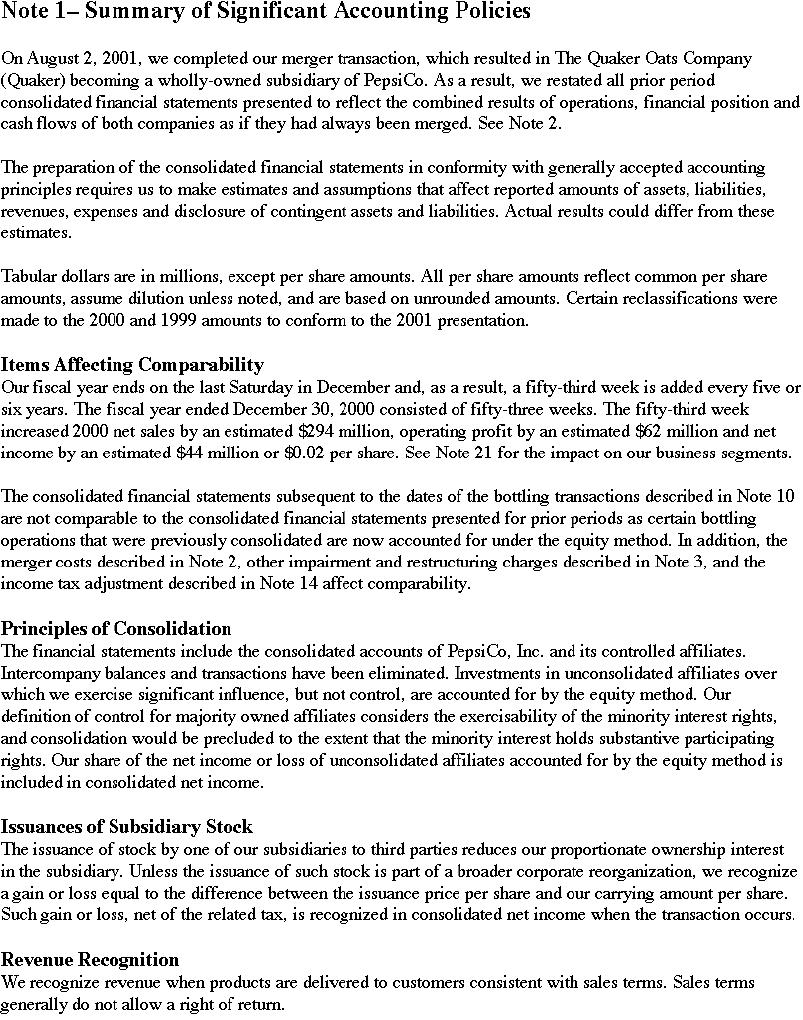
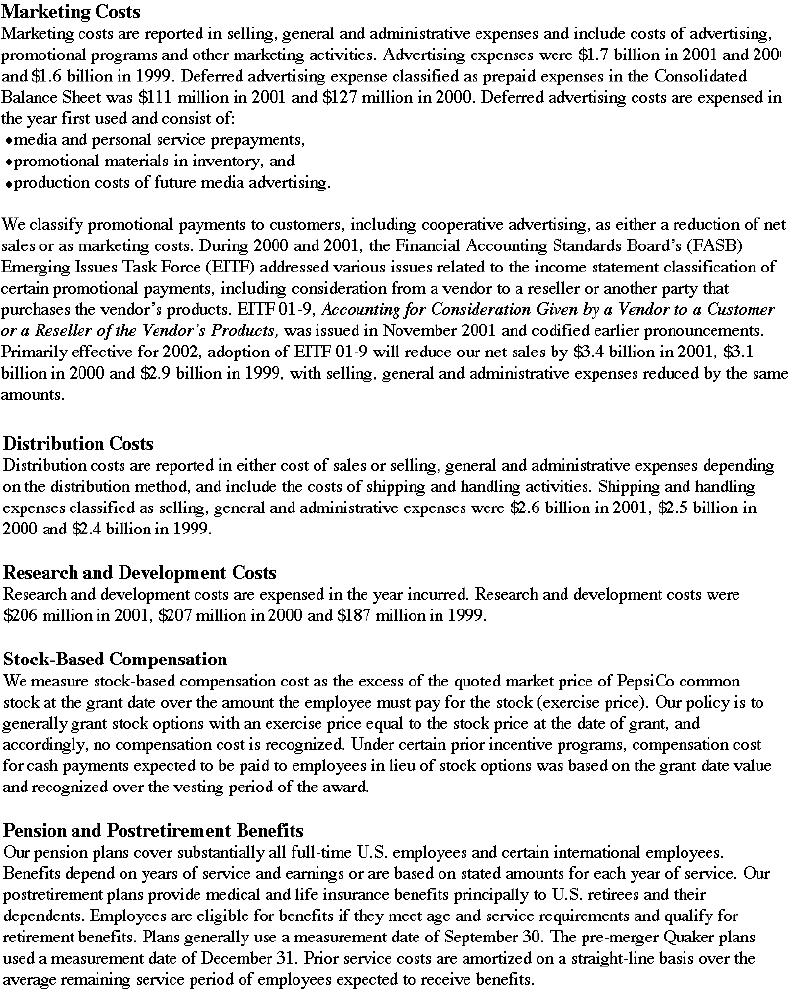
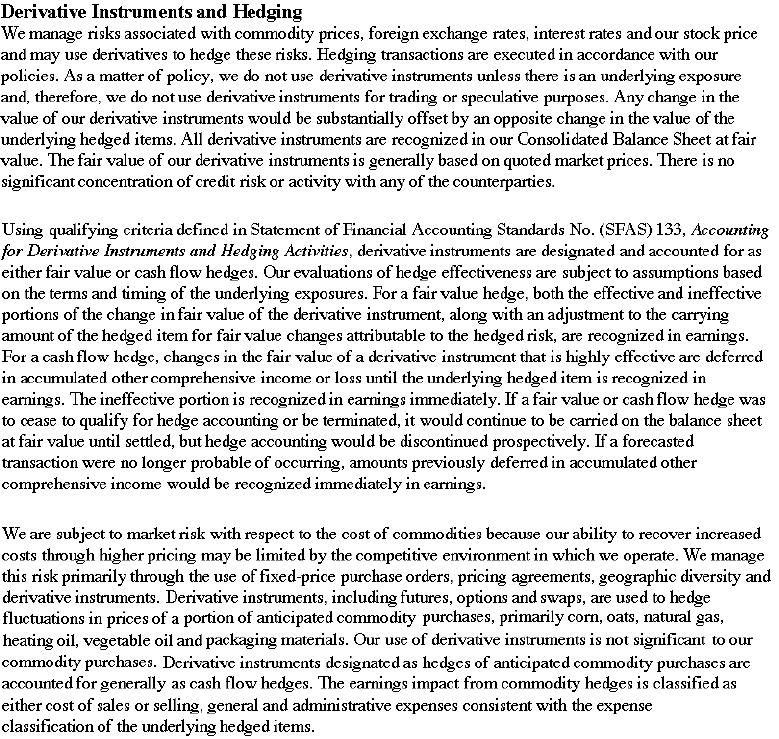
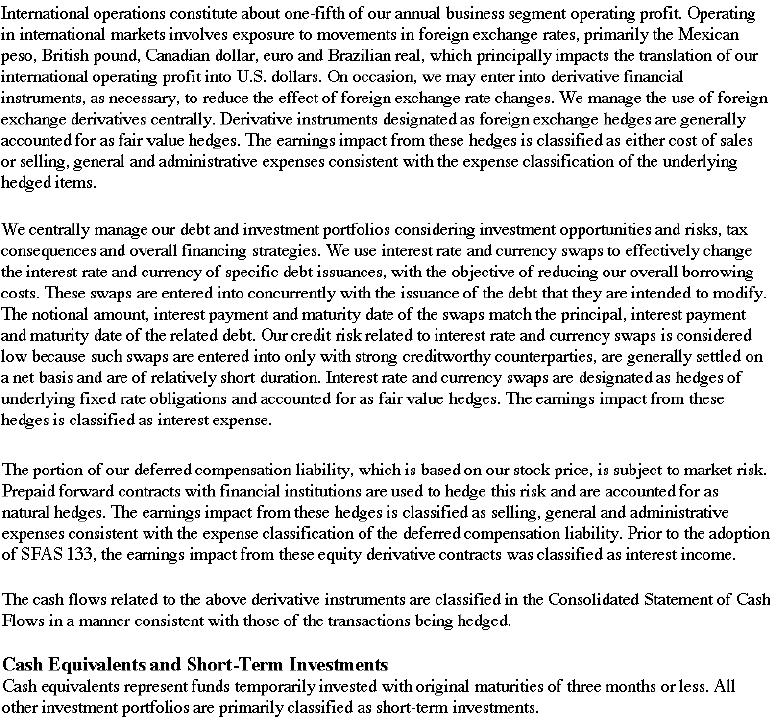
PepsiCo’s Financial Statements
Answer the following question(s) using these selected portions of PepsiCo’s financial statements.
700 ♦ Chapter 14
Financial Statement Analysis ♦ 701
702 ♦ Chapter 14
Financial Statement Analysis ♦ 703
704 ♦ Chapter 14
Financial Statement Analysis ♦ 705
706 ♦ Chapter 14