67. Graham Pottery Inc.
Graham Pottery Inc. produces an item that gives rise to the following activities:
Activity
Hours
Processing (two departments)
25
Inspecting
2
Rework
1
Moving (three moves)
6
Waiting (for the second process)
18
Storage (before delivery to the customer)
24
Refer to the Graham Pottery Inc. information above. The total manufacturing cycle time is:
68. Graham Pottery Inc.
Graham Pottery Inc. produces an item that gives rise to the following activities:
Activity
Hours
Processing (two departments)
25
Inspecting
2
Rework
1
Moving (three moves)
6
Waiting (for the second process)
18
Storage (before delivery to the customer)
24
Refer to the Graham Pottery Inc. information above. The manufacturing cycle efficiency is:

69. Picture Puzzle Company
The Picture Puzzle Company has the following estimates for producing a single batch of 500 custom-made
puzzles:
Wait time
10 days
Inspection time
1 hour
Processing time
3 days
Move time
1 day
Refer to the Picture Puzzle Company information above. The total value-added time is:
70. Picture Puzzle Company
The Picture Puzzle Company has the following estimates for producing a single batch of 500 custom-made
puzzles:
Wait time
10 days
Inspection time
1 hour
Processing time
3 days
Move time
1 day
Refer to the Picture Puzzle Company information above. The total non-value-added time is:
71. Grandma’s Jellies Inc.
Grandma’s Jellies Inc. produces and distributes a variety of jellies. Two hundred jars of jelly are produced in a
single batch. The following activities are performed per batch:
Activity
Hours
Processing (two departments)
6
Inspecting
1
Moving (three moves)
3
Waiting (for the second process)
4
Storage (before delivery to the customer)
10
Refer to the Grandma’s Jellies Inc. information above. The manufacturing cycle time per batch is:
72. Grandma’s Jellies Inc.
Grandma’s Jellies Inc. produces and distributes a variety of jellies. Two hundred jars of jelly are produced in a
single batch. The following activities are performed per batch:
Activity
Hours
Processing (two departments)
6
Inspecting
1
Moving (three moves)
3
Waiting (for the second process)
4
Storage (before delivery to the customer)
10
Refer to the Grandma’s Jellies Inc. information above. The manufacturing cycle efficiency per batch is:

73. Boone Manufacturing
Boone Manufacturing produces a variety of lamp shades which it sells to retail stores throughout the country.
The following data is available for the year:
Units started into production
200,000
Total good units completed
185,000
Total hours of value-added production time
100,000
Total production hours
150,000
Refer to the Boone Manufacturing information above. What is the manufacturing cycle time efficiency for the year?
74. Boone Manufacturing
Boone Manufacturing produces a variety of lamp shades which it sells to retail stores throughout the country.
The following data is available for the year:
Units started into production
200,000
Total good units completed
185,000
Total hours of value-added production time
100,000
Total production hours
150,000
Refer to the Boone Manufacturing information above. What is the total throughput per production hour?
75. B & B Inc.
B & B Inc. manufactures and produces widgets and has the following data available for the year:
Units started into production
160,000
Total good units completed
140,000
Total hours of value-added production time
170,000
Total production hours
250,000
Refer to the B & B Inc. information above. What is the manufacturing cycle time efficiency for the year?
76. B & B Inc.
B & B Inc. manufactures and produces widgets and has the following data available for the year:
Units started into production
160,000
Total good units completed
140,000
Total hours of value-added production time
170,000
Total production hours
250,000
Refer to the B & B Inc. information above. What is the total throughput per production hour?
77. Why are non-financial measures necessary in today’s business environment?
78. How does the balanced scorecard approach differ from traditional approaches to performance evaluation?
79. What are the four perspectives looked at by the balanced scorecard approach?
80. Both traditional financial measures of performance and the balanced scorecard approach examine financial
factors, but how does their appraisal of financial factors differ?
81. Describe the customer perspective of the balanced scorecard and provide an example of a critical success
factor for this perspective.
82. Describe the internal business perspective of the balanced scorecard and provide an example of a critical
success factor for this perspective.
83. Describe the learning and growth perspective of the balanced scorecard and provide an example of a critical
success factor for this perspective.
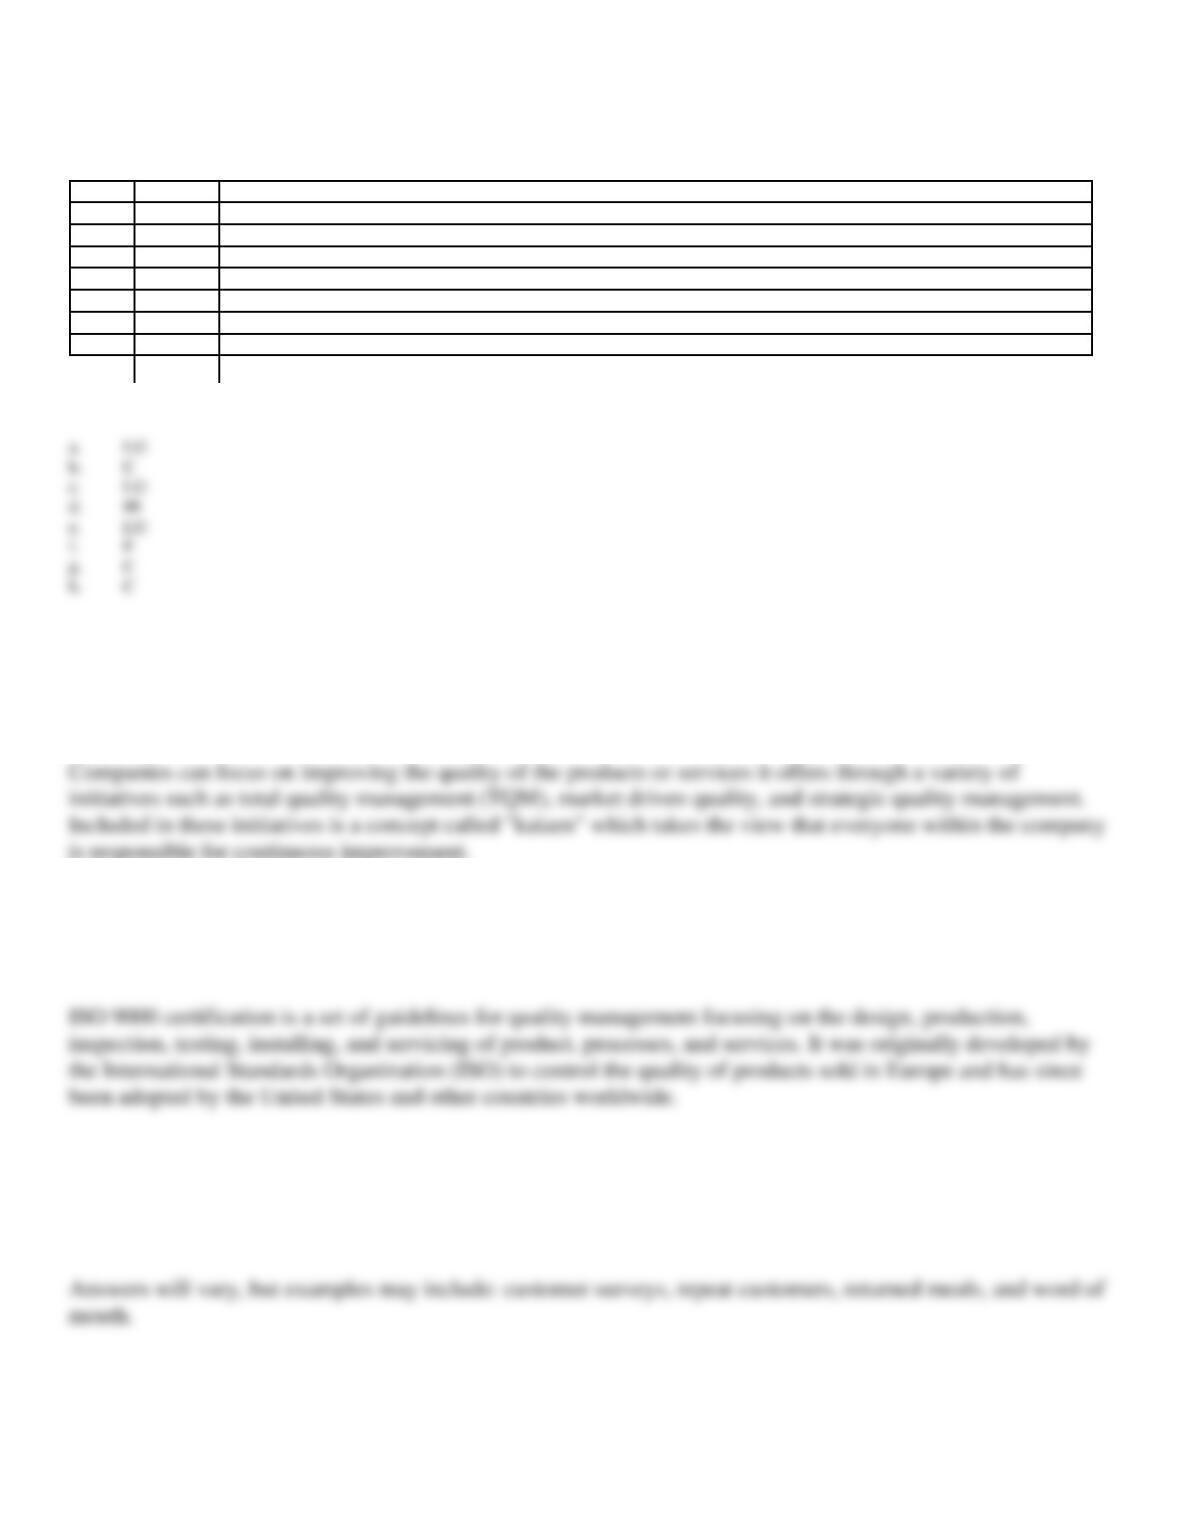
84. Match the following critical success factors with the appropriate perspective of the balanced scorecard. Use
the following key: F = Financial, C = Customer, IB = Internal business, and LG = Learning and growth.
a.
the efficient and effective use of employees
b.
increasing the quality of products and services
c.
increasing the number of new products
d.
improving quality throughout the production process
e.
increasing information systems capabilities
f.
increasing ROI
g.
reducing delivery time
h.
increasing customer satisfaction
85. Describe one method that a company might use to improve or monitor the quality of its products or
services.
86. What is ISO 9000 certification?
87. You are the manager of a new restaurant in town. List one method that you might use as a measure of
quality.
a.
b.
C
c.
d.
IB
e.
f.
F
g.
C
C
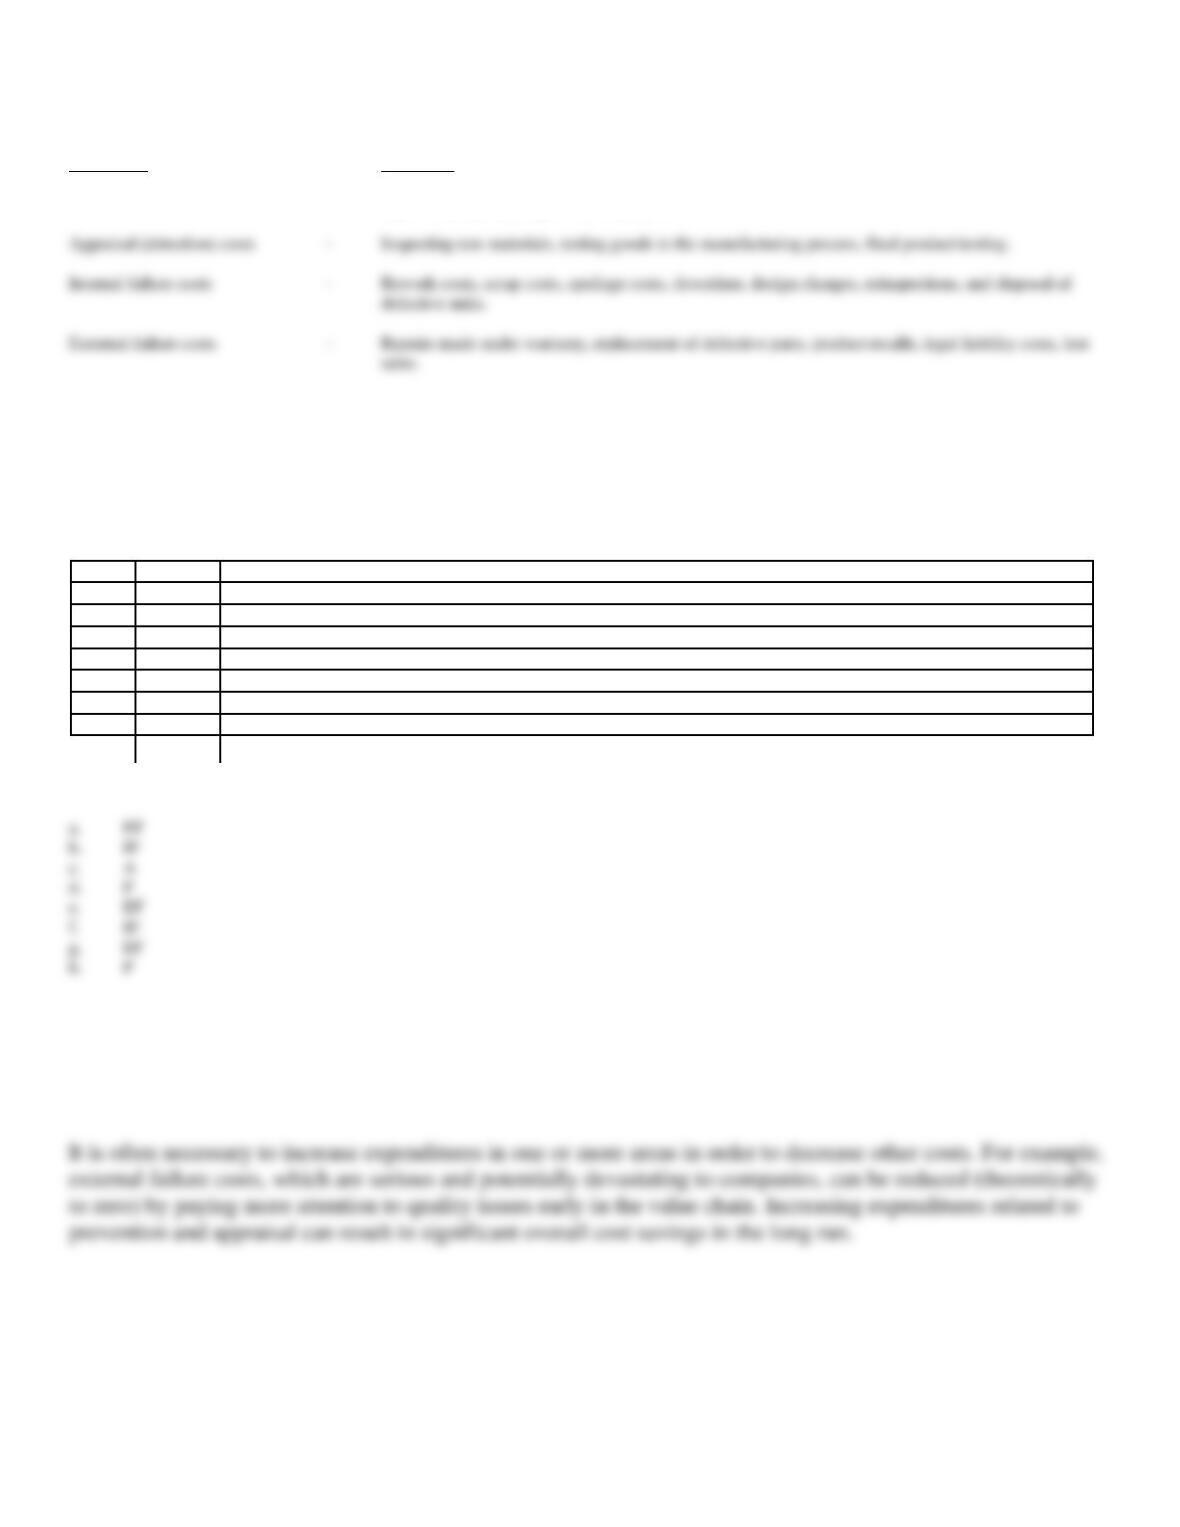
88. List the four categories of quality costs and one example of each.
Categories:
Examples:
Prevention costs
·
Providing training and technical support to suppliers, design and engineering costs, quality training,
supervision, quality improvement projects.
89. Classify the following examples of quality costs as prevention (P), appraisal (A), internal failure (IF), and
external failure (EF).
a.
the cost of repairs made under warranty
b.
downtime caused by quality problems
c.
costs of inspecting raw materials
d.
costs of quality improvement projects
e.
liability costs arising from legal actions against the seller
f.
costs of scrap and spoilage
g.
lost sales
h.
design and engineering costs
a.
b.
IF
c.
A
d.
P
f.
IF
g.
h.
P
90. As a new manager of a production division, you have made the decision to incur more quality costs than the
previous manager of the division incurred. How can you defend quality costs to executive management?
Appraisal (detection) costs
·
Inspecting raw materials, testing goods in the manufacturing process, final product testing.
Internal failure costs
·
Rework costs, scrap costs, spoilage costs, downtime, design changes, reinspections, and disposal of
External failure costs
·
Repairs made under warranty, replacement of defective parts, product recalls, legal liability costs, lost
sales.
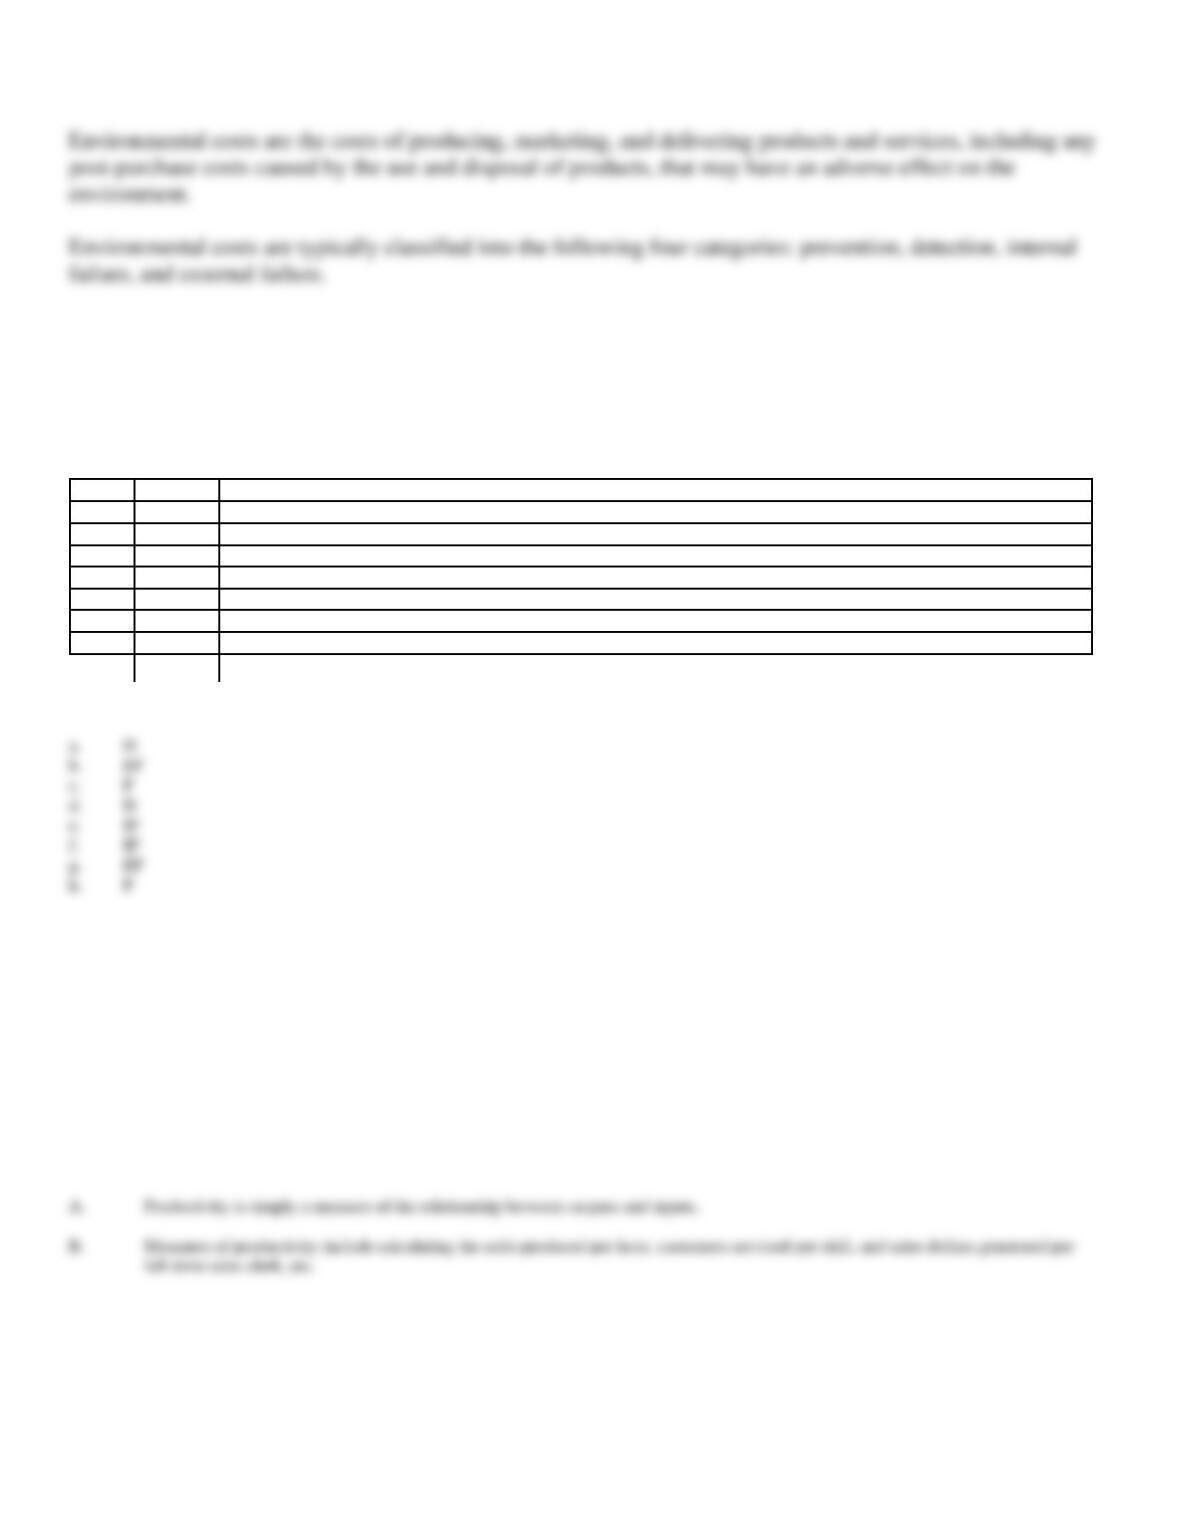
91. What are environmental costs? What are the four broad categories of environmental costs?
92. Classify the following examples of environmental costs as either prevention (P), detection (D), internal
failure (IF), or external failure (EF).
a.
testing for contamination
b.
cleaning up contaminated water, soil, and air
c.
conducting environmental impact studies
d.
inspecting products and processes
e.
recycling scrap
f.
disposing of toxic waste
g.
lost sales due to poor environmental reputation
h.
evaluating and selecting suppliers
a.
D
b.
c.
P
D
e.
IF
f.
IF
g.
P
93. Answer the following questions:
A.
What is productivity?
B.
Provide an example of a measure of productivity.
Productivity is simply a measure of the relationship between outputs and inputs.
94. Define the following terms:
A.
customer response time
B.
manufacturing cycle time
C.
manufacturing cycle efficiency (MCE)
A.
Customer response time is the total time it takes to deliver a product or service after the order is placed by the customer.
C.
Manufacturing cycle efficiency (MCE) is the value-added time in the production process divided by the total manufacturing cycle time.
95. Perk Inc. manufactures and sells coffee makers. A popular consumer magazine has recently evaluated coffee
makers and has ranked Perk’s coffee makers as being of “poor quality”. As a result, Perk’s management team
has begun to analyze all costs associated with their coffee makers in more detail, and has compiled the
following data:
Scrap costs
$15,000
Quality training
50,000
Warranty claims
90,000
Rework costs
18,000
Inspection of incoming materials
12,000
Product quality audits
25,000
Statistical process control
20,000
Required:
A.
What are total prevention costs?
B.
What are total appraisal costs?
C.
What are total internal failure costs?
D.
What are total external failure costs?
A.
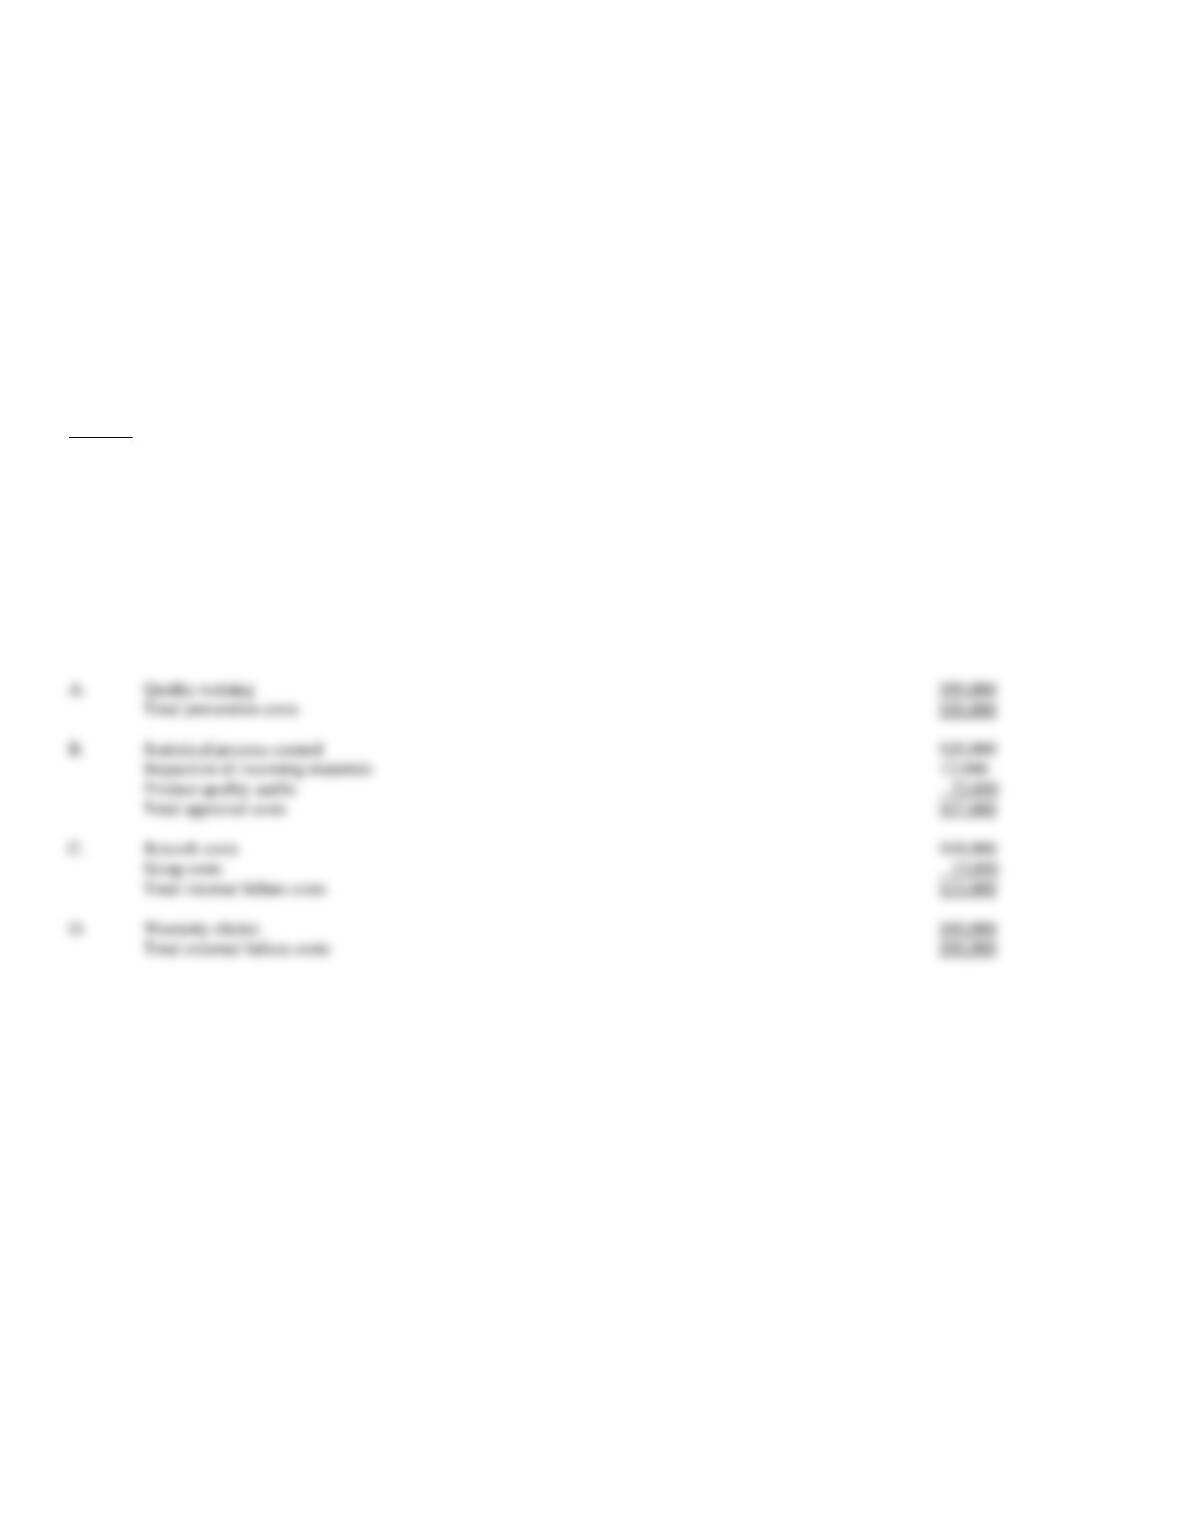
Quality training
$50,000
Total prevention costs
$50,000
B.
Statistical process control
$20,000
Inspection of incoming materials
12,000
Product quality audits
25,000
Total appraisal costs
$57,000
C.
Rework costs
$18,000
Scrap costs
15,000
Total internal failure costs
$33,000
D.
Warranty claims
$90,000
Total external failure costs
$90,000
96. Kenny Inc. manufactures and sells laminate flooring. Recently, management has noticed more customer
complaints about product defects and, as a consequence, warranty claims have significantly increased. Kenny’s
management has asked their managerial accountant for a breakdown in quality costs for the past six months.
The following data has been compiled:
Scrap costs
$ 45,000
Quality training
25,000
Warranty claims
100,000
Rework costs
20,000
Inspection of incoming materials
9,000
Product quality audits
15,000
Statistical process control
10,000
Required:
A.
What are total prevention costs?
B.
What are total appraisal costs?
C.
What are total internal failure costs?
D.
What are total external failure costs?
A.
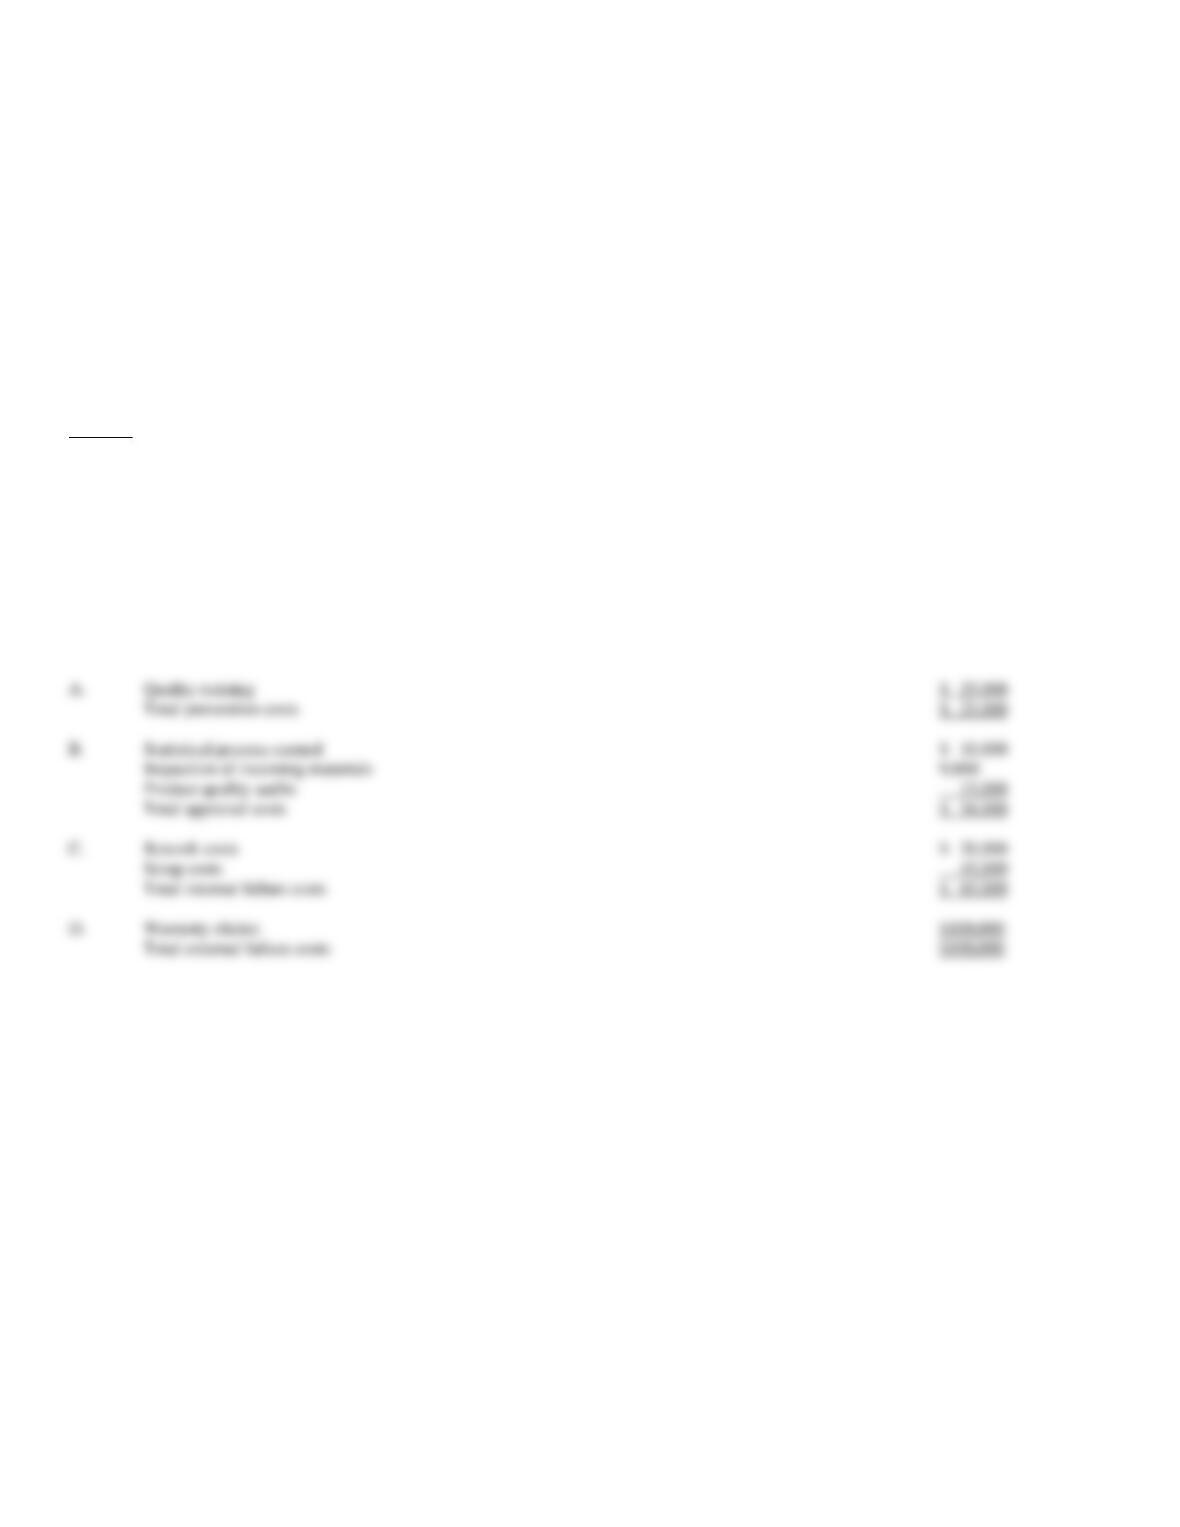
Quality training
$ 25,000
Total prevention costs
$ 25,000
B.
Statistical process control
$ 10,000
Inspection of incoming materials
9,000
Product quality audits
15,000
Total appraisal costs
$ 34,000
C.
Rework costs
$ 20,000
Scrap costs
45,000
Total internal failure costs
$ 65,000
D.
Warranty claims
$100,000
Total external failure costs
$100,000
97. Sanford Products Inc. produces a variety of plastic products which it sells to retail stores throughout the
country. The following data is available for the year for one of the products:
Units started into production
600,000
Total good units completed
680,000
Total hours of value-added production time
250,000
Total production hours
400,000
Required:
A.
Compute the manufacturing cycle efficiency (MCE).
B.
What is the total throughput per hour? Round your answer to two decimal places.
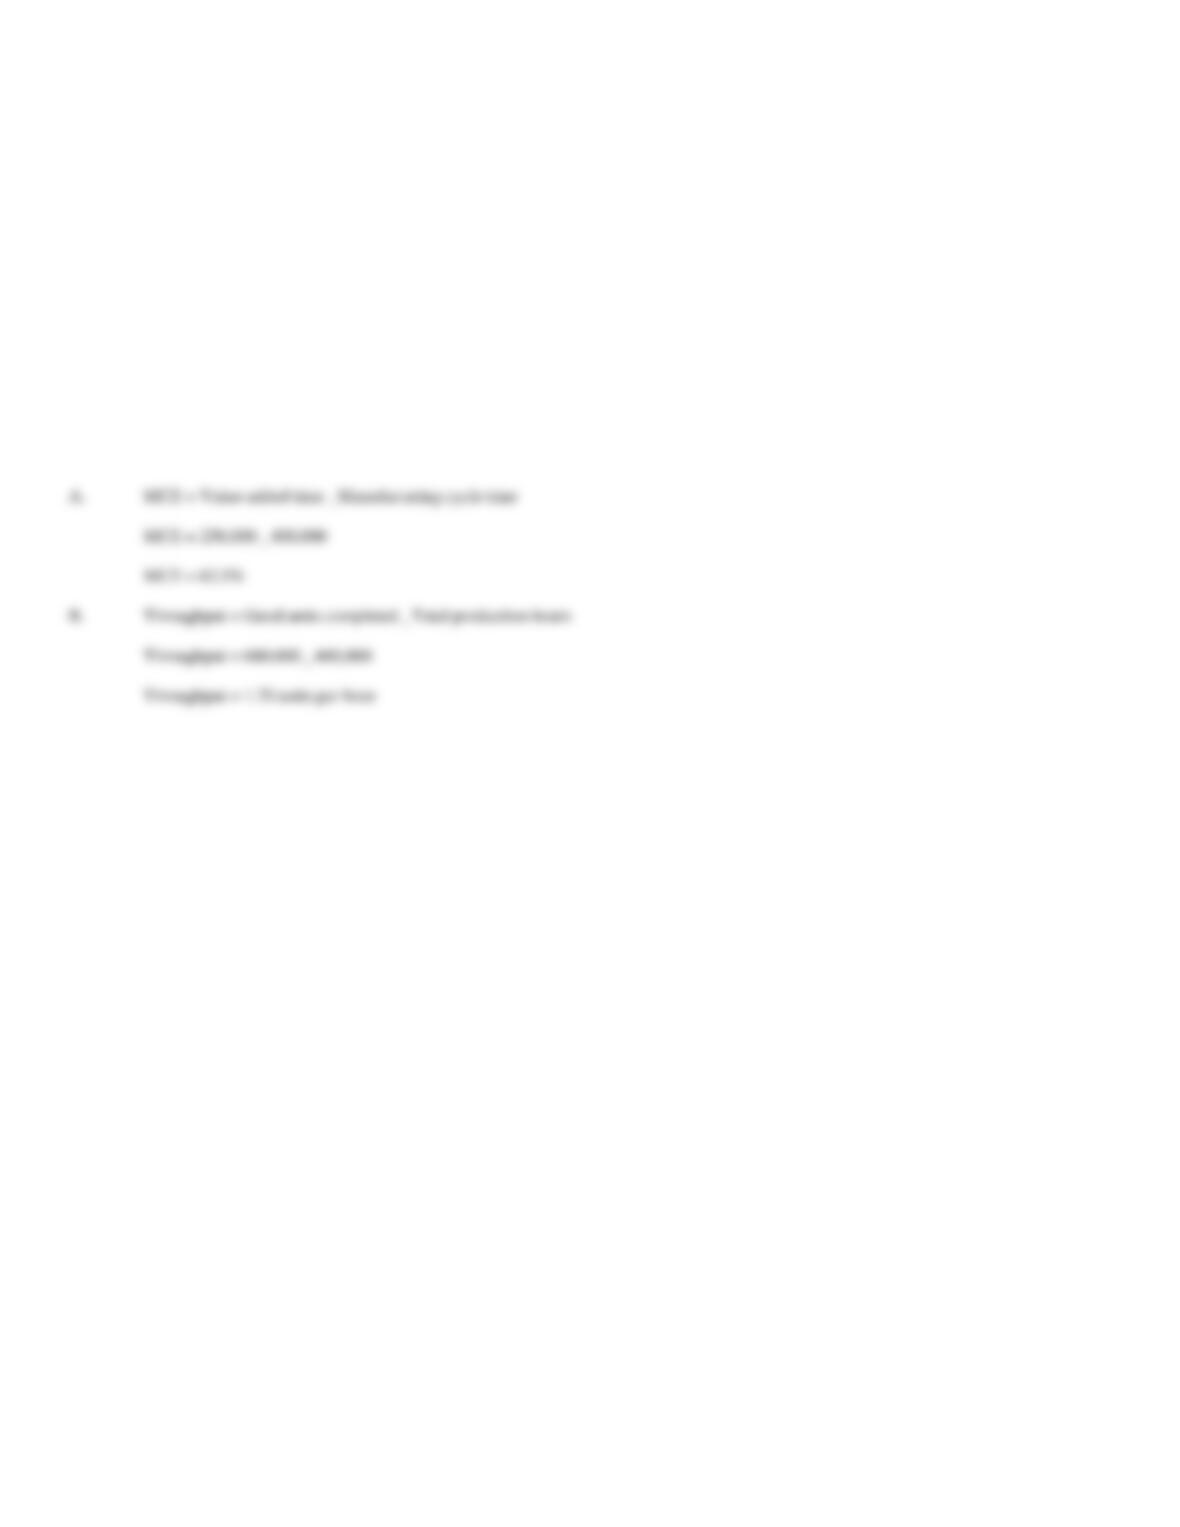
MCE = Value-added time ¸ Manufacturing cycle time
MCE = 250,000 ¸ 400,000
MCE = 62.5%
B.
Throughput = Good units completed ¸ Total production hours
Throughput = 680,000 ¸ 400,000
Throughput = 1.70 units per hour
98. Charlotte Products Inc. produces a variety of electronic products which it sells to retail stores throughout the
country. The following data is available for the year for one of the products:
Units started into production
2,000,000
Total good units completed
1,950,000
Total hours of value-added production time
300,000
Total production hours
380,000
Required:
A.
Compute the manufacturing cycle efficiency (MCE).
B.
What is the total throughput per hour? Round your answer to two decimal places.
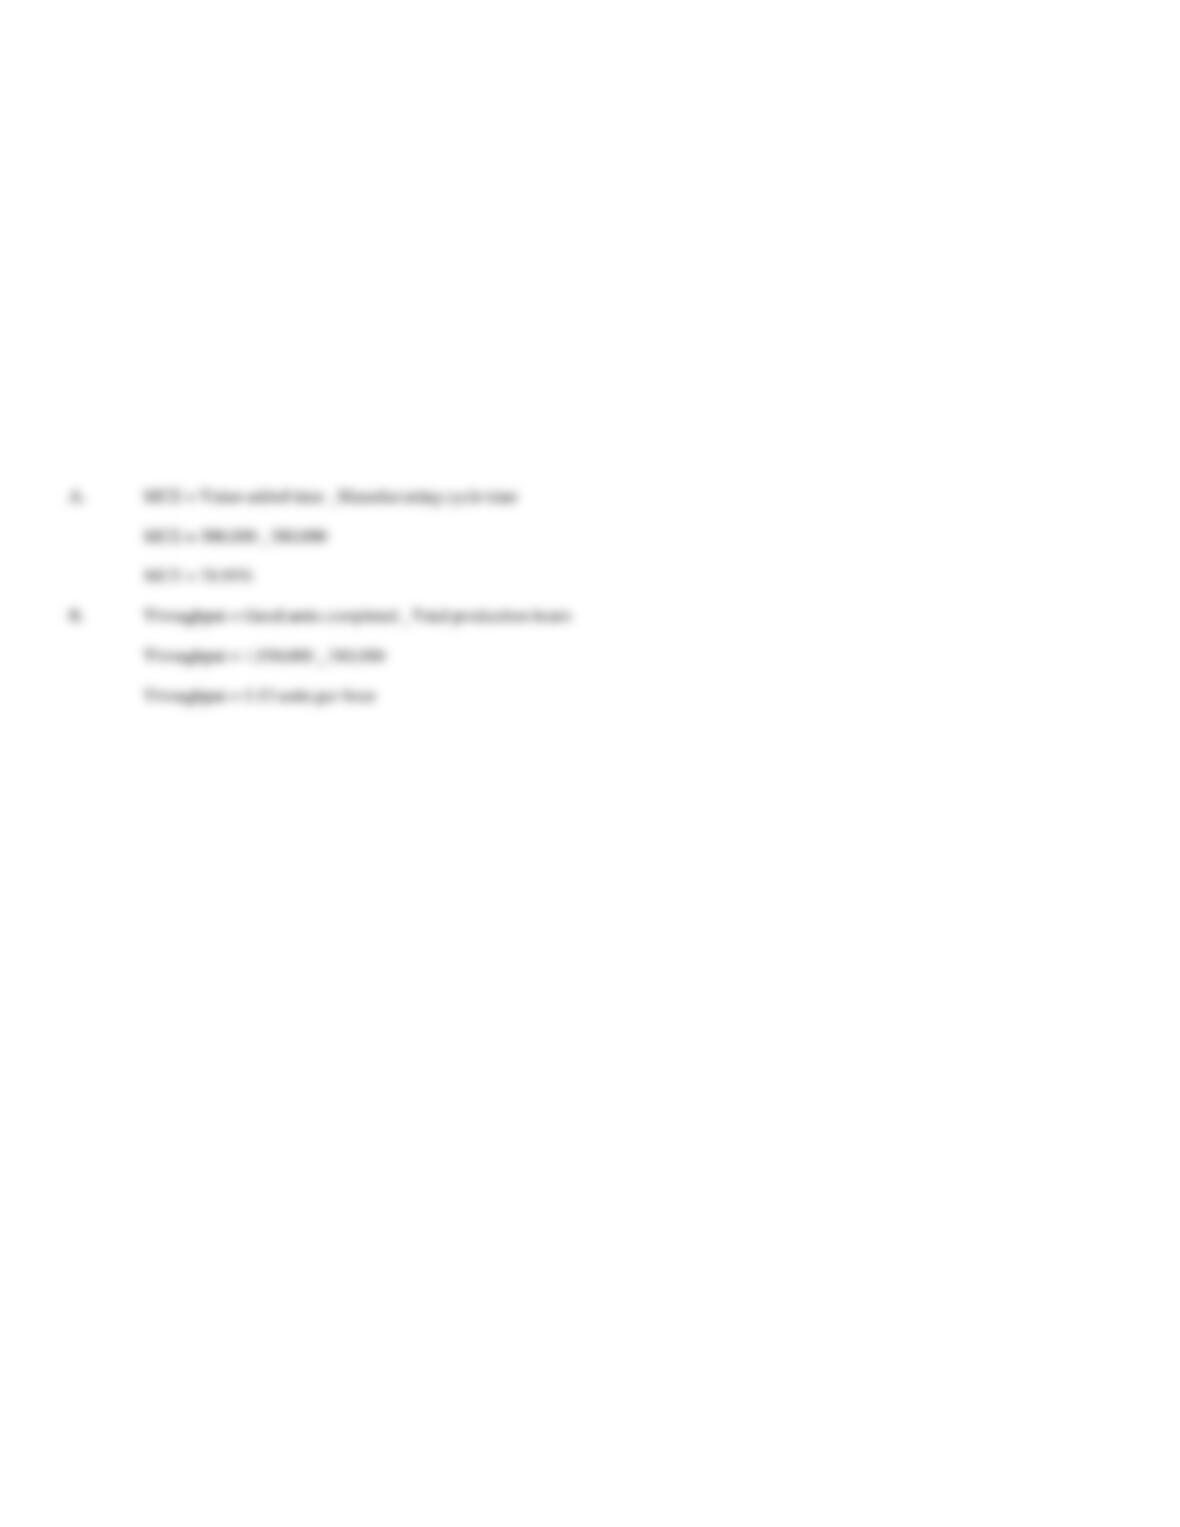
MCE = Value-added time ¸ Manufacturing cycle time
MCE = 300,000 ¸ 380,000
MCE = 78.95%
B.
Throughput = Good units completed ¸ Total production hours
Throughput = 1,950,000 ¸ 380,000
Throughput = 5.13 units per hour