Provide an appropriate response.
53)
Use the integral table to find x e3x dx .
53)
A)
x e3x
3–e3x
9+ C
B)
x e3x –e3x
3+ C
C)
x e3x
3+e3x
9+ C
D)
x e3x
3–e3x
3+ C
54)
Find the equilibrium quantity if the price–demand equation is p = D(x) = 23 –1
20 x, and the
price–supply equation is p = S(x) = 8 +1
8,000 x2.
54)
A)
13
B)
–600
C)
200
D)
–600, 200
Use Simpson’s rule to approximate the integral using the indicated value of n (so there are 2n subintervals).
55)
4
0
1
x2+ 1 dx; n = 2, Round to two decimal places.
55)
A)
1.20
B)
1.33
C)
1.46,
D)
1.29
56)
Find the equilibrium price if the price–demand equation is p = D(x) = 23 –1
20 x, and the
price–supply equation is p = S(x) = 8 +1
8,000 x2.
56)
A)
$7.00
B)
$13.00
C)
$60.00
D)
$20.00
57)
4xex dx
57)
A)
4xex– 4ex+ C
B)
xex– 4ex+ C
C)
4ex– ex+ C
D)
4ex– 4xex+ C
Provide an appropriate response.
58)
Find the area between the graph of f(x) = 50 +3x2 and the x–axis over the interval [–2, 4].
58)
A)
–92
B)
92
C)
269
D)
372
Solve the problem.
59)
Find the total income produced by a continuous income stream in the first four years if the rate of
flow is f(t) = 500e0.03t. (Round answer to the nearest dollar.)
59)
A)
$564
B)
$2125
C)
$18,792
D)
$2486
Use Simpson’s rule to approximate the integral using the indicated value of n (so there are 2n subintervals).
60)
6
2
4
x2+ 2
dx ; n = 4, Round to three decimal places.
60)
A)
4.024
B)
4.424
C)
3.616
D)
4.236
Evaluate using integration by parts.
61)
x2e2xdx
61)
A)
x2
2e2x – 2xe2x + C
B)
x2
2e2x – 2xe2x + 1 + C
C)
x2
2e2x – xe2x + C
D)
x2
2e2x –x
2e2x +1
4e2x + C
62)
x2ln 4x dx
62)
A)
4
3ln34x –1
9x3+ C
B)
4
3ln34x –1
3x3+ C
C)
1
3ln34x –1
3x3+ C
D)
1
3ln34x –1
9x3+ C
Solve the problem.
63)
The Lorenz curve for the income distribution in a certain country is given by f(x) =3
4x2+1
4x.
I) Find the Gini index of income concentration.
II) Use the answer found in I) to determine if the income of this country is more equally
distributed, less equally distributed, or distributed the same as a second country having an index of
income concentration of 0.2.
63)
A)
I) 0.33
II) more equally distributed
B)
I) 0.25
II) less equally distributed
C)
I) 0.33
II) less equally distributed
D)
I) 0.25
II) more equally distributed
Find the indefinite integral using a table of integration formulas.
64)
1
x2– 49
dx
64)
A)
1
14 ln x – 7
x + 7 + C
B)
ln x +x2– 49 + C
C)
ln x +x2+ 49 + C
D)
1
14 ln 7 + x
7 – x + C
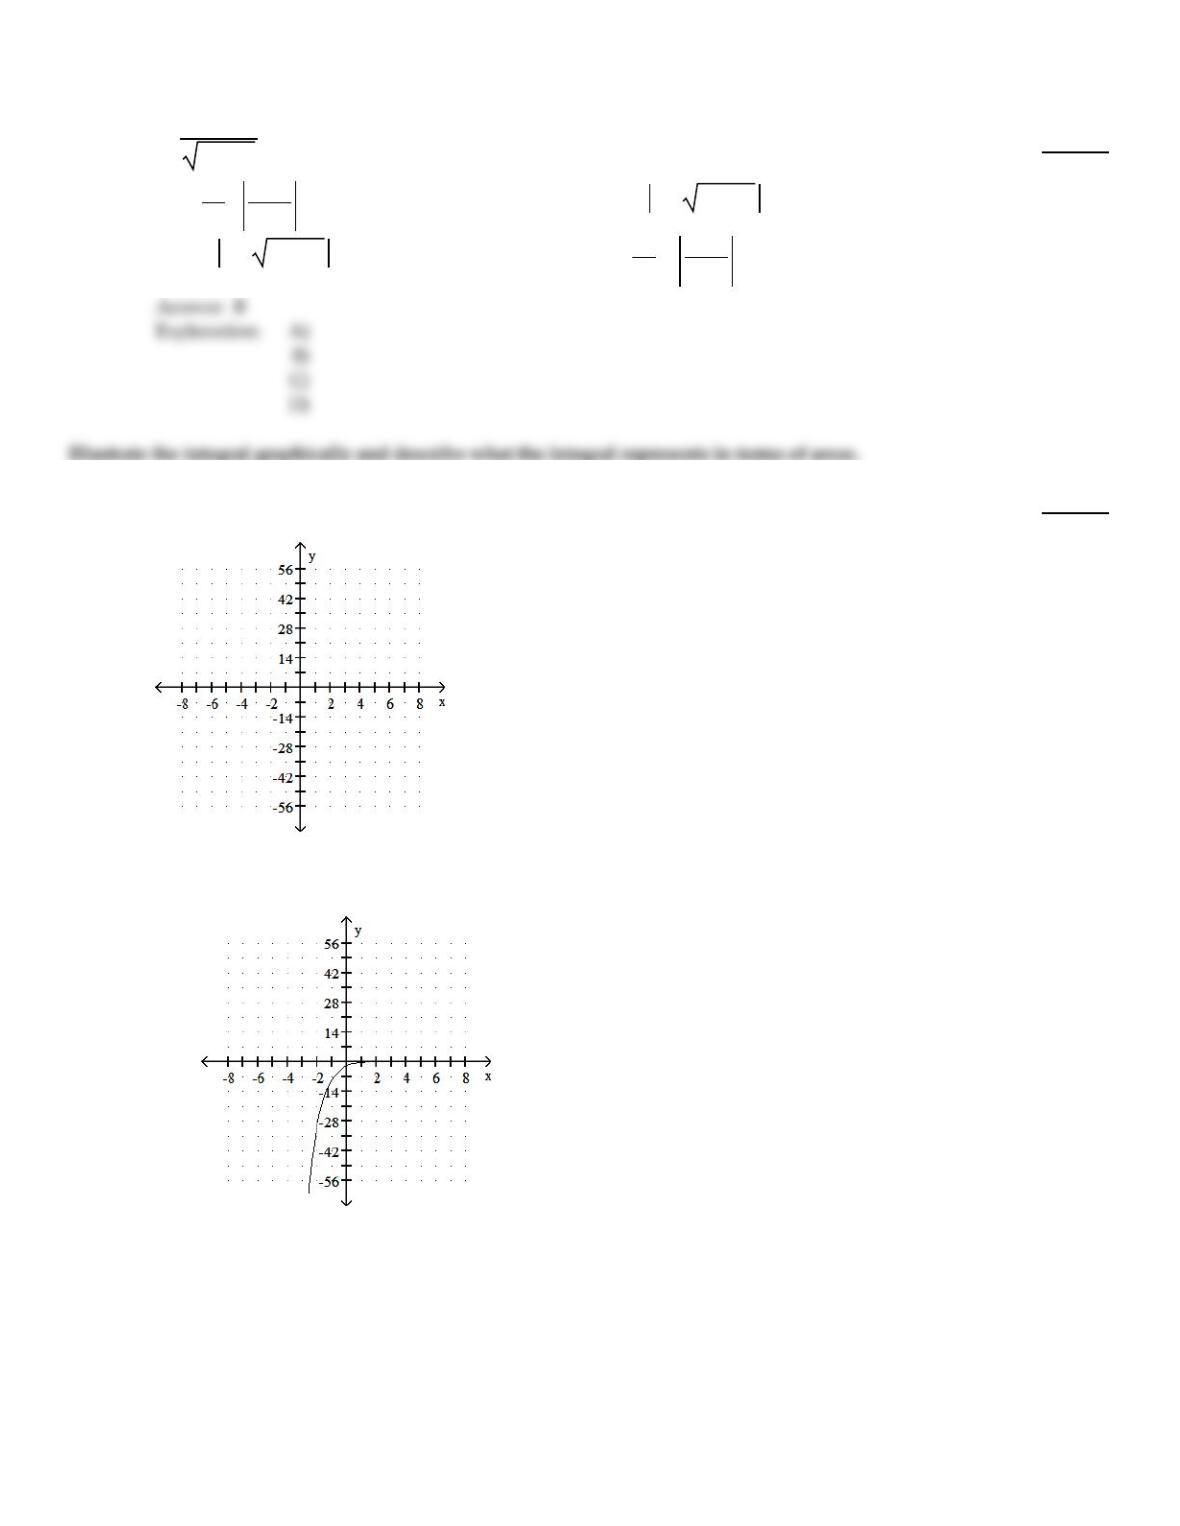
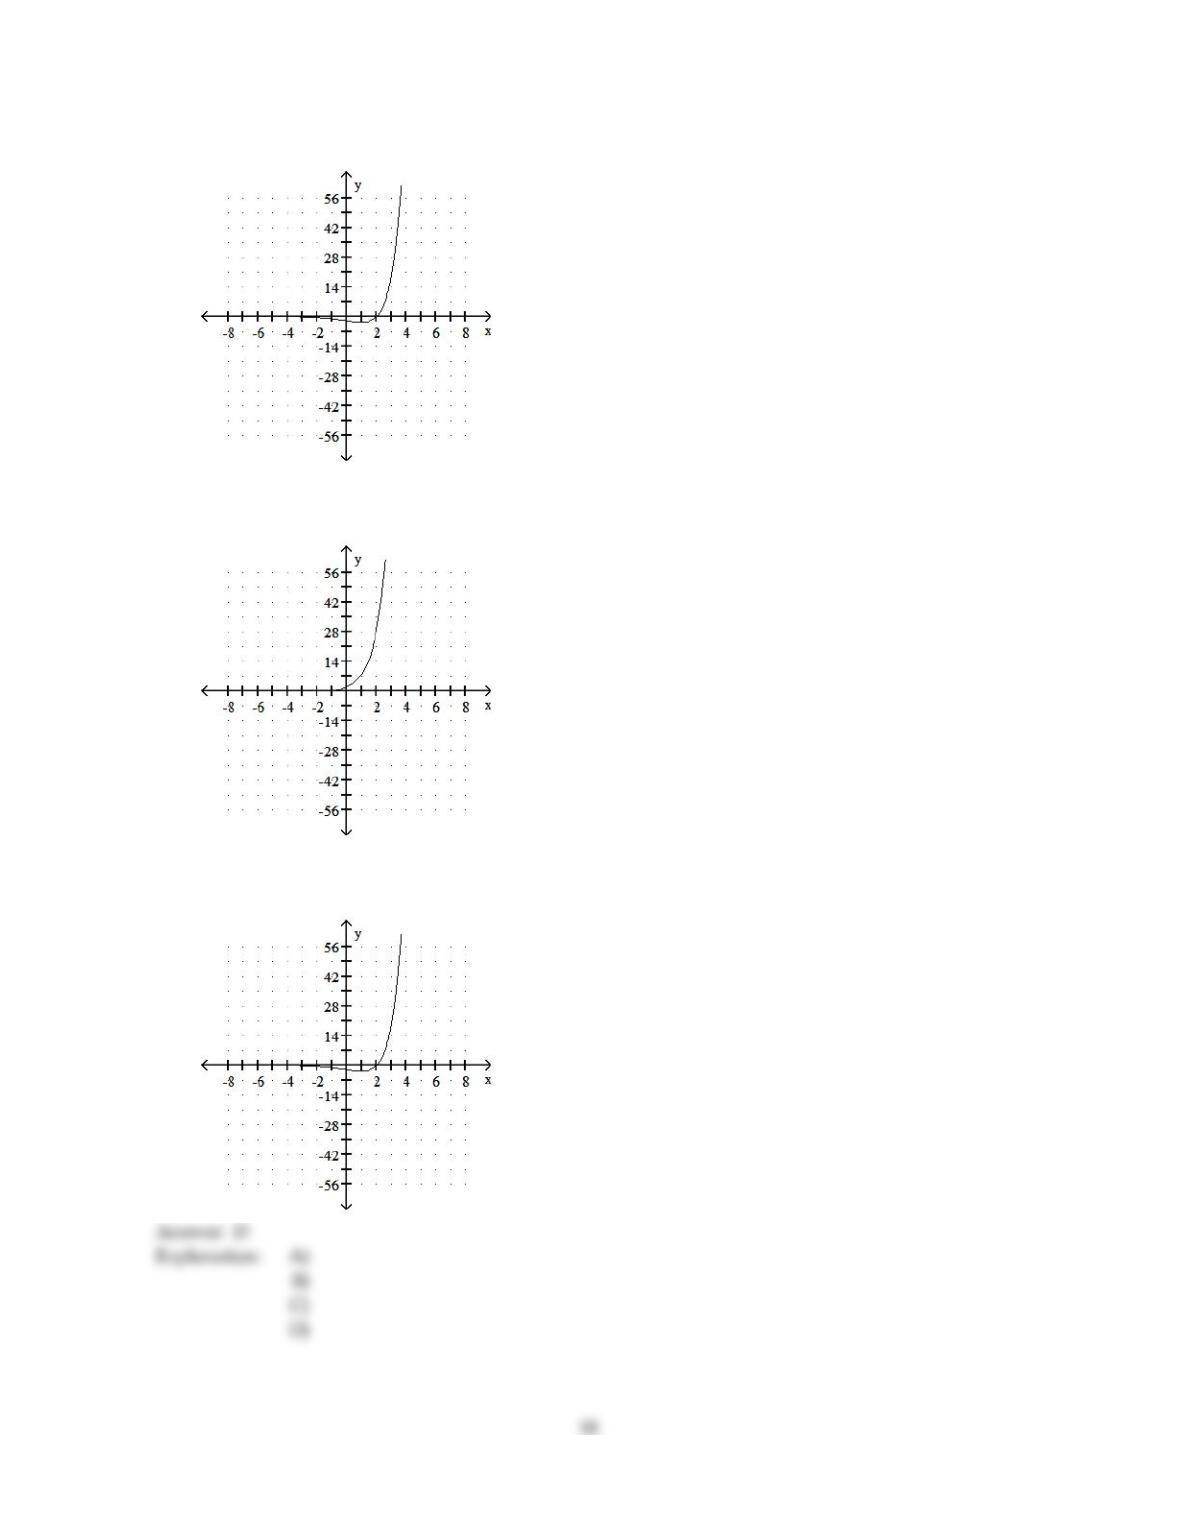
65)
1
0
(x –2)exdx
65)
A)
The integral represents the area between the
graph of y = (x –2)ex and the x axis from
x = 0 to x = 1.
17
B)
The integral represents the area between
the graph of y = (x –2)ex and the x axis
from x = 0 to x = 1.
C)
The integral represents the negative of the
area between the graph of y = (x –2)ex and
the x axis from x = 0 to x = 1.
D)
The integral represents the negative of the
area between the graph of y = (x –2)ex and
the x axis from x = 0 to x = 1.
Evaluate using integration by parts.
66)
xe2x dx
66)
A)
1
2xe2x –1
4e2x + C
B)
1
2xe2x +1
2e2x + C
C)
1
2xe2x –1
2e2x + C
D)
1
2xe2x +e2x + C
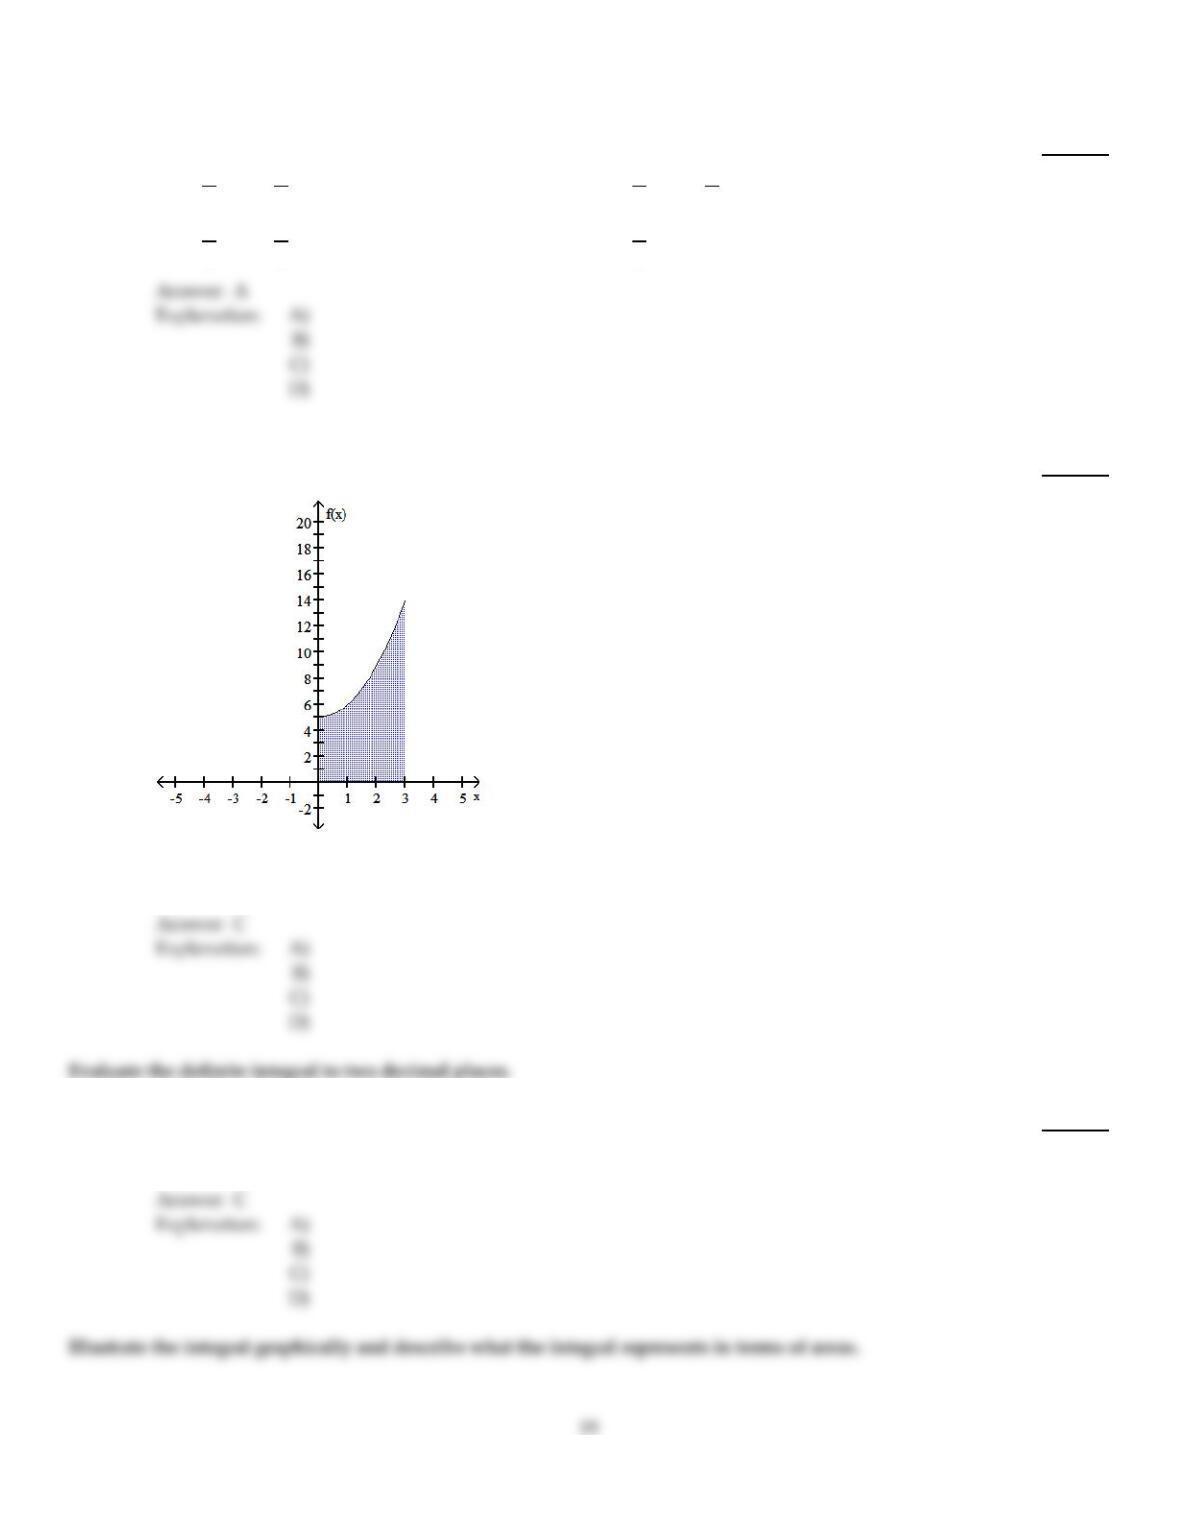
Set up a definite integral that represents the shaded area.
67)
y = f(x)
67)
A)
20
5
f(x)dx
B)
3
1
f(x)dx
C)
3
0
f(x)dx
D)
5
0
f(x)dx
68)
18
0
e0.06t e0.14(15 – t)dt
68)
A)
70.04
B)
23.19
C)
77.89
D)
53.64
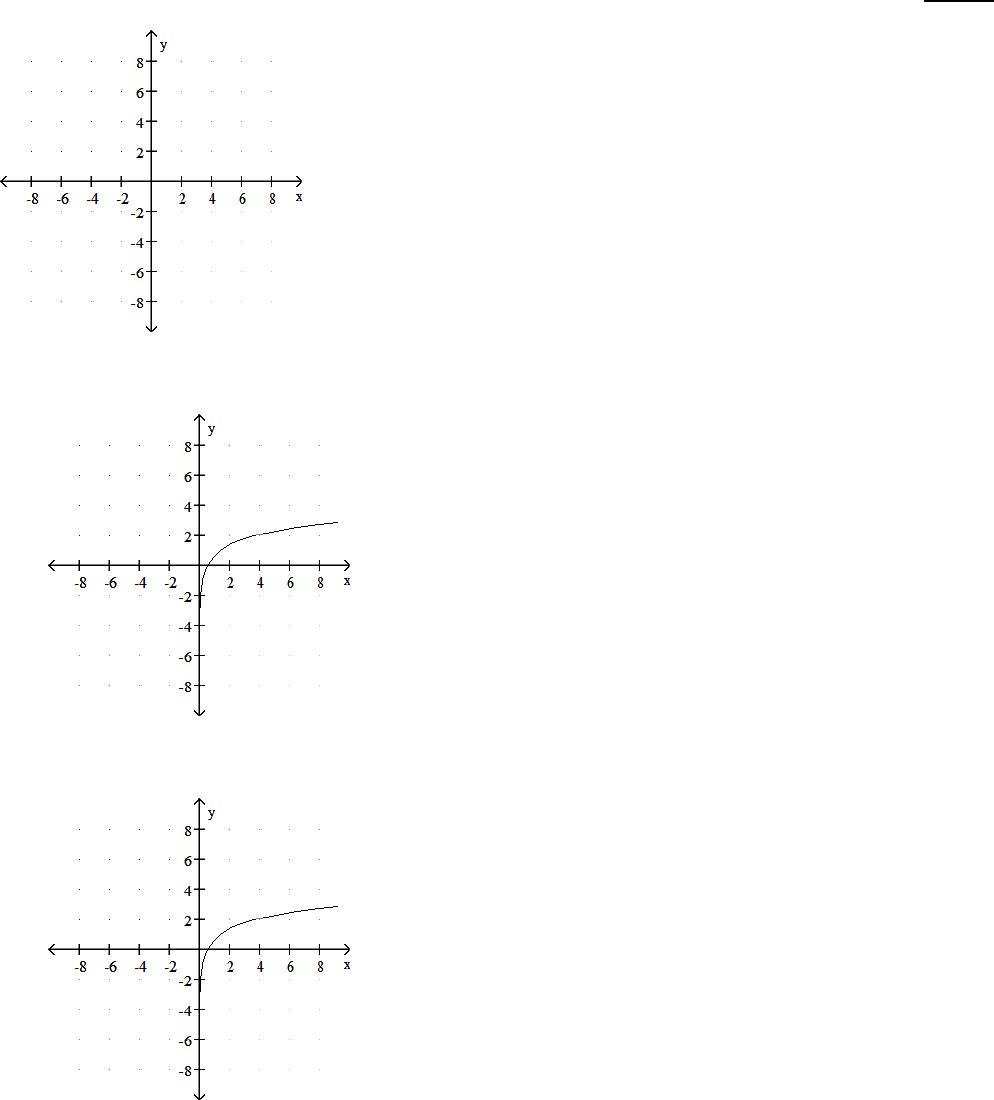
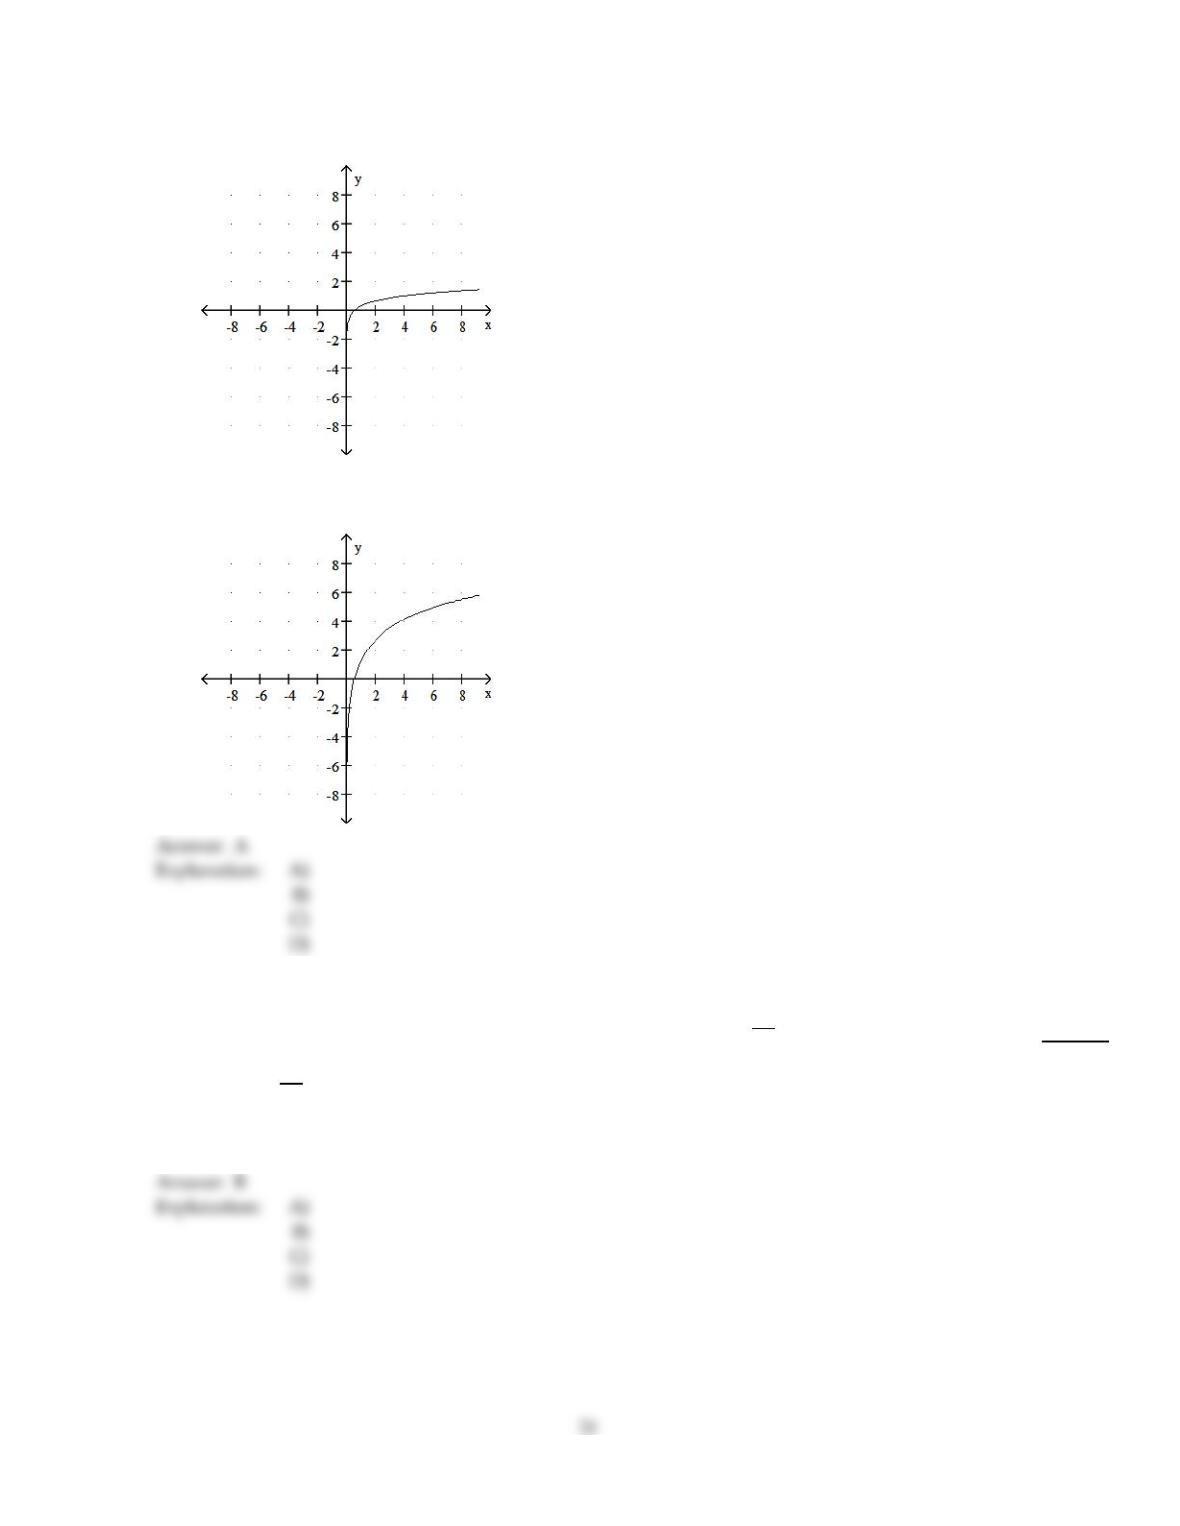
69)
4
2
ln 2x dx
69)
A)
The integral represents the area
between the graph of y = ln 2x and
the x axis from x = 2 to x = 4.
B)
The integral represents the negative of the
area between the graph of y = ln 2x and
the x axis from x = 2 to x = 4.
20
C)
The integral represents the area
between the graph of y = ln 2x and
the x axis from x = 2 to x = 4.
D)
The integral represents the area
between the graph of y = ln 2x and
the x axis from x = 2 to x = 4.
Solve the problem.
70)
Find the consumers’ surplus and producers’ surplus for p = D(x) = 71 –1
10 x and
p = S(x) = 35 +1
20 x.
70)
A)
CS = $2880
PS = $1660
B)
CS = $2880
PS = $1440
C)
CS = $15,160
PS = $1440
D)
CS = $14,160
PS = $1440
Use the Trapezoidal Rule to approximate the integral using the indicated value of n.
71)
2
0
4x2 dx ; n = 4, Write answer as a whole number or reduced fraction.
71)
A)
22
B)
11
C)
32
3
D)
15
Find the indefinite integral using a table of integration formulas.
72)
2
5x (7x + 7) dx
72)
A)
1
7 ln x
7x + 7 + C
B)
2
7 ln x
7x + 7 + C
C)
2
35 ln x
7x + 7 + C
D)
1
7+x
7–1
7 ln 7x + 7 + C
Use the Trapezoidal Rule to approximate the integral using the indicated value of n.
73)
1
0
1 +x3dx; n = 4, Round to two decimal places.
73)
A)
1.42
B)
1.12
C)
1.62
D)
1.02
Find the equilibrium point.
74)
D(x) =(x –8)2, S(x) =x2+ 2x + 1
74)
A)
16, $64
B)
7
2, $20.25
C)
32, $576
D)
2
9, $60.49
22
75)
The rate of growth of a microbe population is given by m'(x) = 30 x e2x, where x is time in days.
What is the net growth between day 3 and day 7?
75)
A)
222,613,533
B)
111,306,789
C)
222,613,544
D)
117,238,789
D)
Provide an appropriate response.
76)
Find the area between the graph of f(x) =e0.2x + 2 and the x–axis over the interval 2 x 5.
(Round answer to two decimal places, if necessary.)
76)
A)
8.97
B)
12.13
C)
3.22
D)
20.13
D)
Solve the problem.
77)
Find the equilibrium price and quantity,producers’ surplus for p = D(x) = 71 –1
10 x and
p = S(x) = 35 +1
20 x.
77)
A)
p = 47
q = 180
B)
p = 50
q = 240
C)
p = 47
q = 288
D)
p = 47
q = 240
D)
Provide an appropriate response.
78)
Find the area between the graph of f(x) = 100 – 4x2 and the x–axis over the interval [–5, 5]. (Round
answer to two decimal places.)
78)
A)
66.67
B)
666.67
C)
33.33
D)
333.33
D)
23
Solve the problem.
Find the producer’s surplus for the following supply function at the given point.
79)
S(x) =x2+2; x = 1
79)
A)
–$2
B)
$2
C)
$0.67
D)
–$0.67
Evaluate using integration by parts.
80)
4
3
ln 5x dx
80)
A)
14.2939
B)
1.4597
C)
2.8588
D)
5.0213
81)
xx + 3 dx
81)
A)
2x(x + 3)3/2 – 4(x + 3)3/2 + C
B)
2
5x(x + 3)3/2 –4
5(x + 3)3/2 + C
C)
2
3x(x + 3)3/2 –4
15 (x + 3)5/2 + C
D)
2
5x(x + 3)1/2 –4
5(x + 3)1/2 + C
82)
x2ln 7x dx
82)
A)
1
3x3 ln 7x –1
12 x4+ C
B)
1
3x3 ln 7x +1
9 x3+ C
C)
1
3 x3 ln 7x –1
9 x3+ C
D)
ln 7x –1
3 x3+ C
Answer Key
Testname: C14
Answer Key