Stewart_Calc_7ET ch14sec01
MULTIPLE CHOICE
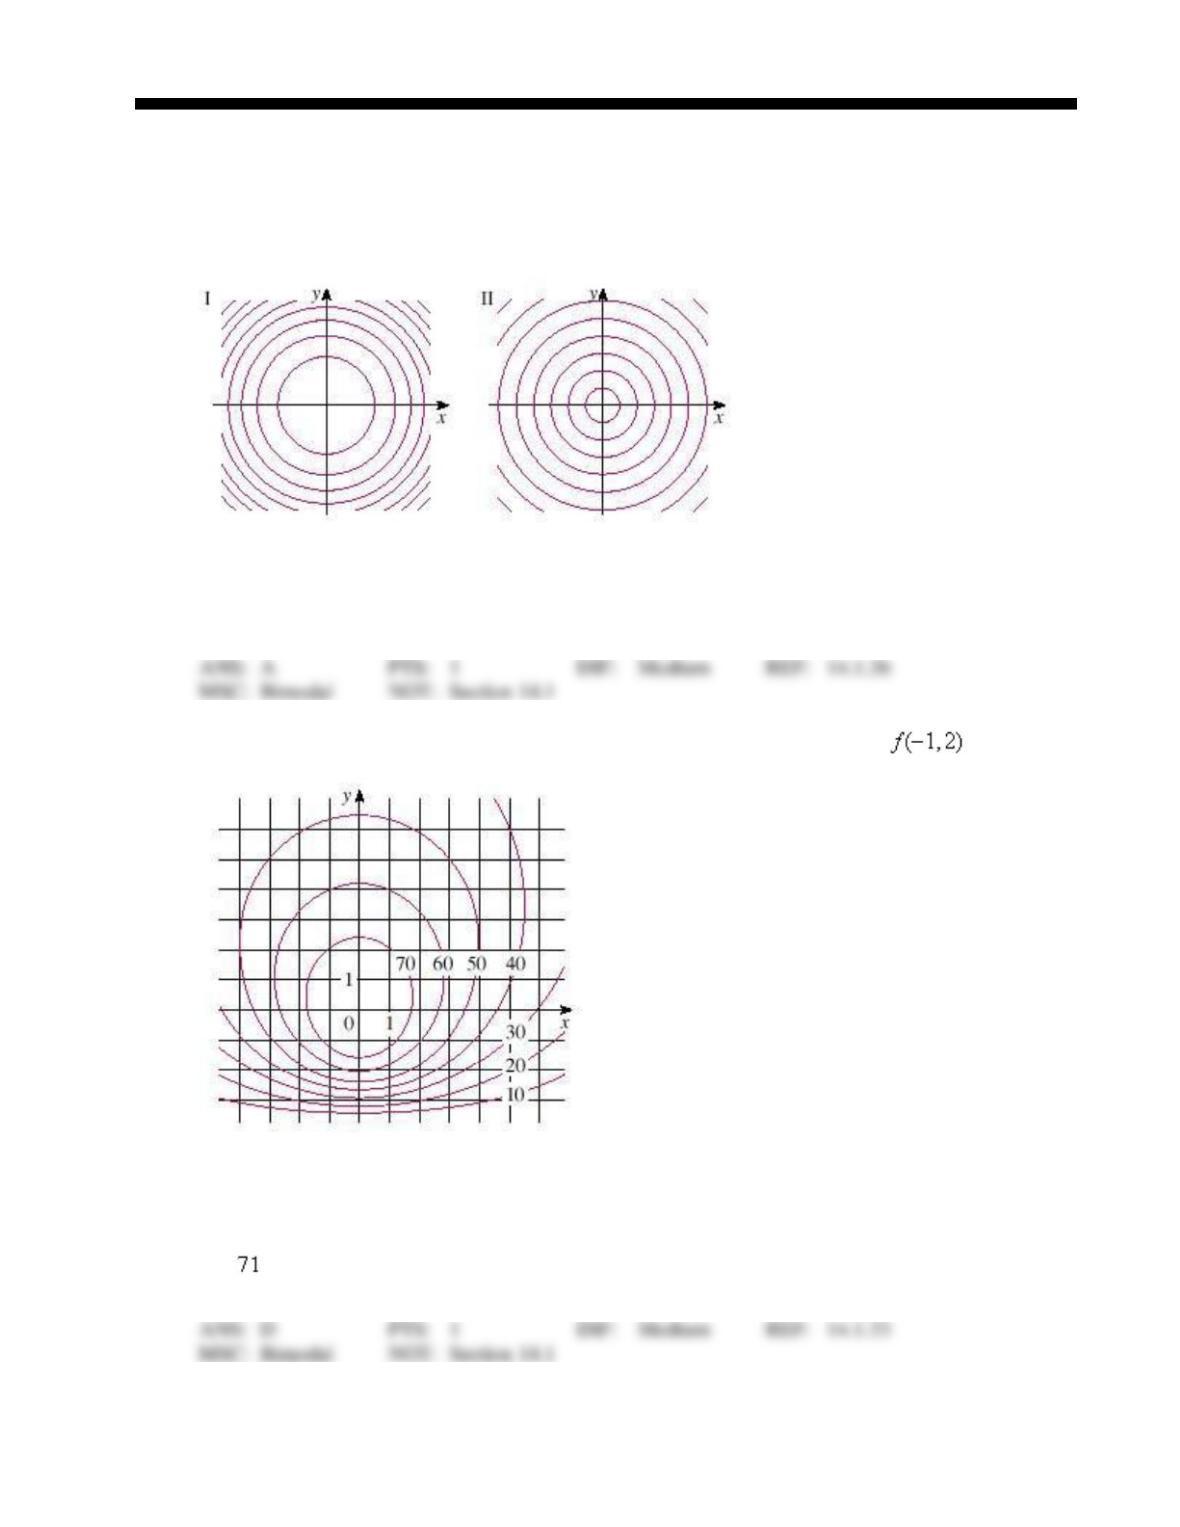
1. Two contour maps are shown. One is for a function f whose graph is a cone. The other is
for a function g whose graph is a paraboloid. Which is the contour map of a cone?
a.
II
b.
I
c.
impossible to determine
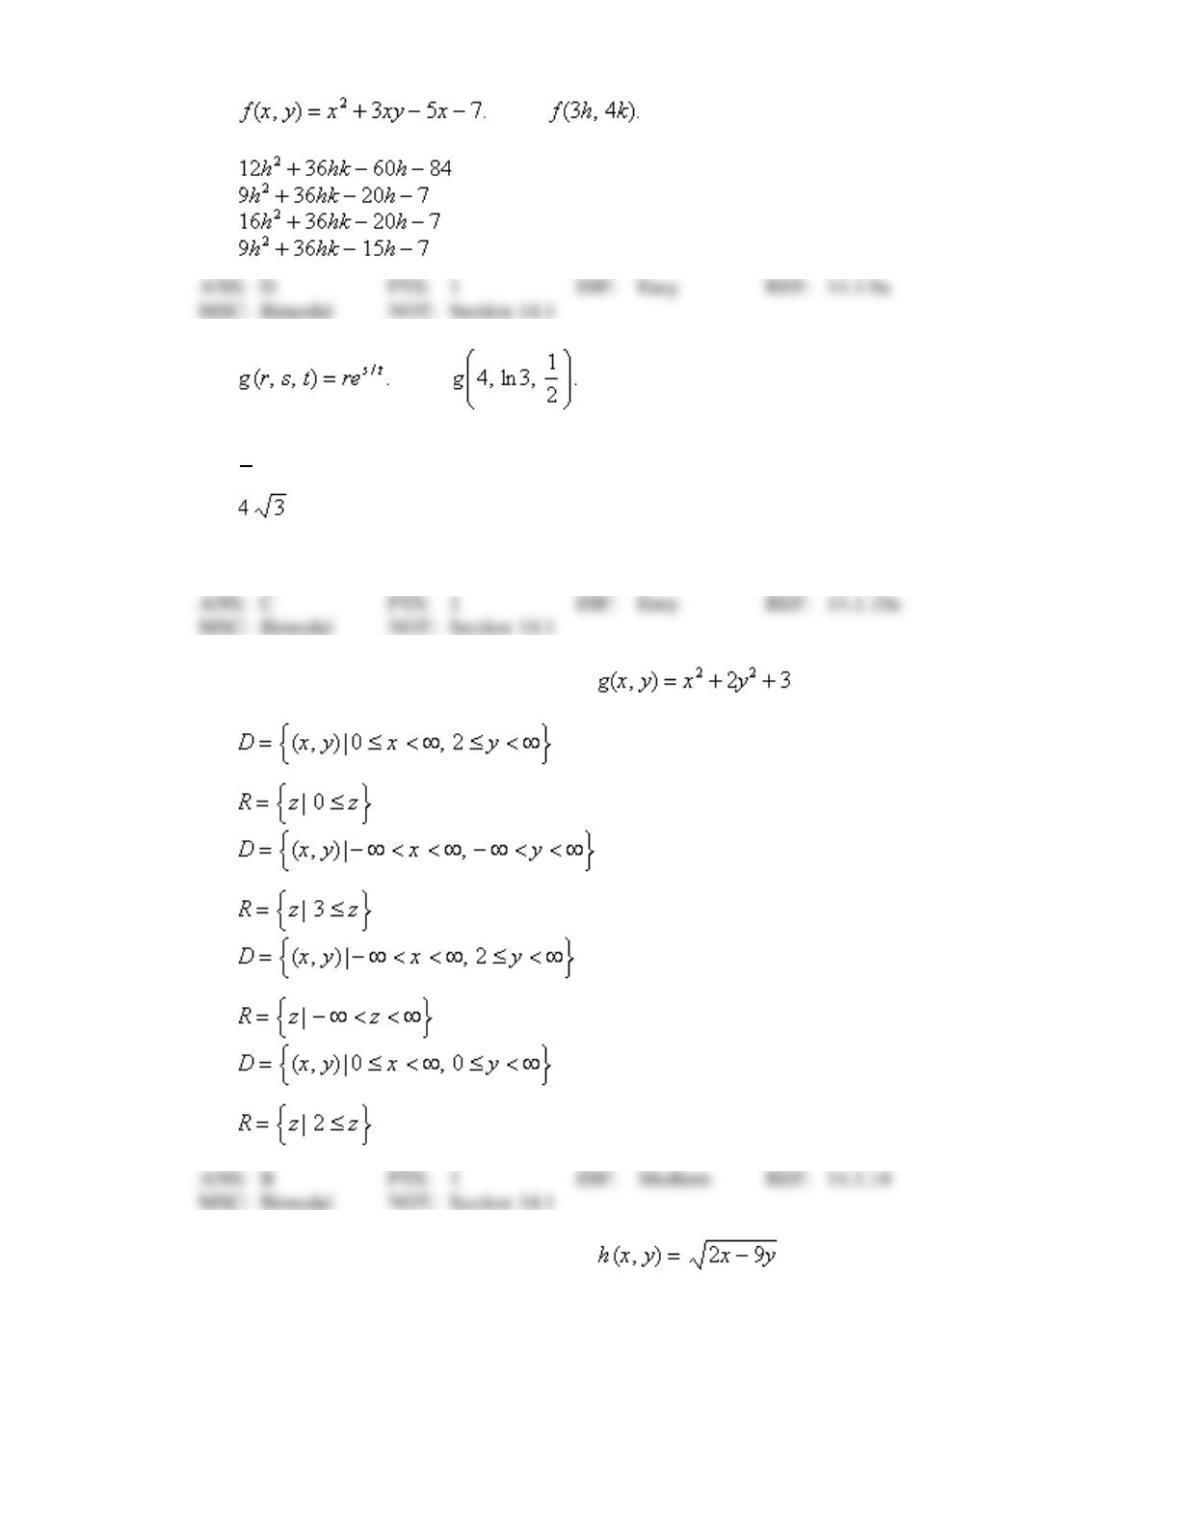
2. A contour map for a function f is shown. Use it to estimate the value of .
a.
78
b.
28
c.
35
d.
e.
48
3. Let Find
a.
b.
c.
d.
4. Let Find
a.
b.
c.
36
d.
5. Find the domain and range of the function .
a.
b.
c.
d.
6. Find the domain and range of the function .
2
3
6
a.
b.
c.
d.
7. Find the domain and range of the function .
a.
b.
c.
d.
8. Let Find
a.
b.
c.
d.
72
NUMERIC RESPONSE
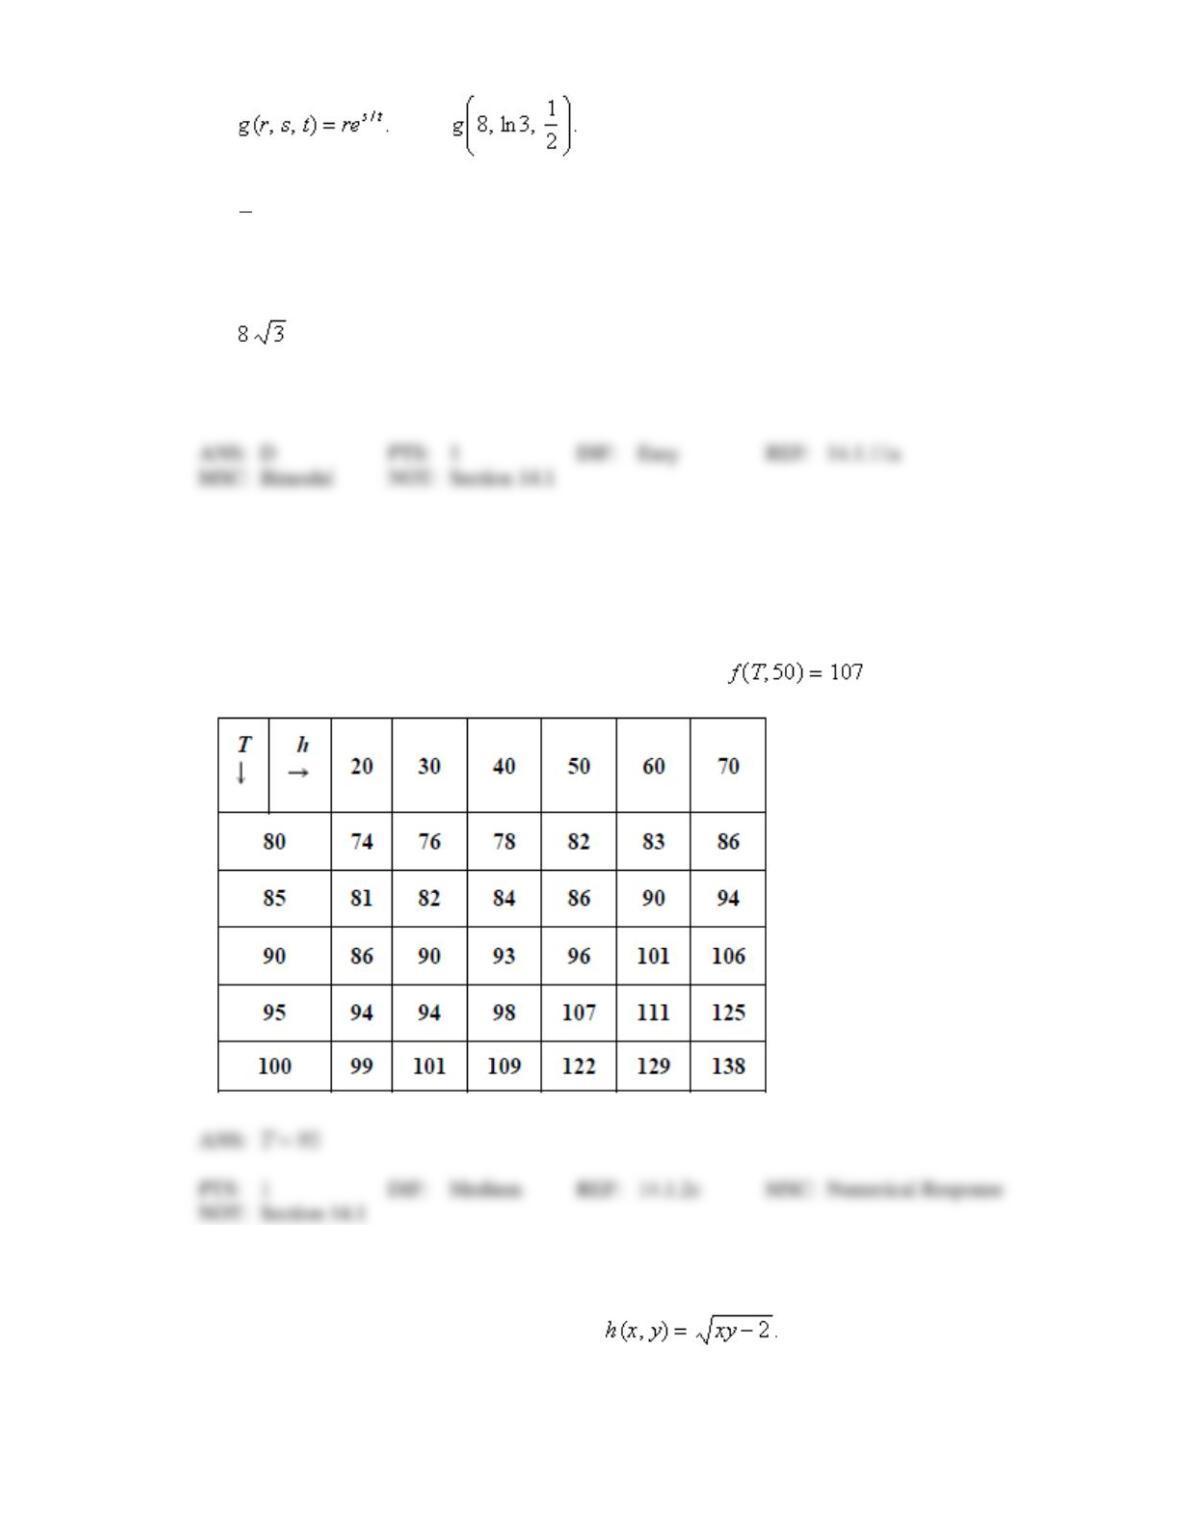
1. The temperature-humidity index I (or humidex, for short) is the perceived air temperature
when the actual temperature is T and the relative humidity is h, so we can write I = f (T, h).
The following table of values of I is an excerpt from a table compiled by the National Oceanic
and Atmospheric Administration. For what value of T is ?
SHORT ANSWER
1. Find and sketch the domain of the function
4
3
12
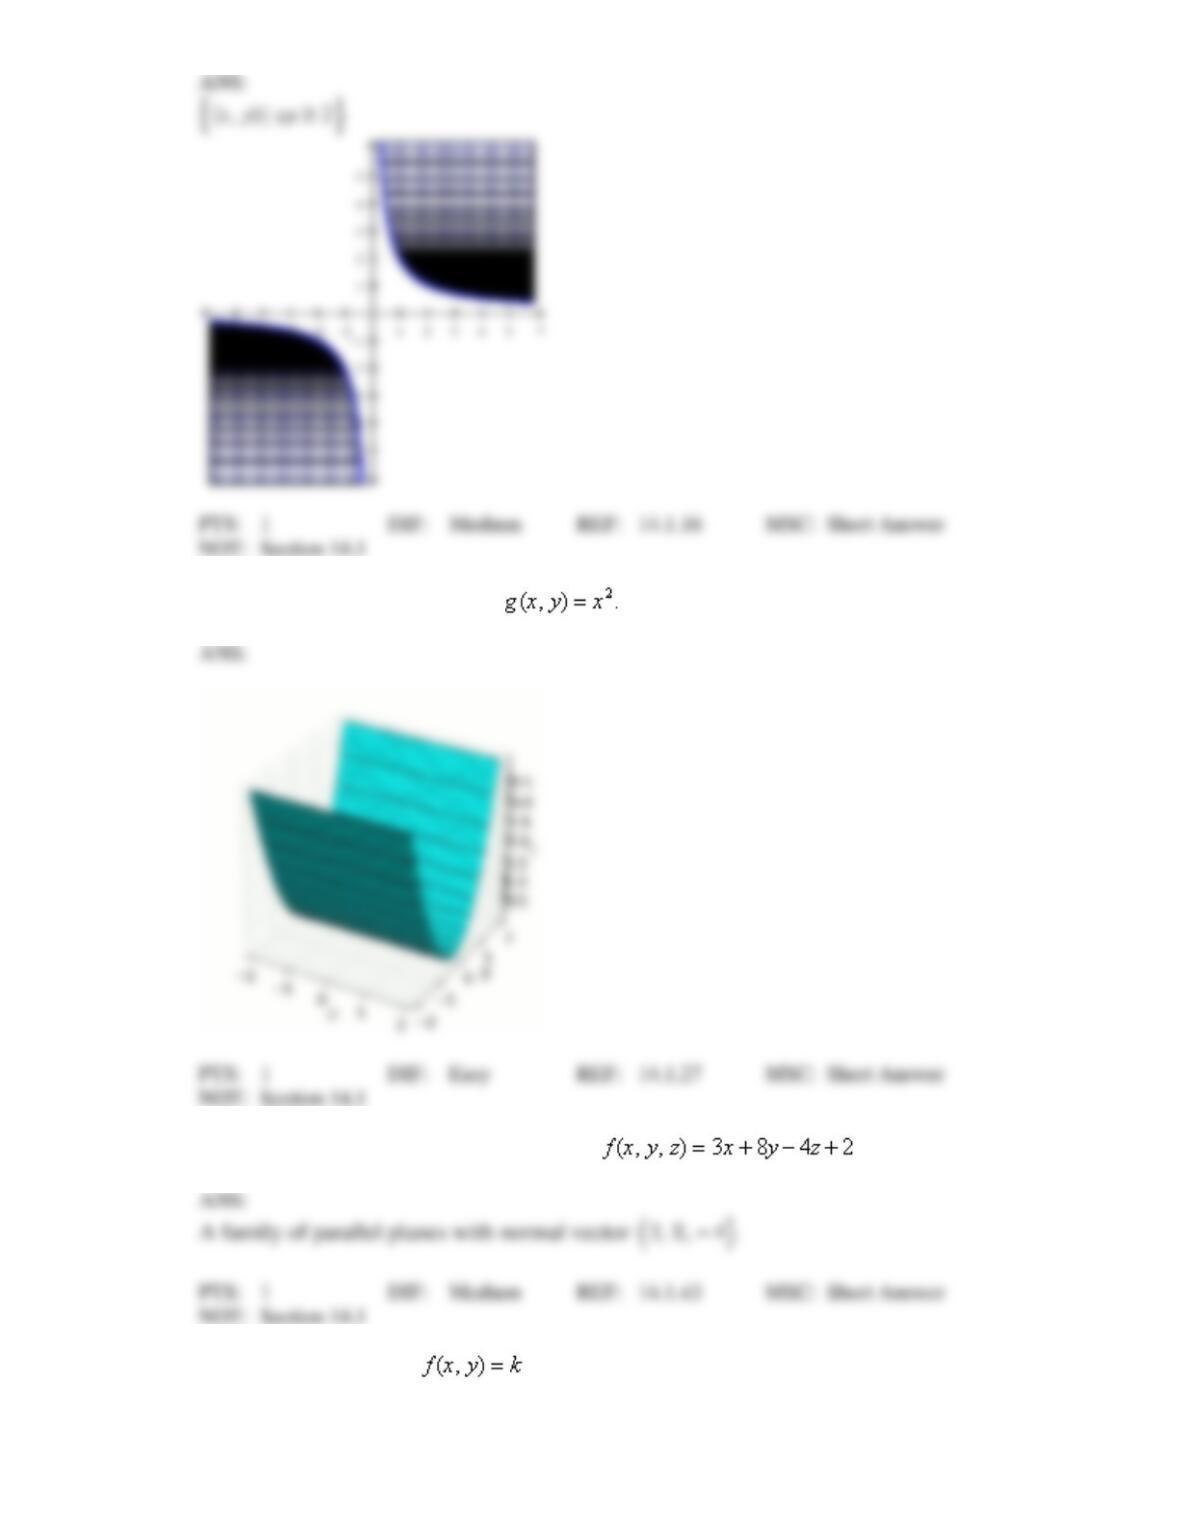
2. Sketch the graph of the function
3. Describe the level survaces of the function .
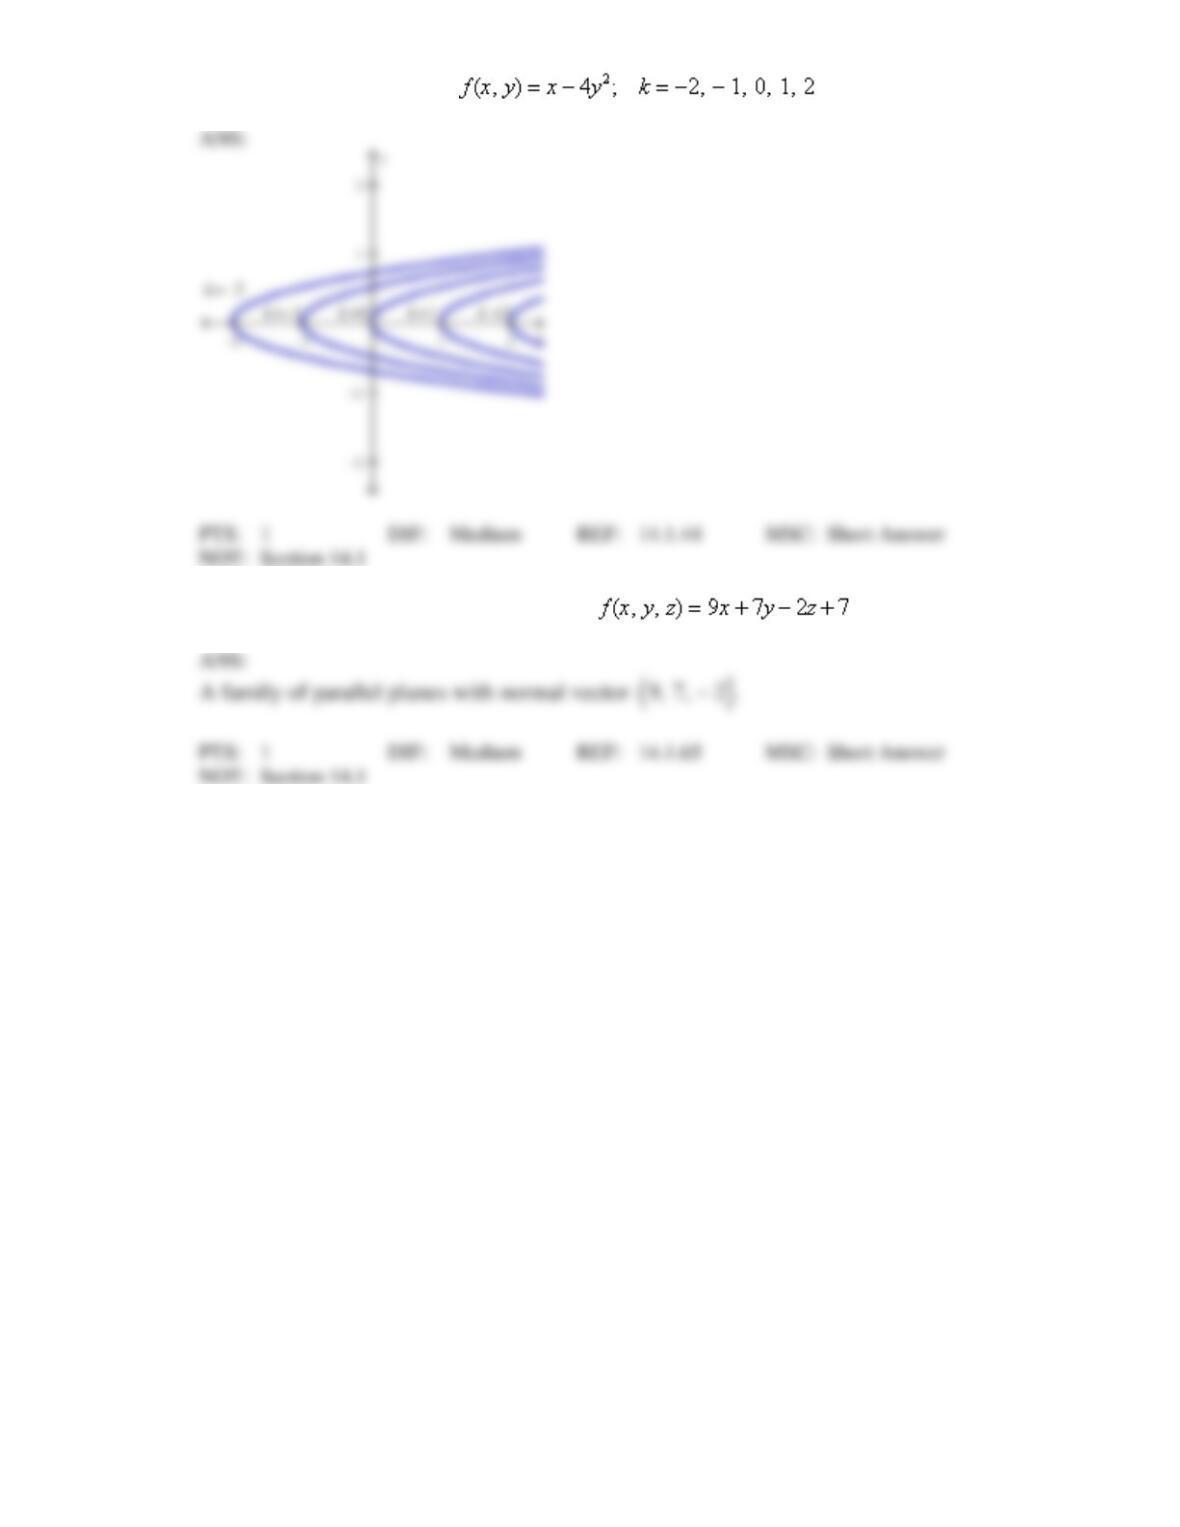
4. Sketch the level curves of the function for the indicated values of k.
5. Describe the level surfaces of the function .