14-1
Chapter 14: Inference for Regression – Quiz A Name_________________________
Use the following for questions 1 – 7:
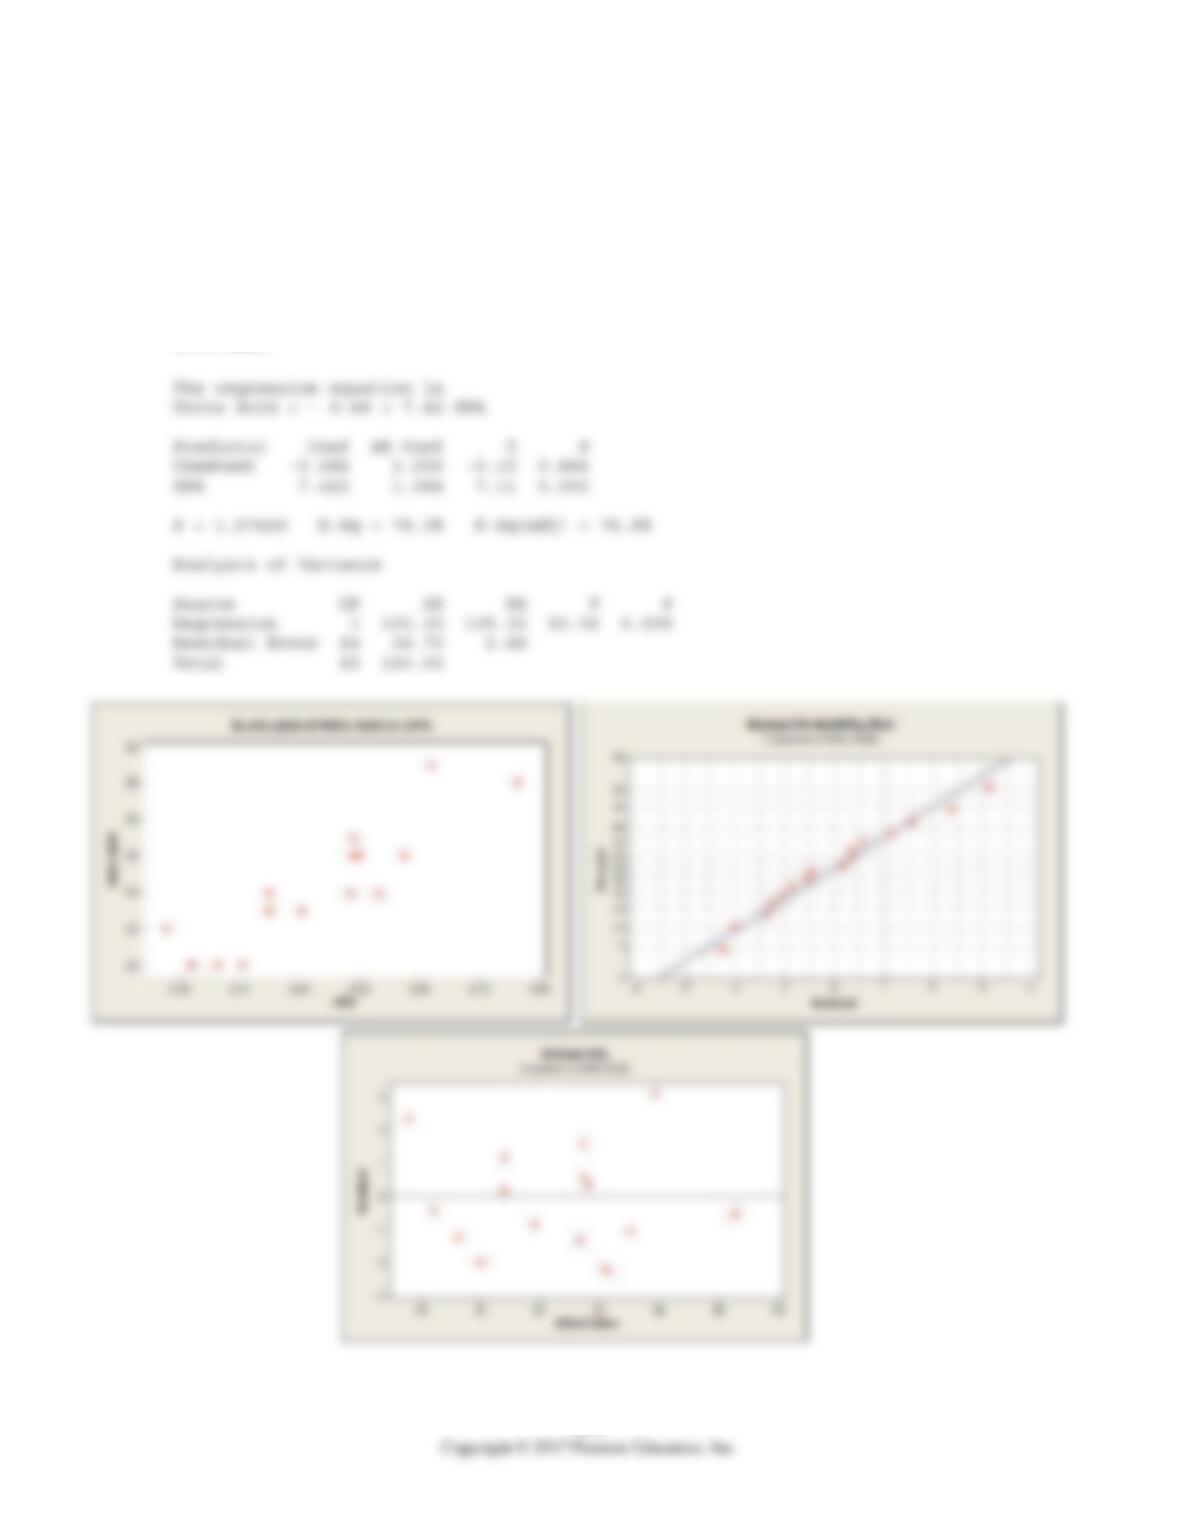
A sales manager was interested in determining if there is a relationship between college
GPA and sales performance among salespeople hired within the last year. A sample of
recently hired salespeople was selected and college GPA and the number of units sold
last month recorded. Below are the scatterplot, regression results, and residual plots for
these data.
14-2 Chapter 14 Inference for Regression
14.2.3 Check the assumptions and conditions for regression inference.
1. List each of the four conditions for regression and inference and describe whether or
not they are satisfied.
14.1.2 Conduct inference on the slope of a regression equation.
2. What is the independent variable in this regression? Write the null and alternative
hypothesis to test the slope of this variable.
14.1.2 Conduct inference on the slope of a regression equation.
3. Test the hypotheses about the slope of the regression line. Give the appropriate test
statistic, associated P-value, and conclusion in terms of the problem.
14.1.1 Use regression equations to make predictions and calculate residuals and standard
errors.
4. Circle the standard error of the slope and its components in the output shown. If the
information is not in the output, list components.
14.1.5 Interpret technology outputs.
5. What percentage of the variability in sales performance (units sold per month) can be
accounted for by college GPA?
14.1.1 Use regression equations to make predictions and calculate residuals and standard
errors.
6. Predict the units sold per month for a new hire whose college GPA is 3.00.
14.4.4 Create, interpret, and apply confidence and prediction intervals.
7. The confidence interval and prediction interval for the number of units sold per
month when GPA = 3.00 are shown below. Write a sentence to interpret each
interval in this context.
Quiz A 14-3
Use the following information for questions 8-9:
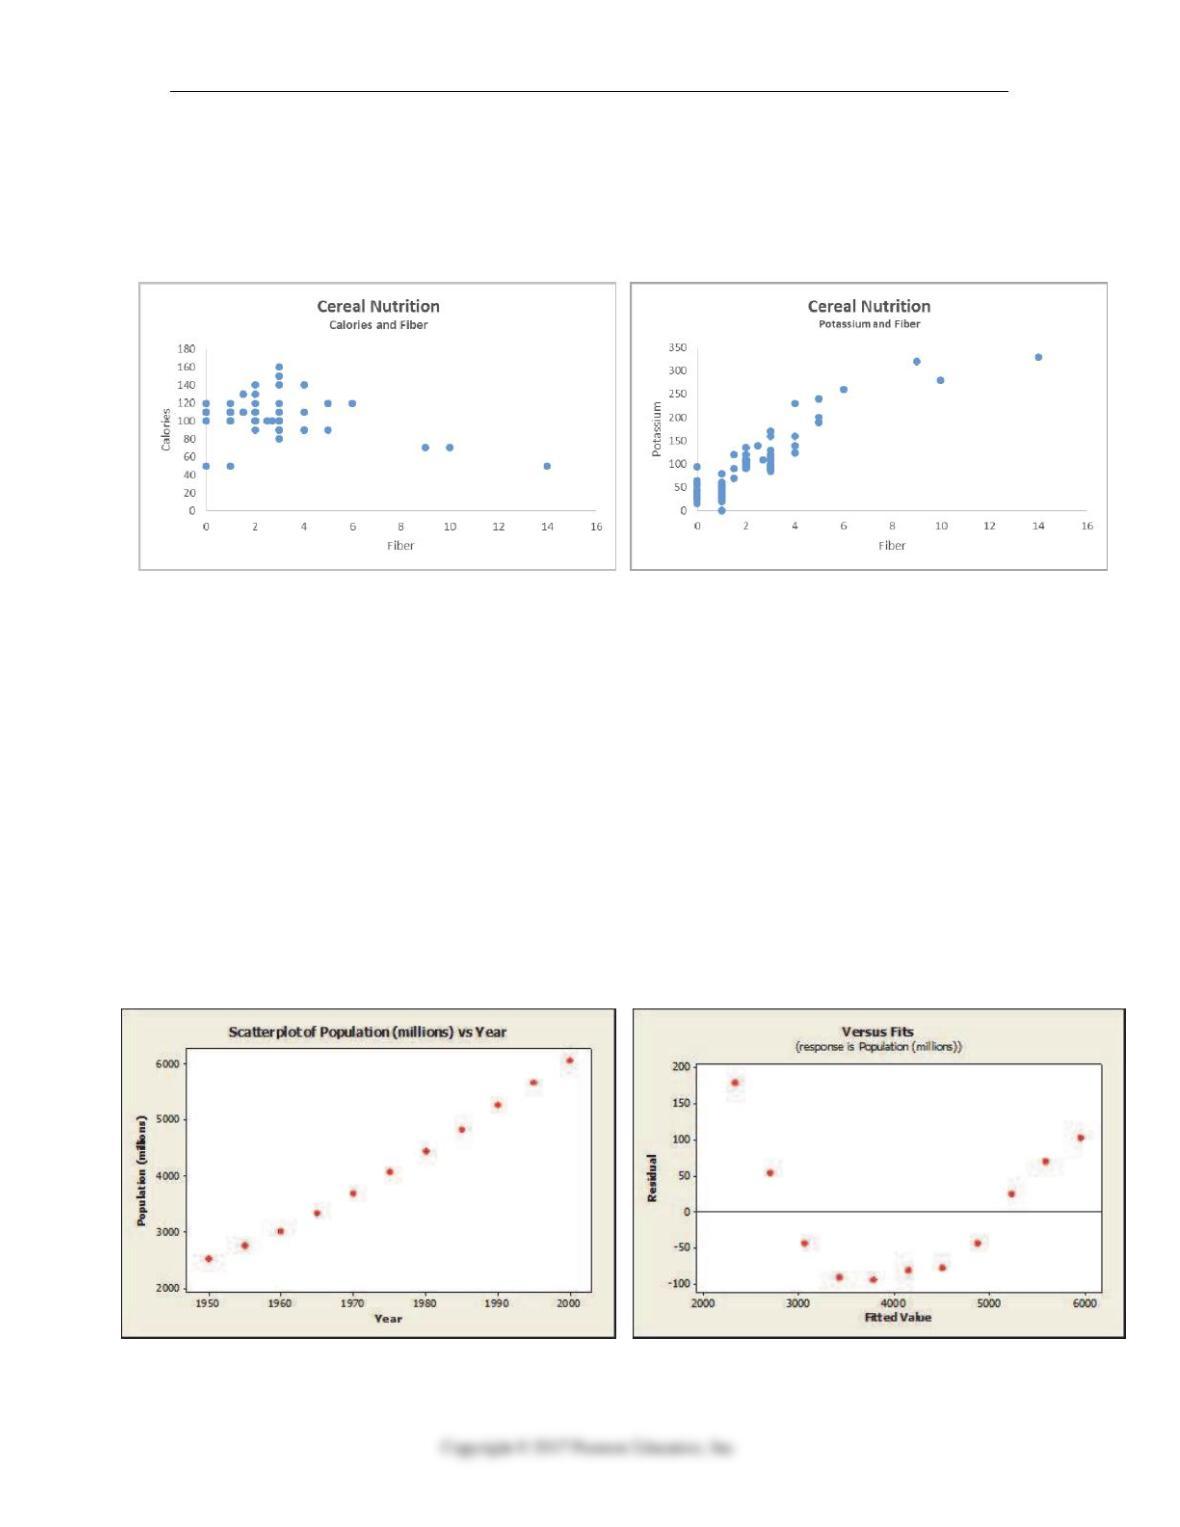
Nutritional information was collected for 77 breakfast cereals including the amount of
fiber (in grams), potassium (in mg), and the number of calories per serving. The data
resulted in the following scatterplots.
14.1.1 Check the assumptions and conditions for regression inference.
8. From which of these plots would you expect a more consistent regression slope
estimate? Why?
14.3. Check the assumptions and conditions for regression inference.
9. Compare the two plots with respect to the aspects that would affect the standard error
of the regression slope?
14.2.3 Check the assumptions and conditions for regression inference.
10. The following plots show (1) world population (millions) plotted against 5-year
intervals from 1950 through 2000 and (2) residual vs. fitted value for a linear
regression model estimated to describe the trend in world population over time.
Based on these plots, would you consider this model appropriate? Explain.
.
(1) (2)
14-4 Chapter 14 Inference for Regression
Chapter 14: Inference for Regression – Quiz A – Key
Use the following for questions 1 – 7:
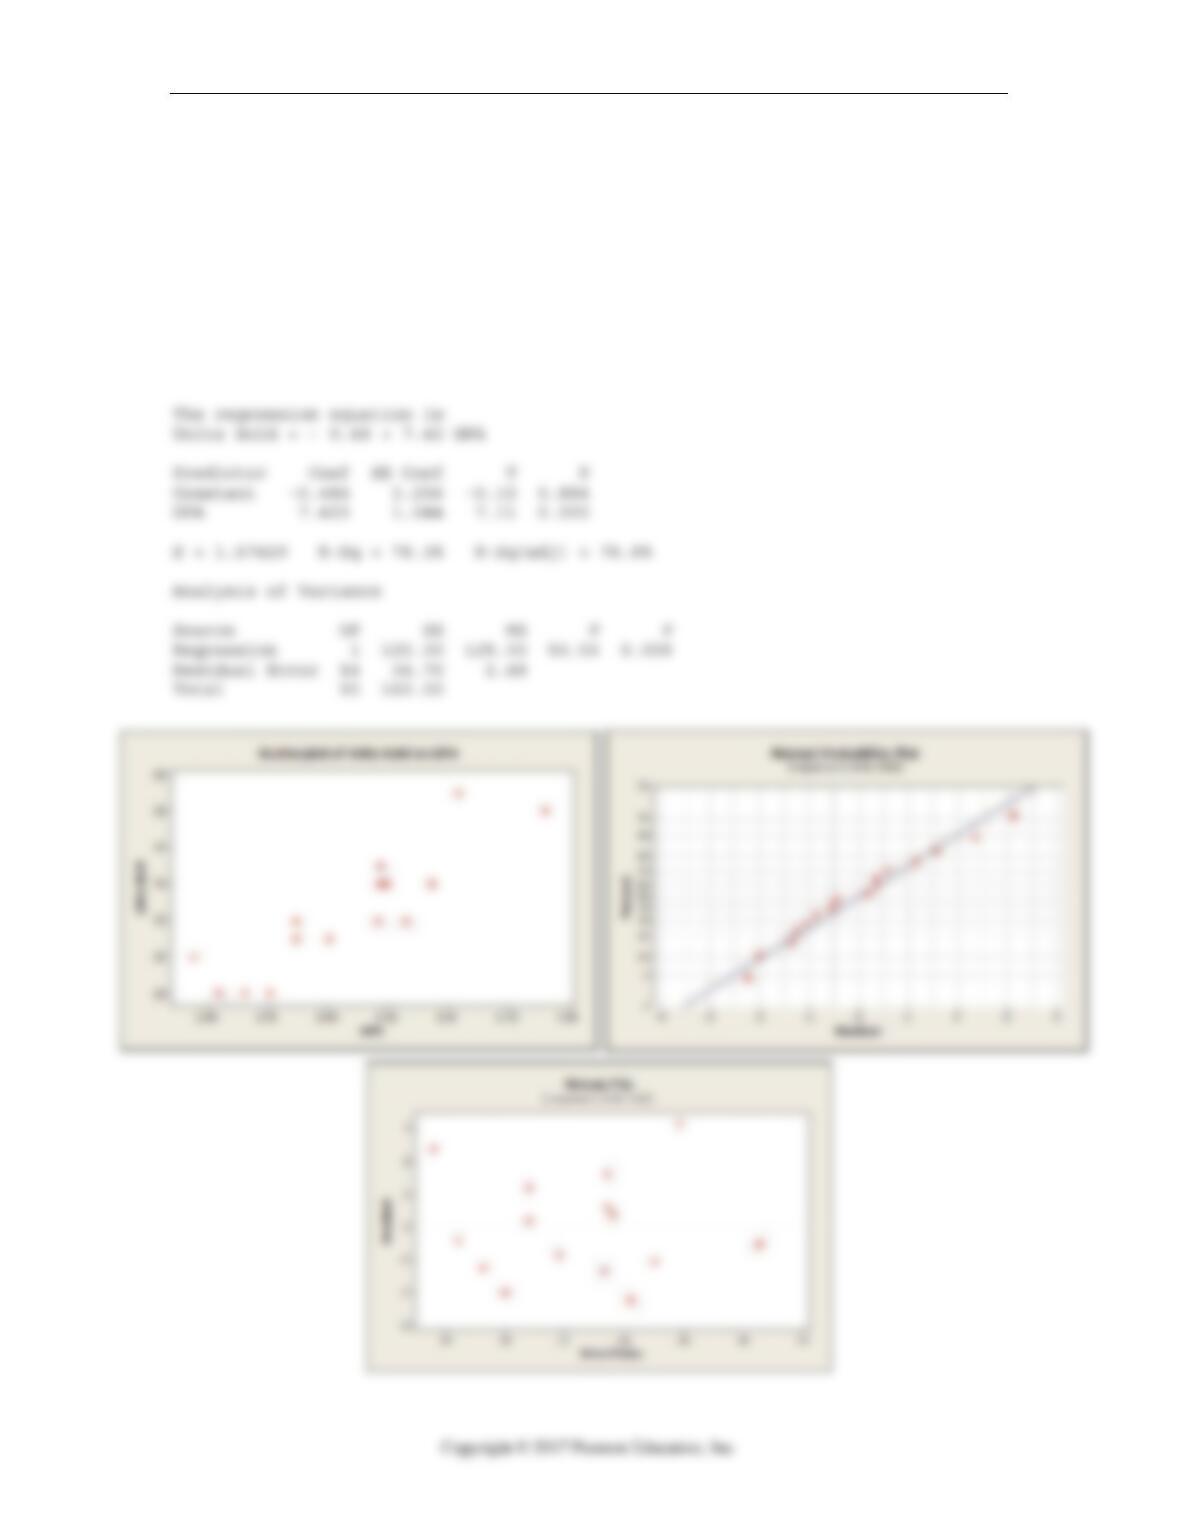
A sales manager was interested in determining if there is a relationship between college
GPA and sales performance among salespeople hired within the last year. A sample of
recently hired salespeople was selected and college GPA and the number of units sold
last month recorded. Below are the scatterplot, regression results, and residual plots for
these data.
Quiz A 14-5
1. List each of the four conditions for regression and inference and describe whether or
not they are satisfied.
2. What is the independent variable in this regression? Write the null and alternative
hypothesis to test the slope of this variable.
3. Test the hypotheses about the slope of the regression line. Give the appropriate test
statistic, associated P-value, and conclusion in terms of the problem.
4. Circle the standard error of the slope and its components in the output shown. If the
information is not in the output, list components.
5. What percentage of the variability in sales performance (units sold per month) can be
accounted for by college GPA?
6. Predict the units sold per month for a new hire whose college GPA is 3.00.
14-6 Chapter 14 Inference for Regression
7. The confidence interval and prediction interval for the number of units sold per
month when GPA = 3.00 are shown below. Write a sentence to interpret each
interval in this context.
Use the following information for questions 8-9:
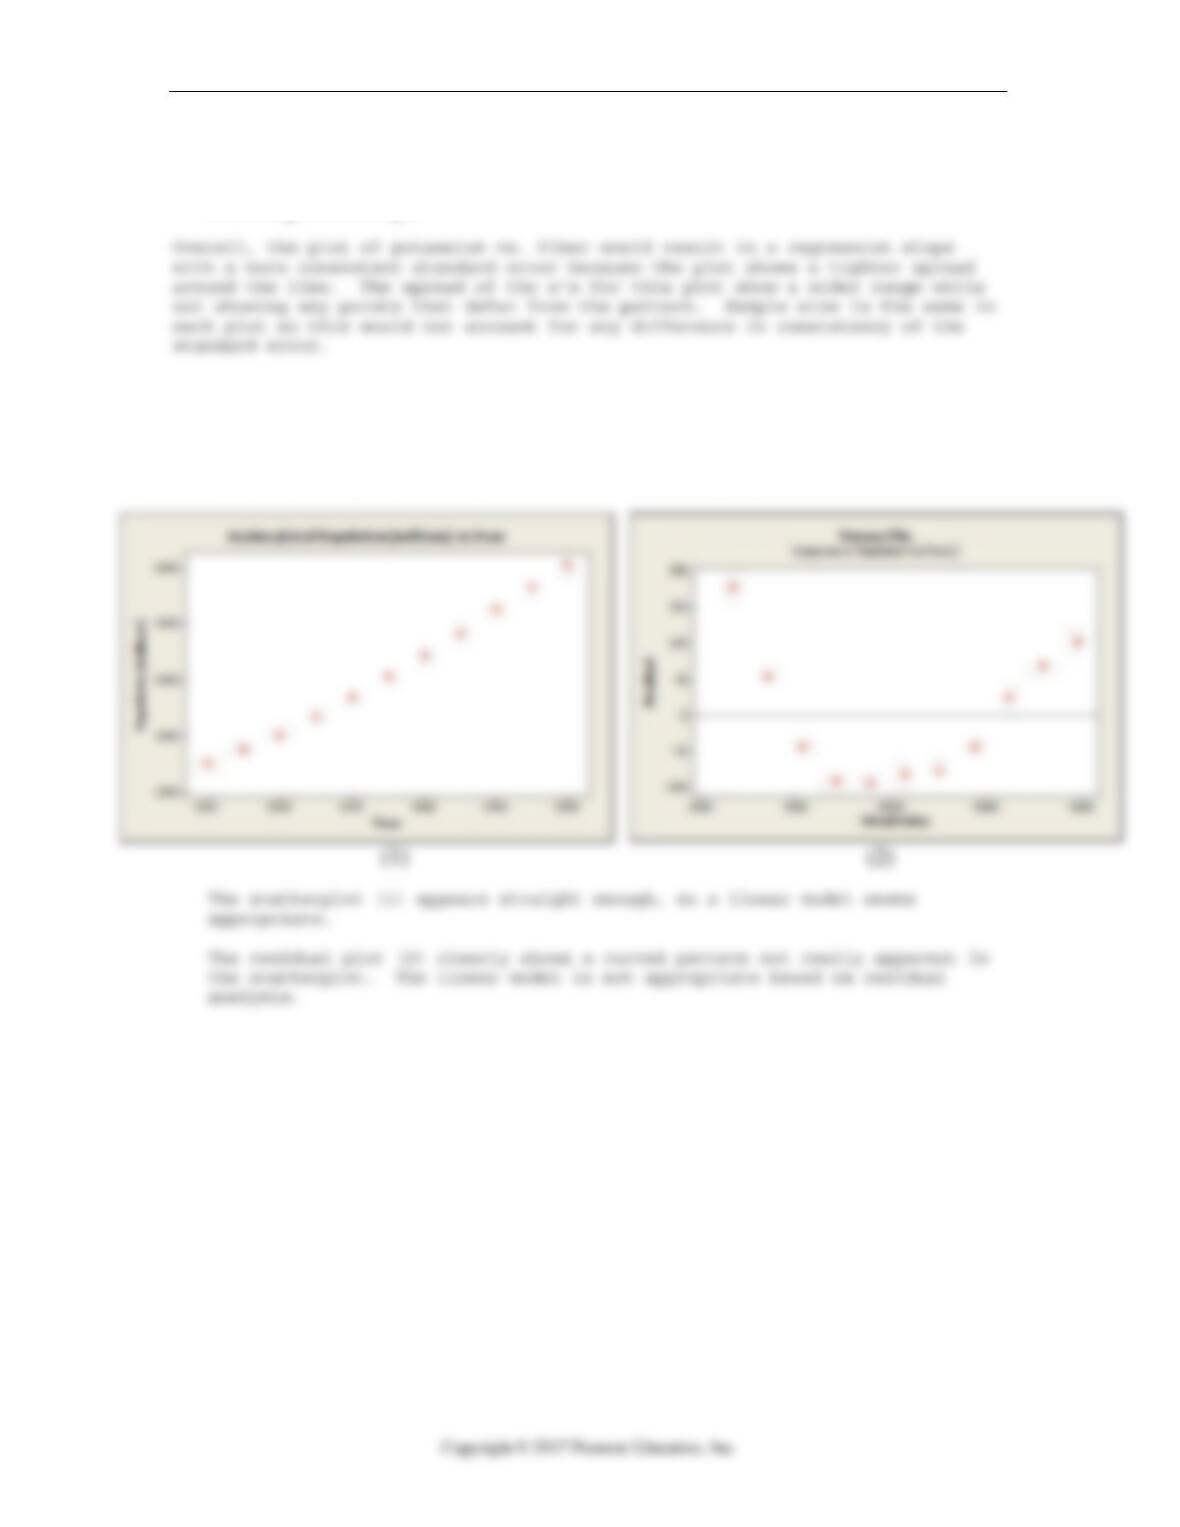
Nutritional information was collected for 77 breakfast cereals including the amount of
fiber (in grams), potassium (in mg), and the number of calories per serving. The data
resulted in the following scatterplots.
8. From which of these plots would you expect a more consistent regression slope
estimate? Why?
Quiz A 14-7
9. Compare the two plots with respect to the aspects that would affect the standard error
of the regression slope?
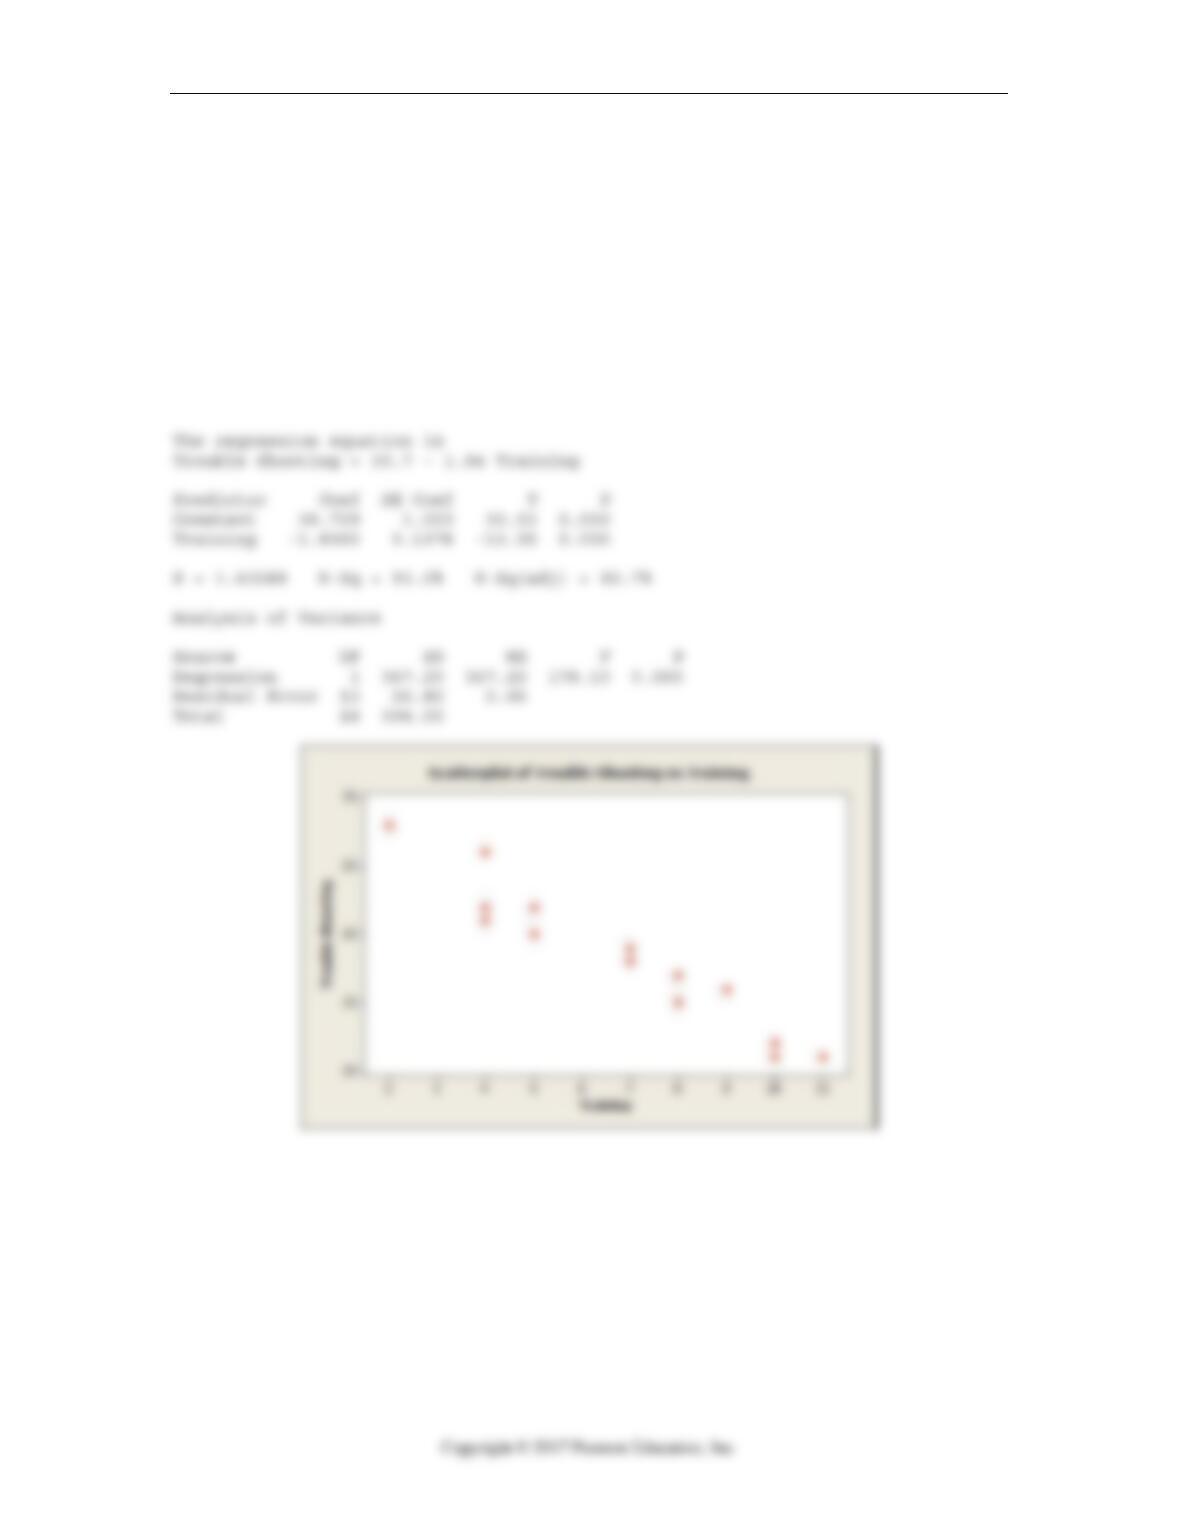
10. The following plots show (1) world population (millions) plotted against 5-year
intervals from 1950 through 2000 and (2) residual vs. fitted value for a linear
regression model estimated to describe the trend in world population over time.
Based on these plots, would you consider this model appropriate? Explain..
14-8 Chapter 14 Inference for Regression
Chapter 14: Inference for Regression – Quiz B Name_________________________
Use the following for questions 1 – 7:
An operations manager was interested in determining if there is a relationship between
the amount of training received by production line workers and the time it takes for them
to troubleshoot a process problem. A sample of recently trained line workers was
selected. The number of hours of training time received and the time it took (in minutes)
for them to troubleshoot their last process problem were captured. Below are the
scatterplot, regression results, and residual plots for these data.
14.2.3 Check the assumptions and conditions for regression inference.
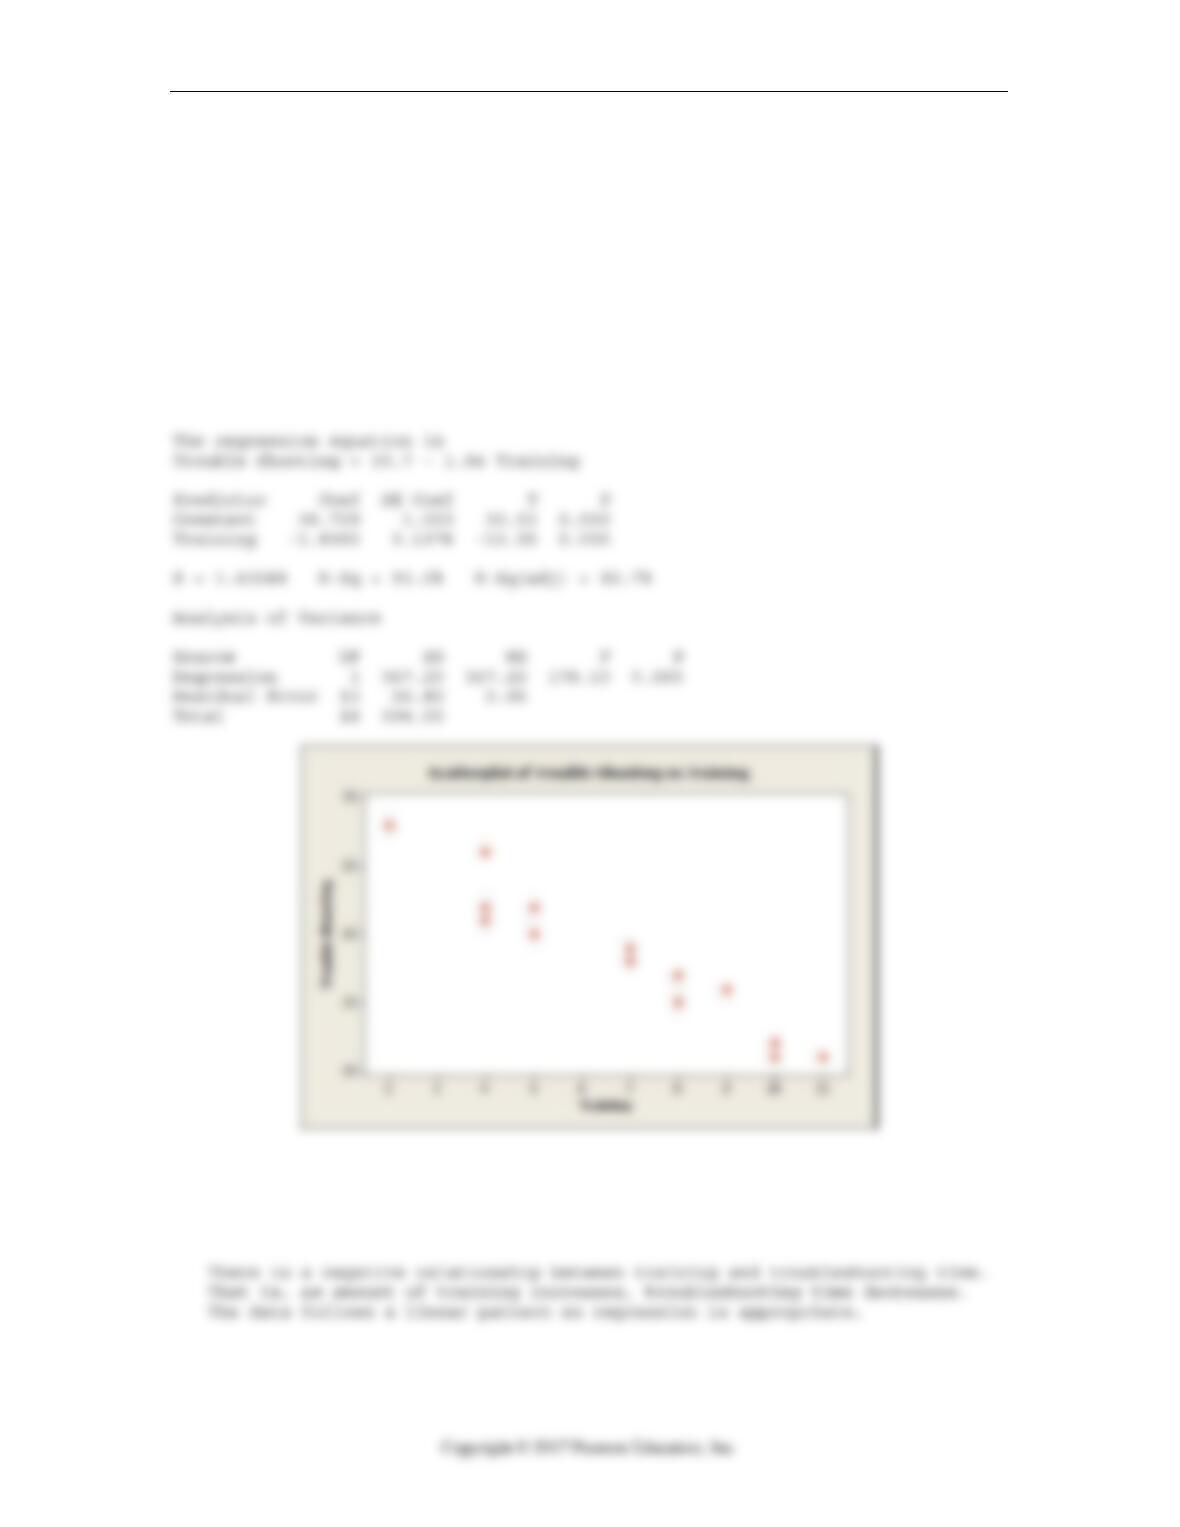
1. Based on the scatterplot, what is the relationship between training and
troubleshooting? Is a regression appropriate for this data? Why or why not?

Quiz B 14-9
14.1.5 Interpret technology outputs.
2. From the output, write the equation of the regression equation that can be used to
predict troubleshooting time.
14.1.2 Conduct inference on the slope of a regression equation.
3. Is there a significant relationship between time it takes to troubleshoot the process
(minutes) and training received (use α = .05)? Give the appropriate test statistic,
associated P-value, and conclusion.
14.1.5 Interpret technology outputs.
4. Write a sentence to interpret the coefficient of training in the regression equation.
14.1.1 Use regression equations to make predictions and calculate residuals and standard
errors.
5. Predict the troubleshooting time for a line worker who received 8 hours of training.
14.4.4 Create, interpret, and apply confidence and prediction intervals.
6. The 95% confidence interval for troubleshooting time with 8 hours of training is
(15.180, 16.903). Interpret this interval with respect to the estimated troubleshooting
time.
14.1.1 Use regression equations to make predictions and calculate residuals and standard
errors.
7. According to the data, a worker who received 8 hours of training had a
troubleshooting time of 15 minutes. What is the value of the residual for this worker?
Explain what the residual means.
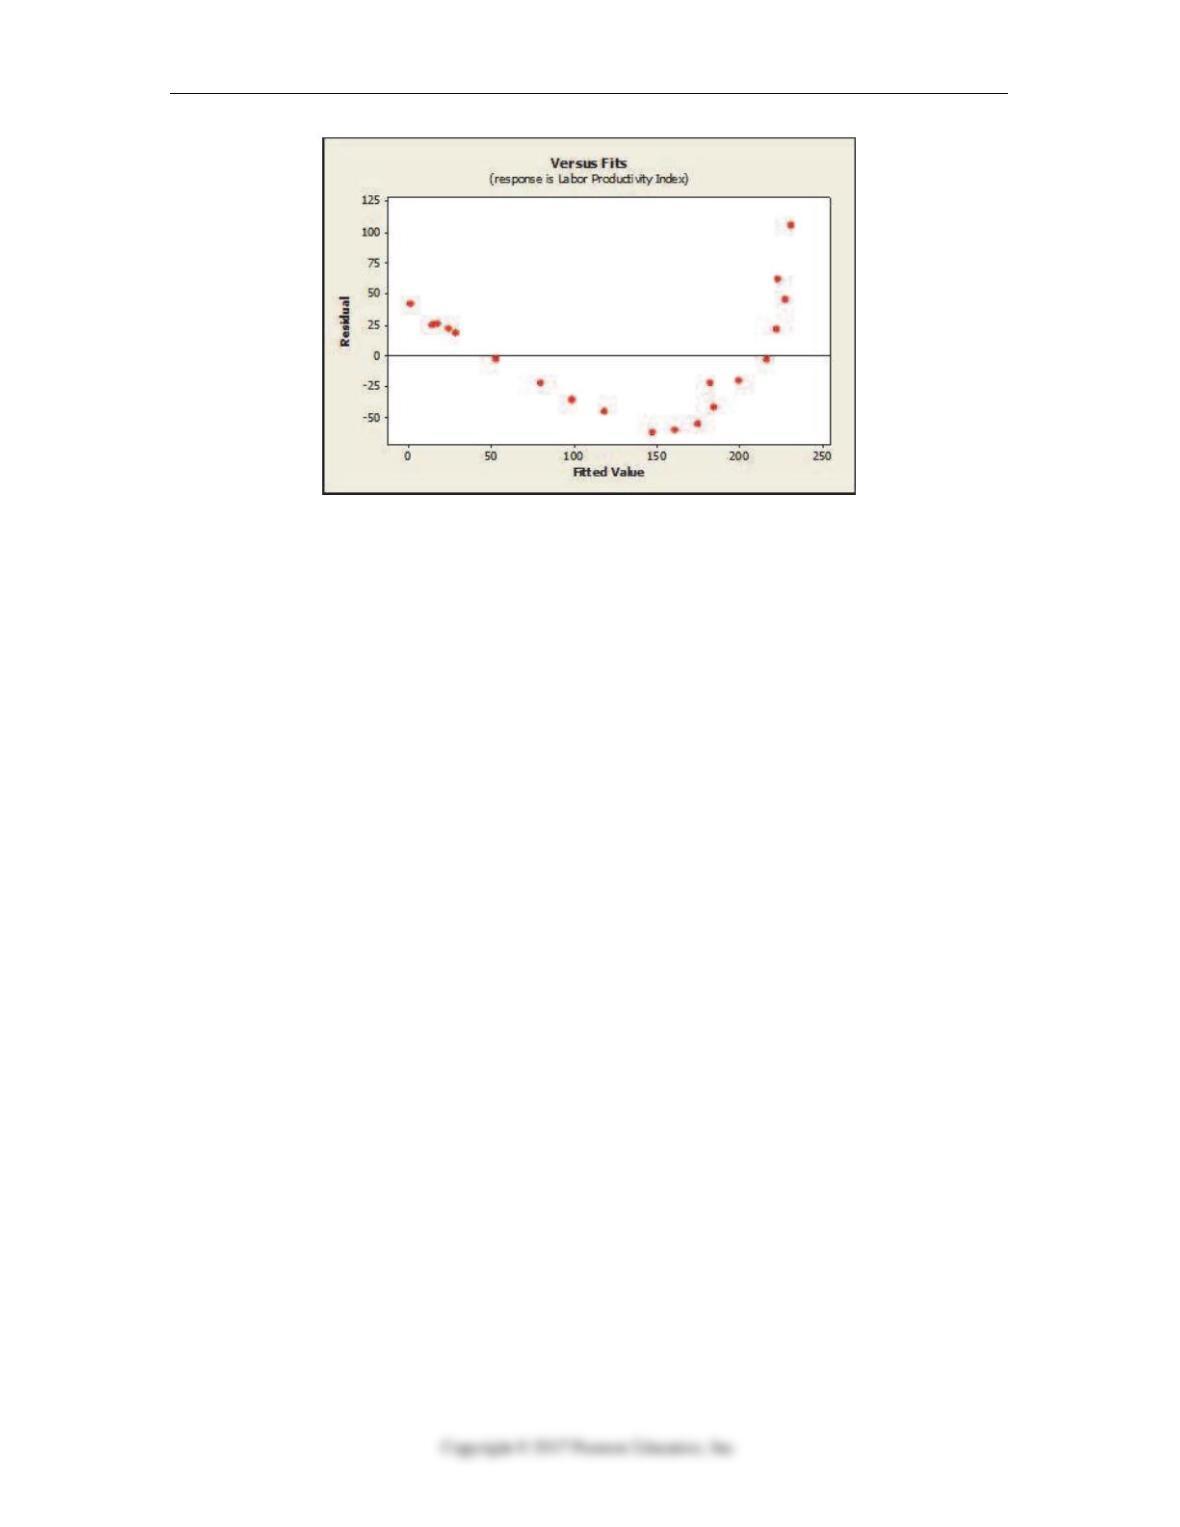
14.1.3 Check the assumptions and conditions for regression inference.
8. Data on labor productivity and unit labor costs were obtained for the retail industry
from 1987 through 2006 (Bureau of Labor Statistics). A regression was estimated to
describe the linear relationship between the two variables. Based on the plot of
residuals versus predicted values, is the linear model appropriate? Explain.
14-10 Chapter 14 Inference for Regression
Quiz B 14-11
Chapter 14: Inference for Regression – Quiz B – Key
Use the following for questions 1 – 7:
An operations manager was interested in determining if there is a relationship between
the amount of training received by production line workers and the time it takes for them
to troubleshoot a process problem. A sample of recently trained line workers was
selected. The number of hours of training time received and the time it took (in minutes)
for them to troubleshoot their last process problem were captured. Below are the
scatterplot, regression results, and residual plots for these data.
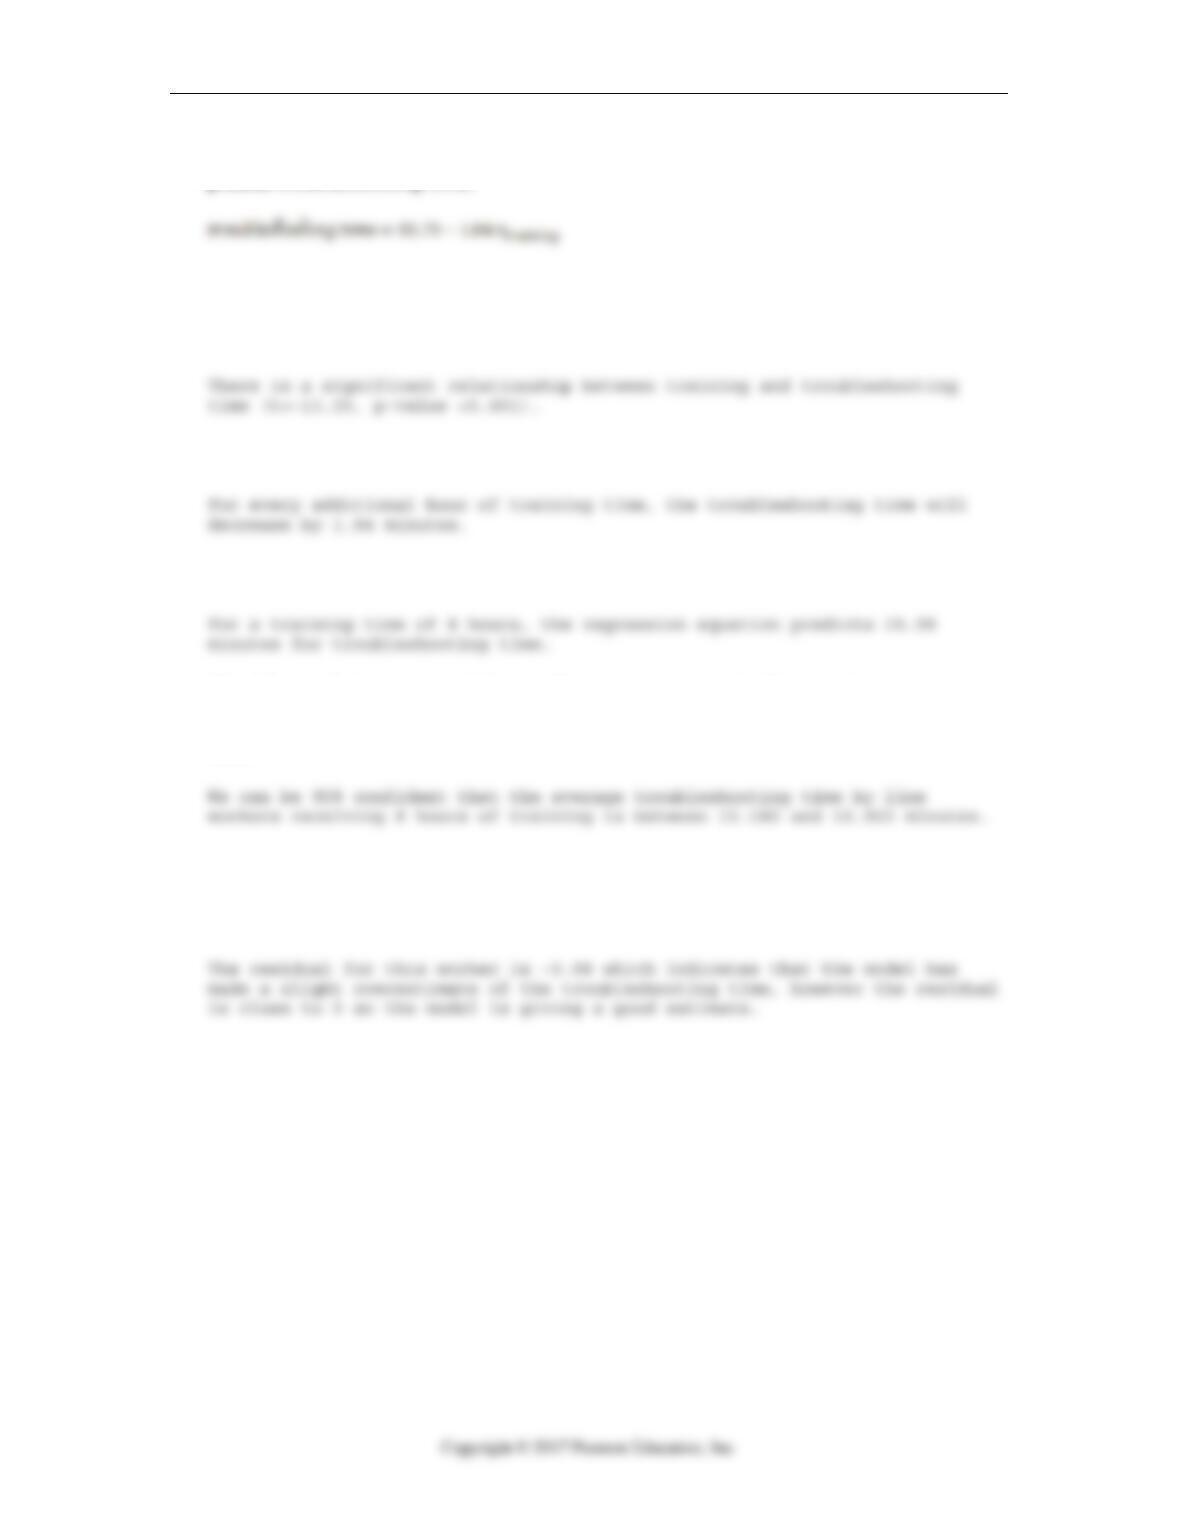
1. Based on the scatterplot, what is the relationship between training and
troubleshooting? Is a regression appropriate for this data? Why or why not?
14-12 Chapter 14 Inference for Regression
2. From the output, write the equation of the regression equation that can be used to
predict troubleshooting time.
3. Is there a significant relationship between time it takes to troubleshoot the process
(minutes) and training received (use α = .05)? Give the appropriate test statistic,
associated P-value, and conclusion.
4. Write a sentence to interpret the coefficient of training in the regression equation.
5. Predict the troubleshooting time for a line worker who received 8 hours of training.
6. The 95% confidence interval for troubleshooting time with 8 hours of training is
(15.180, 16.903). Interpret this interval with respect to the estimated troubleshooting
time.
7. According to the data, a worker who received 8 hours of training had a
troubleshooting time of 15 minutes. What is the value of the residual for this worker?
Explain what the residual means.