Chapter 13—Hypothesis Tests Applied to
Means: Two Related Samples
MULTIPLE CHOICE QUESTIONS
13.1 Which of the following terms does NOT belong with the rest?
13.2 We treat the repeated sample case differently from the case involving two
separate samples because of
13.3+ We want to study the mean difference in autonomy between first-born and
second-born children. Instead of taking a random sample of children we take a
random sample of families and sort the children into first- and second-born. The
dependent variable is a measure of autonomy. This experiment would most likely
employ
13.4 In the preceding question on autonomy in children, we would be most likely to
use that design, rather than random sampling of children, because
13.5 We would be least likely to use a repeated measures design when
Test Bank
312
13.6 A difference score is obtained by
13.7 The mean of a column of difference scores is equal to
13.8 We are evaluating a method of therapy for extremely underweight adolescent
girls. If we weighed our subjects at the beginning and end of therapy, a difference
in weight could mean
13.9 If we test the mean amount that alcoholic subjects drink before and after therapy,
and that difference is NOT statistically significant, this could mean
13.10+ A repeated measures t test is more likely to lead to rejection of the null hypothesis
if
13.11+ The null hypothesis in a repeated measures t test is
Chapter 13
13.12+ A t test, in general, involves
In Chapter 13 the calculation for a repeated measures t test on change within subjects is
given as
18.4
73.1
26.7
17
16.7
026.7 ==
−
=t
Use this formula for the next several questions.
13.13+ In the formula for t, there are _______ pairs of observations in the study.
13.14+ In the formula for t, 1.73 is
13.15+ If the critical value of t associated with the above formula is 2.12, what would you
conclude about your means?
13.16 In a repeated measures t, the degrees of freedom are equal to
Test Bank
314
13.17 Which of the following are reasons why we might NOT use a repeated measures
t?
13.18+ Which of the following was NOT an advantage of repeated measures designs
discussed in the text?
13.19+ Which of the following is sometimes a serious problem with repeated measures
designs?
13.20 The standard error of the mean of difference scores could be calculated by
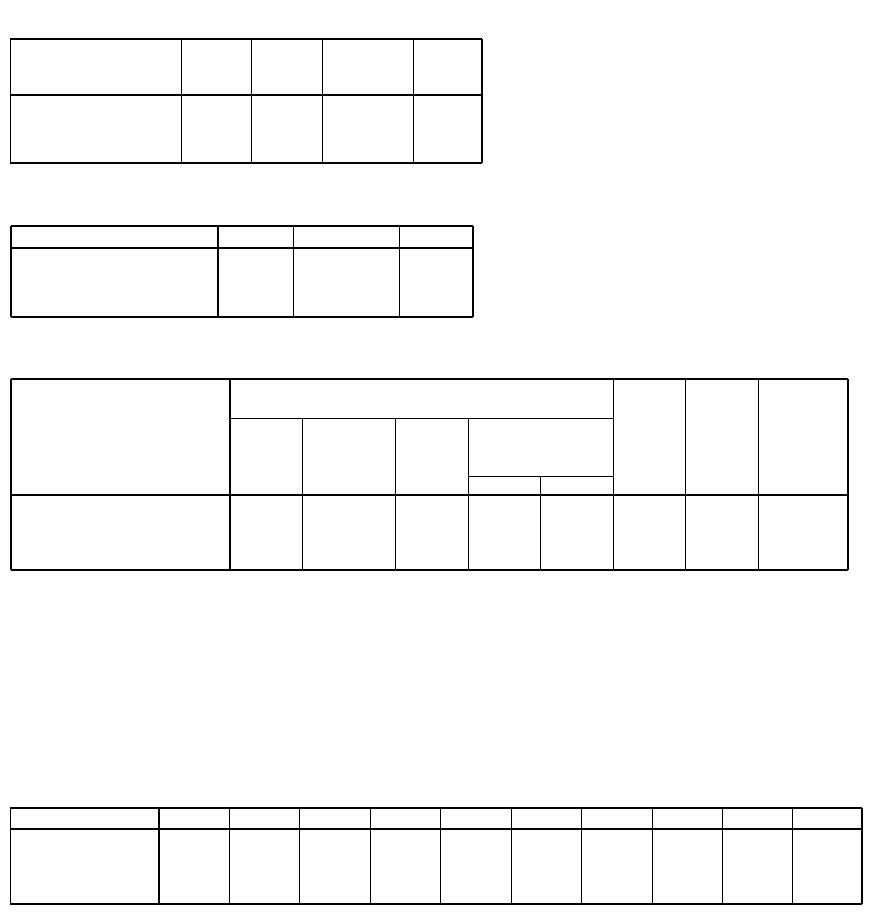
The following is part of the printout from an SPSS analysis of data on paired samples.
Use it to answer the next several questions.
Paired Samples Test
Paired Differences
t
df
Sig. (2-
tailed)
Mean
Std.
Devia
tion
Std.
Error
Mean
95% Confidence
Interval of the
Difference
Lower
Upper
ELEVATED
– LEVEL
.0190
.1371
4.3E-02
-.0791
.1171
.438
9
.672
Chapter 13
13.21 In the output, the value of .1371 stands for
13.22+ The 2-tailed significance level tells us
13.23 The confidence limits in the output can best be interpreted to mean
13.24+ The standard error of the mean would normally be written
13.25 If the effect of the first measurement influences what the subject does on the
second measurement, we would name this
13.26 In the Kaufman and Rock (1972) moon illusion example in the text, they
hypothesized that there would be no moon illusion in their experiment.
Experiments of this type pose problems for researchers because
Test Bank
316
13.27 The t test for two related measures
13.28 In the t test for repeated measures the symbol
sD
stands for the
13.29 The standard error of the difference between two means is
13.30 If two sets of measures have the same mean, but different variances, the resulting
t will be closest to
13.31+ As the value of the mean difference score decreases
13.32 The difference between the values of degrees of freedom for one sample t tests
and related means t tests is that
13.33+ The null hypothesis of a related scores t test is
Chapter 13
317
13.34 An experimenter collected data on how well a study guide improved grades on an
exam taken late in the semester compared to an exam taken early in the semester.
Using a related sample means t test, the results showed that later grades were
higher than early grades (t(74) = 3.64, p < .05). Which of the following was NOT
an advantage of this design?
13.35 If the experimenter had instead used an independent samples design with the same
number of participants
13.36 Suppose that we take 15 gay couples and observe the difference within couples in
terms of age. Then we take 15 straight couples are record the same differences.
We want to test if straight couples are more similar in age than gay couples.
(There is some reason to expect that this is true.) What statistical procedure would
be most appropriate?
13.37 When we have related samples, the best measure of the effect size
ˆ
d
uses
13.38+ The example of the moon illusion discussed in the text illustrates the fact that
13.39+ Cohen’s d refers to
Test Bank
318
TRUE/FALSE QUESTIONS
independent.
designs to achieve the same degree of statistical power.
samples designs than in independent samples designs.
one another.
deviations of the two variables being compared.
took the SAT in 2000 scored higher than students who took the SAT in 2002.
difference in standard deviations for the two variables being compared.
OPEN-ENDED QUESTIONS
13.50 Generate three examples of research questions that are appropriate for testing with
a related samples t-test.
13.51 Give an example in which carryover effects may impact a repeated measures
design unduly.
13.52 A kindergarten teacher wanted to see if her students’ social skills changed over
the academic year. She compared the scores on a standardized measure of social
skills at the beginning of the year, and the end of the year. The results follow:
.20;3;7 === NsD D
a) What is the null hypothesis?
b) Is a one or two-tailed test more appropriate?
c) Calculate t.
d) Write a sentence explaining the results.
13.53 A researcher hypothesized that adolescent girls are more invested in their
romantic relationships than are adolescent boys. She asked adolescent partners to
Chapter 13
319
rate the total amount of time they engaged in activities centered around their
relationship (e.g., seeing each other, thinking about the partner, talking about the
relationship with others). In a sample of 41 couples, girls spent an average of 12
hours a week and boys an average of 10. The standard deviation of the difference
was 1.5 hours.
a) Calculate t.
b) Was the research hypothesis supported? Explain.
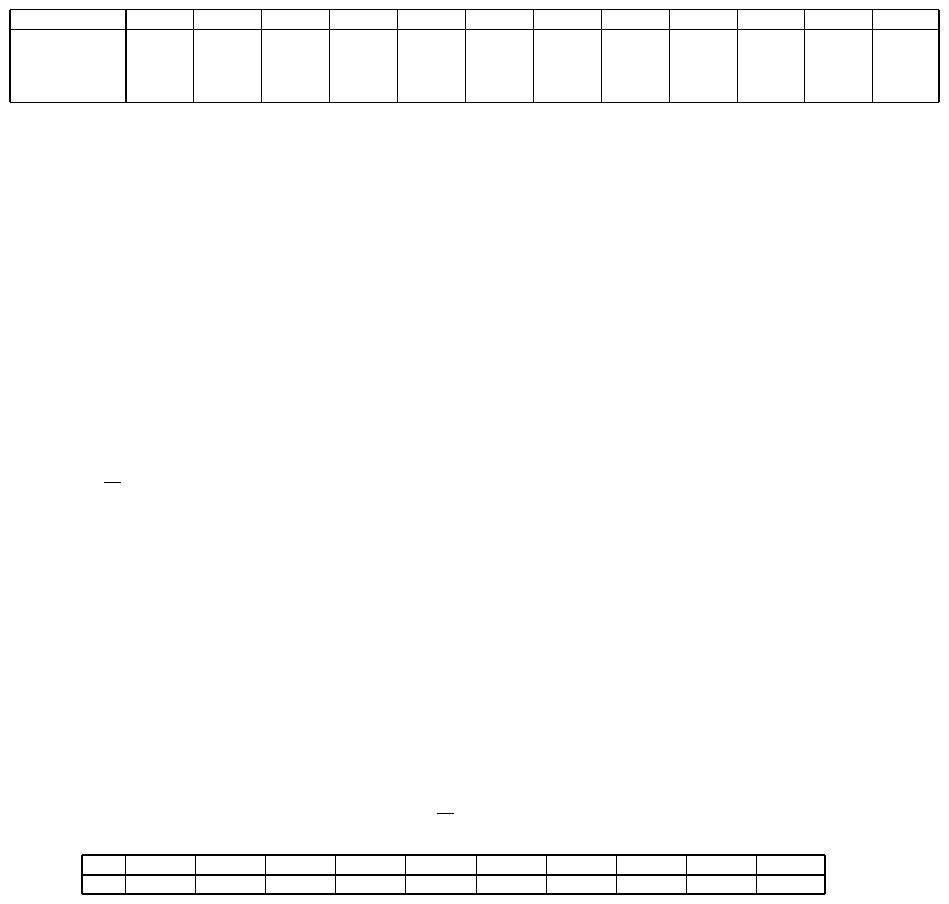
13.54 Answer these questions based on the following SPSS output.
Paired Samples Statistics
5.9600
25
2.8501
.5700
5.5600
25
2.9872
.5974
Mom‘s behavior
problem rating
Dad’s behavior
problem rating
Pair
1
Mean
N
Std.
Deviation
Std.
Error
Mean
Paired Samples Correlations
25
.805
.000
Mom‘s behavior
problem rating &
Dad’s behavior
problem rating
Pair
1
N
Correlation
Sig.
Paired Samples Test
.4000
1.8257
.3651
-.3536
1.1536
1.095
24
.284
Mom‘s behavior
problem rating –
Dad‘s behavior
problem rating
Pair
1
Mean
Std.
Deviation
Std.
Error
Mean
Lower
Upper
95% Confidence
Interval of the
Difference
Paired Differences
t
df
Sig.
(2-tailed)
a) Are mothers’ and fathers’ scores correlated?
b) What is the mean difference in mothers’ and fathers’ scores?
c) Write a sentence interpreting the results of the t-test.
13.55 A psychologist designed a new treatment for depression. He predicted depressive
symptoms would be lower post-treatment. The data follow. Calculate the
difference for each subject, the mean difference, and the standard deviation of the
difference.
16.00
17.00
18.00
19.00
20.00
16.00
30.00
25.00
38.00
20.00
14.00
19.00
13.00
14.00
18.00
13.00
25.00
27.00
20.00
20.00
pre-treatment
depression score
post–treatment
depression score
1
2
3
4
5
6
7
8
9
10
13.56 Calculate and interpret t for the previous data.
13.57 Calculate and interpret the correlation for the previous data.
Test Bank
320
13.58 A research article says, “Students scored higher at the post-test than at the pre-
test, t (29) = 1.30; p < .10.” What would you conclude?
13.59 A student hypothesized that test anxiety increases as the time of the test
approaches. Calculate t and evaluate the hypothesis given the following data.
14
12
10
12
8
10
10
8
12
16
14
12
18
19
14
16
12
18
16
18
16
19
16
16
Anxiety-10
minutes prior
Anxiety-1
mintue prior
1
2
3
4
5
6
7
8
9
10
11
12
Answers to Open-ended Questions
Chapter 13.
13.51 Possible answers include:
Does a drug reduce symptoms of arthritis from pre to post-treatment?
Are husbands and wives similarly satisfied with their marital relationship?
13.52 Giving students the same version of an exam to assess the impact of a study skills
class on achievement would be problematic because students may learn from
taking the exam.
13.53 a)
0=D
b) Two-tailed, because a directional hypothesis was not specified.
c) t = 10.43
d) Children’s social skills improved significantly from the beginning of
kindergarten to the end of the year.
13.54 a) t = 8.53
b) Yes, because t is greater than the critical value.
13.55 a) Yes, they are significantly positively correlated.
b) .40
c) Mothers and fathers did not rate their children’s behavior problems differently.
13.56 The differences are displayed below;
719.5;60.3 == D
sD
2.00
-2.00
5.00
5.00
2.00
3.00
5.00
-2.00
18.00
.00
DIF
1
2
3
4
5
6
7
8
9
10
13.57 t = 1.991; there was a statistically significant reduction in depression following
treatment using a one-tailed test.
13.58 Yes, they are significantly positively correlated.
13.59 The difference is not statistically significant.
13.60 t = 7.54; the data support the hypothesis that test anxiety increases as the time of
the exam approaches.