OM5 C13
a.
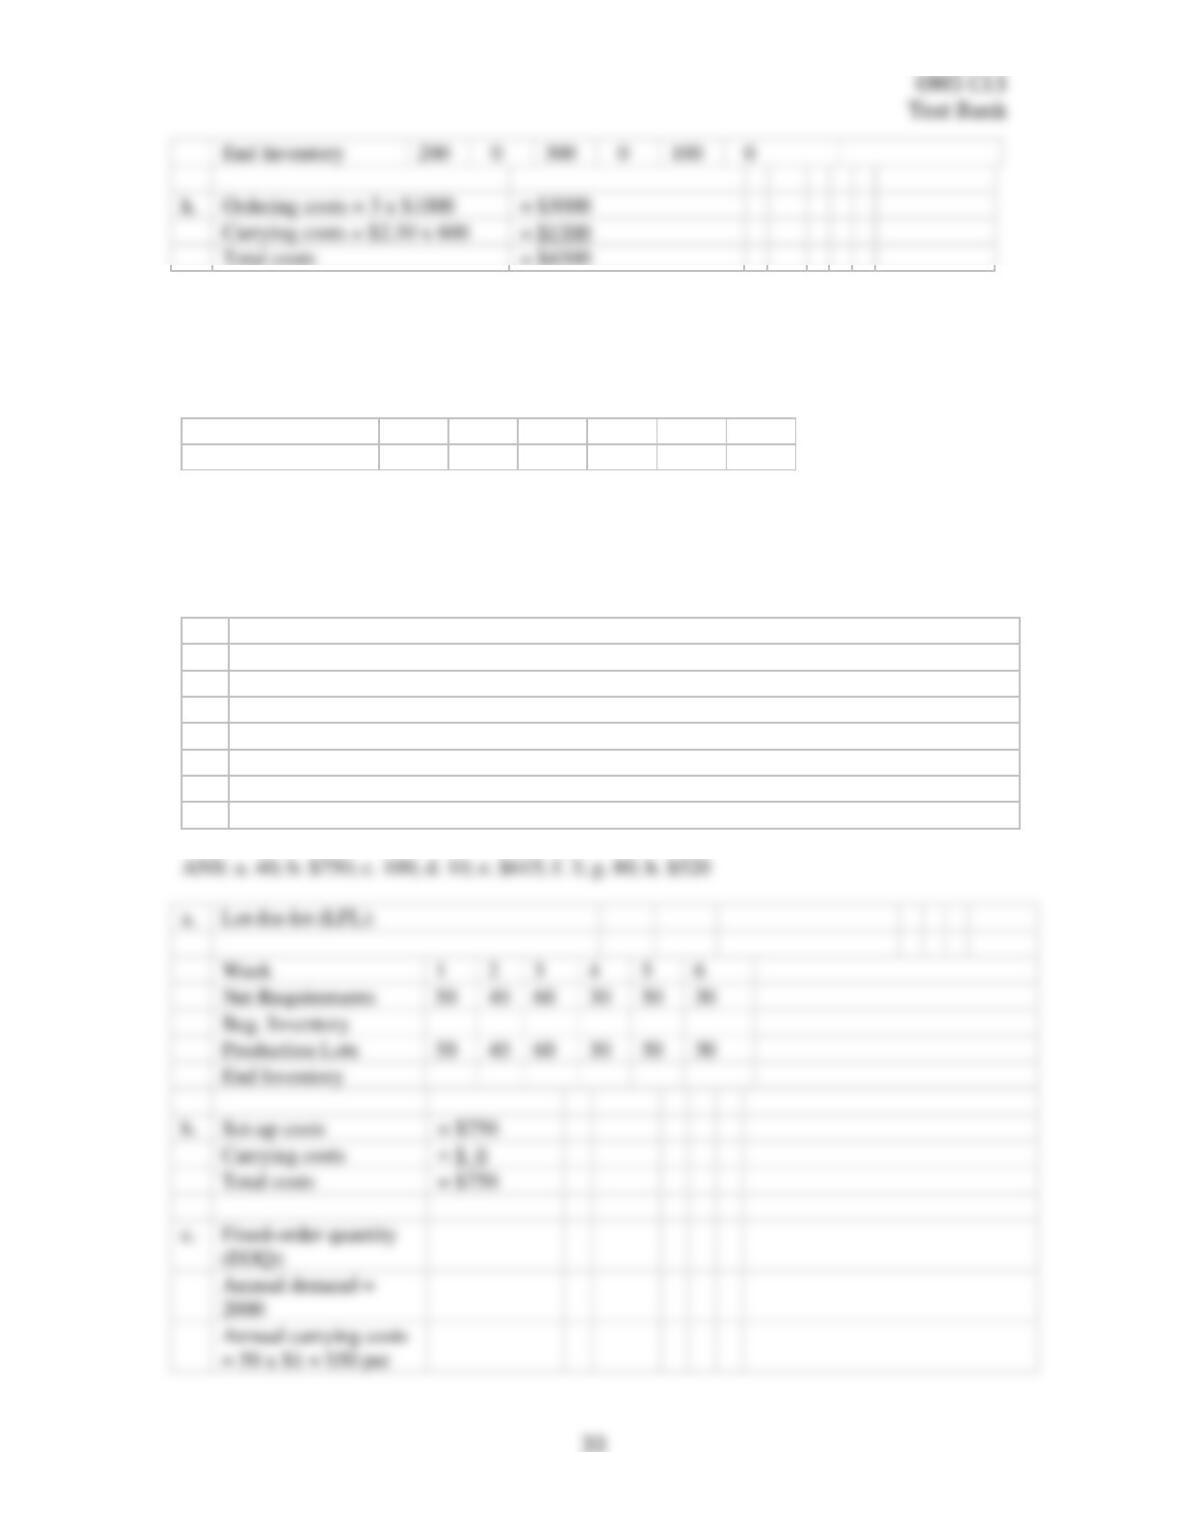
Lot-for-lot (LFL):
Week
1
2
3
4
5
6
Net Requirements
50
40
60
30
50
30
Beg. Inventory
Production Lots
50
40
60
30
50
30
End Inventory
b.
Set-up costs
= $750
Carrying costs
Total costs
= $750
= 50 x $1 = $50 per
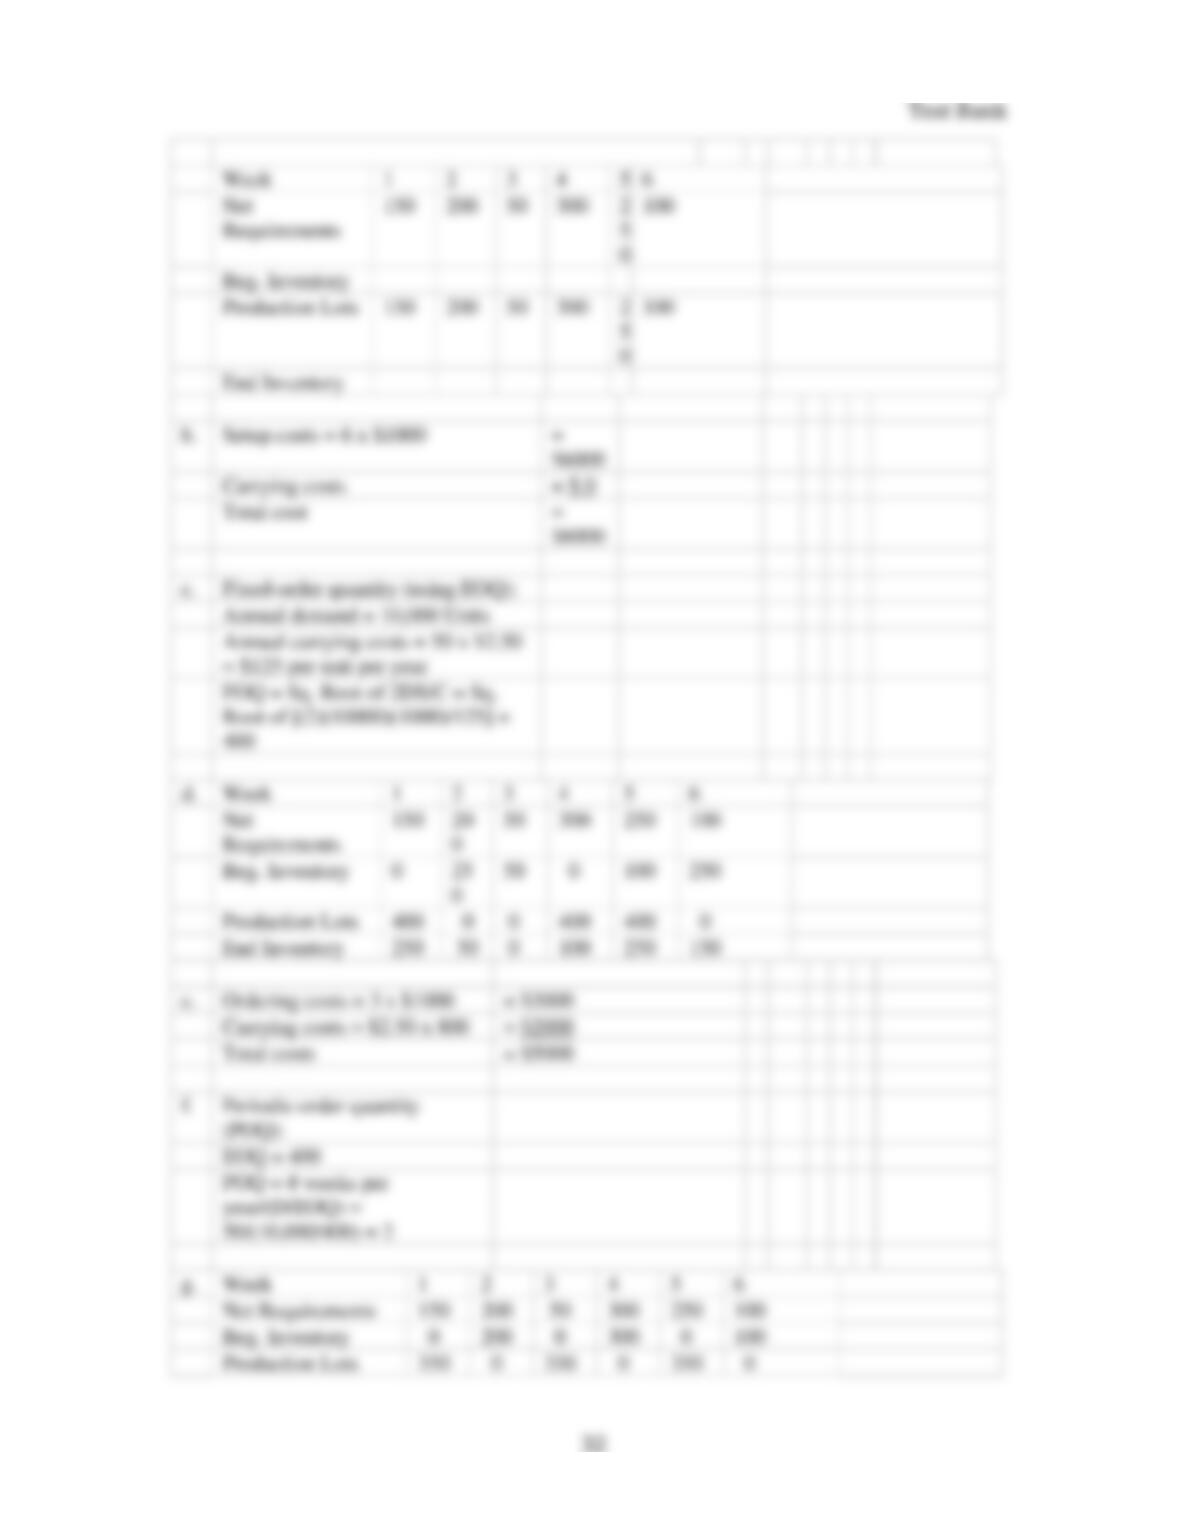
31. It is time for a company to do its MRP schedule, but they aren’t sure which lot sizing
approach to use: lot-for-lot (LFL), fixed-order quantity (FOQ) using the EOQ approach, or
periodic-order quantity (POQ). They have the following information regarding the product they
wish to produce:
Week
1
2
3
4
5
6
Net Requirements
50
40
60
30
50
30
Carrying costs = $1 per unit per week
Setup costs = $125
Annual demand = 2000 units
Work year = 50 weeks
a.
What is the production lot size for Week 2 using the LFL method?
b.
What is the total cost using the LFL approach?
c.
What is the FOQ using the EOQ approach?
d.
What is the beginning inventory in Week 3 using the FOQ approach?
e.
What is the total cost using the FOQ method?
f.
What is the POQ?
g.
What is the ending inventory in Week 4 using the POQ approach?
h.
What is the total cost using the POQ method?
h.
Ordering costs = 3 x $1000
= $3000
Carrying costs = $2.50 x 600
Total costs
= $4500
34
32. A sheet metal company has developed the following six-month production schedule (in
thousands of square yards):
Week
1
2
3
4
5
6
Metal
150
100
175
200
160
160
In addition, their monthly labor and machine capacities (in hours) available, and the production
standards (in hours per square yard) are:
Labor
Machine
Capacity Available
16,000
20,000
Production Standard
.10
.18
d.
Week
1
2
3
4
5
6
Requirements
Beg. Inventory
0
50
10
50
20
70
End Inventory
50
10
50
20
70
40
e.
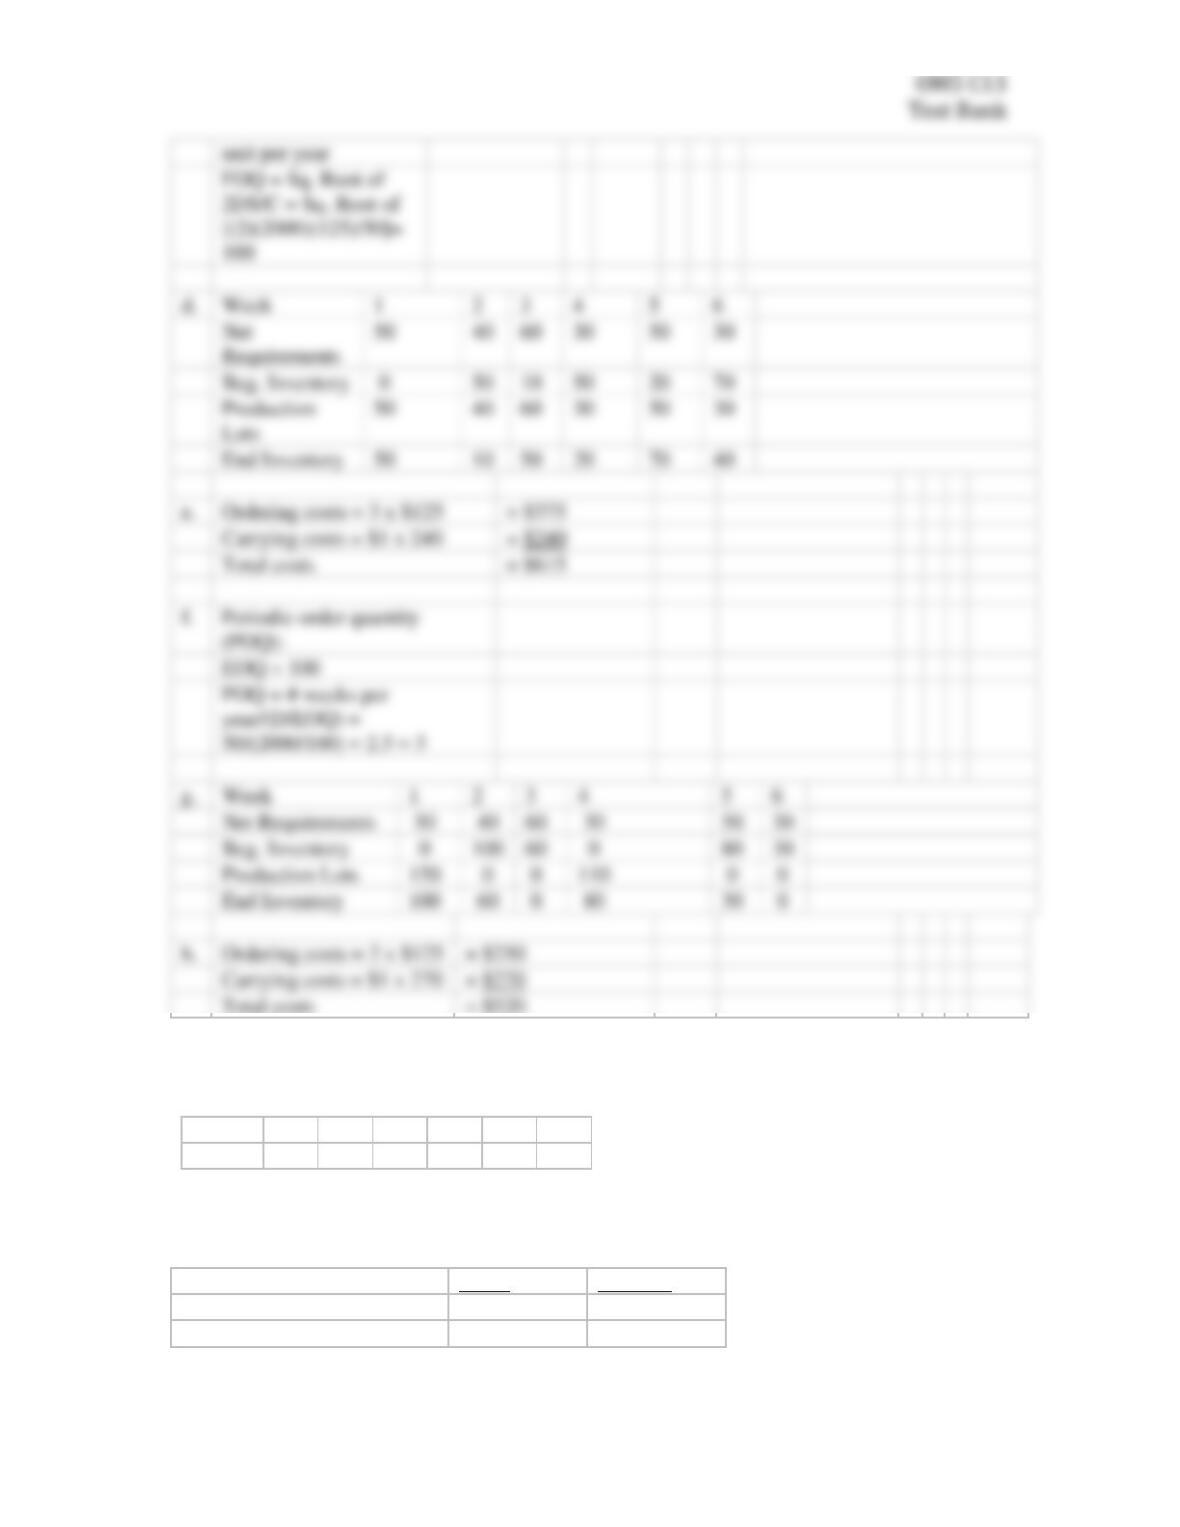
Ordering costs = 3 x $125
= $375
Carrying costs = $1 x 240
Total costs
= $615
(POQ):
EOQ = 100
Net Requirements
50
40
60
30
50
30
Beg. Inventory
0
100
60
0
80
30
Production Lots
150
0
0
110
0
0
End Inventory
100
60
0
80
30
0
h.
Ordering costs = 2 x $125
= $250
Carrying costs = $1 x 270
Total costs
= $520
OM5 C13
Test Bank
35
a.
What is the percentage utilization of the labor capacity in month 4?
b.
What is the percentage utilization of the machine capacity in month 3?
c.
In which weeks are the labor requirements over capacity?
33. A special project in a manufacturing company has the following master production
schedule (MPS) for the next eight weeks:
Week
1
2
3
4
5
6
7
8
Units
750
625
800
925
1000
900
675
675
The weekly fabrication and welding capacity (in hours) available and production standards (in
hours per unit) are:
Fabrication
Welding
Required
Percent
1
16,000
15,000
93.8
2
16,000
10,000
62.5
3
16,000
17,500
109.4
5
16,000
16,000
100.0
6
16,000
16,000
100.0
Required
Percent
2
20,000
18,000
90.0
3
20,000
31,500
157.5
6
20,000
28,800
144.0
OM5 C13
Test Bank
36
Capacity Available
7,500
10,000
Production Standard
8
11
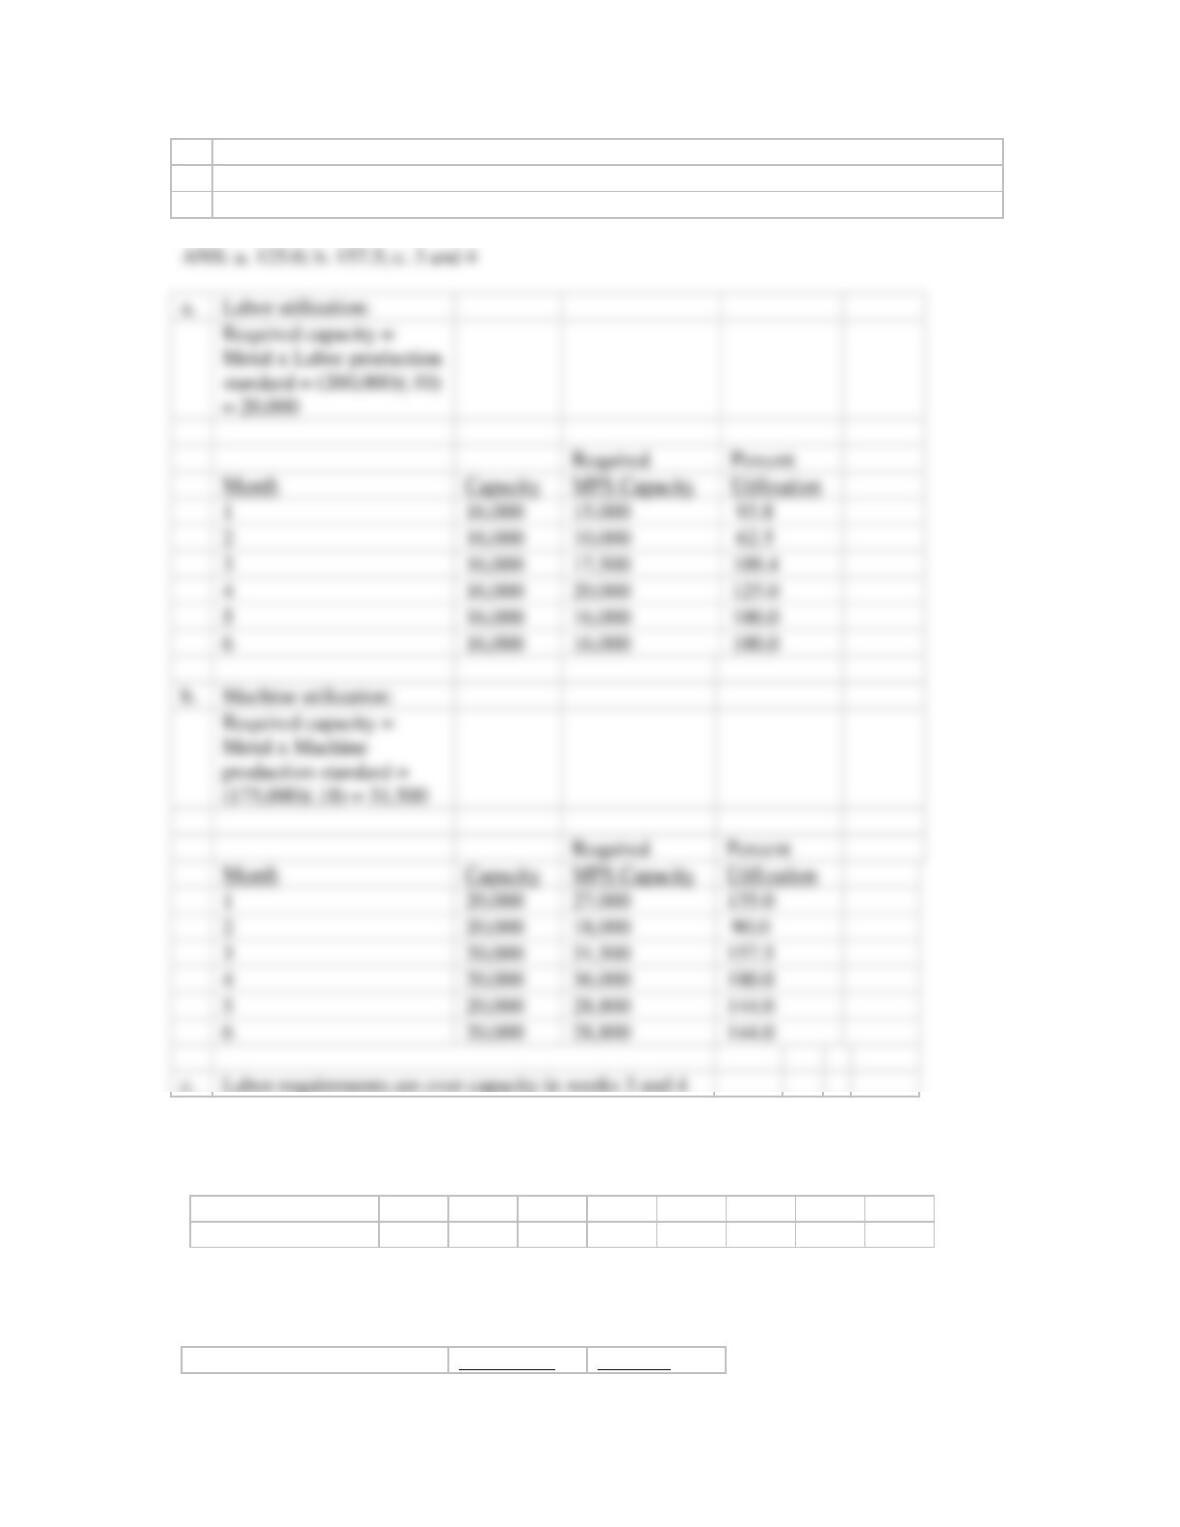
a.
What is the percentage utilization of the fabrication capacity in Week 5?
b.
What is the percentage utilization of the welding capacity in Week 2?
c.
In which weeks are the welding area requirements over capacity?
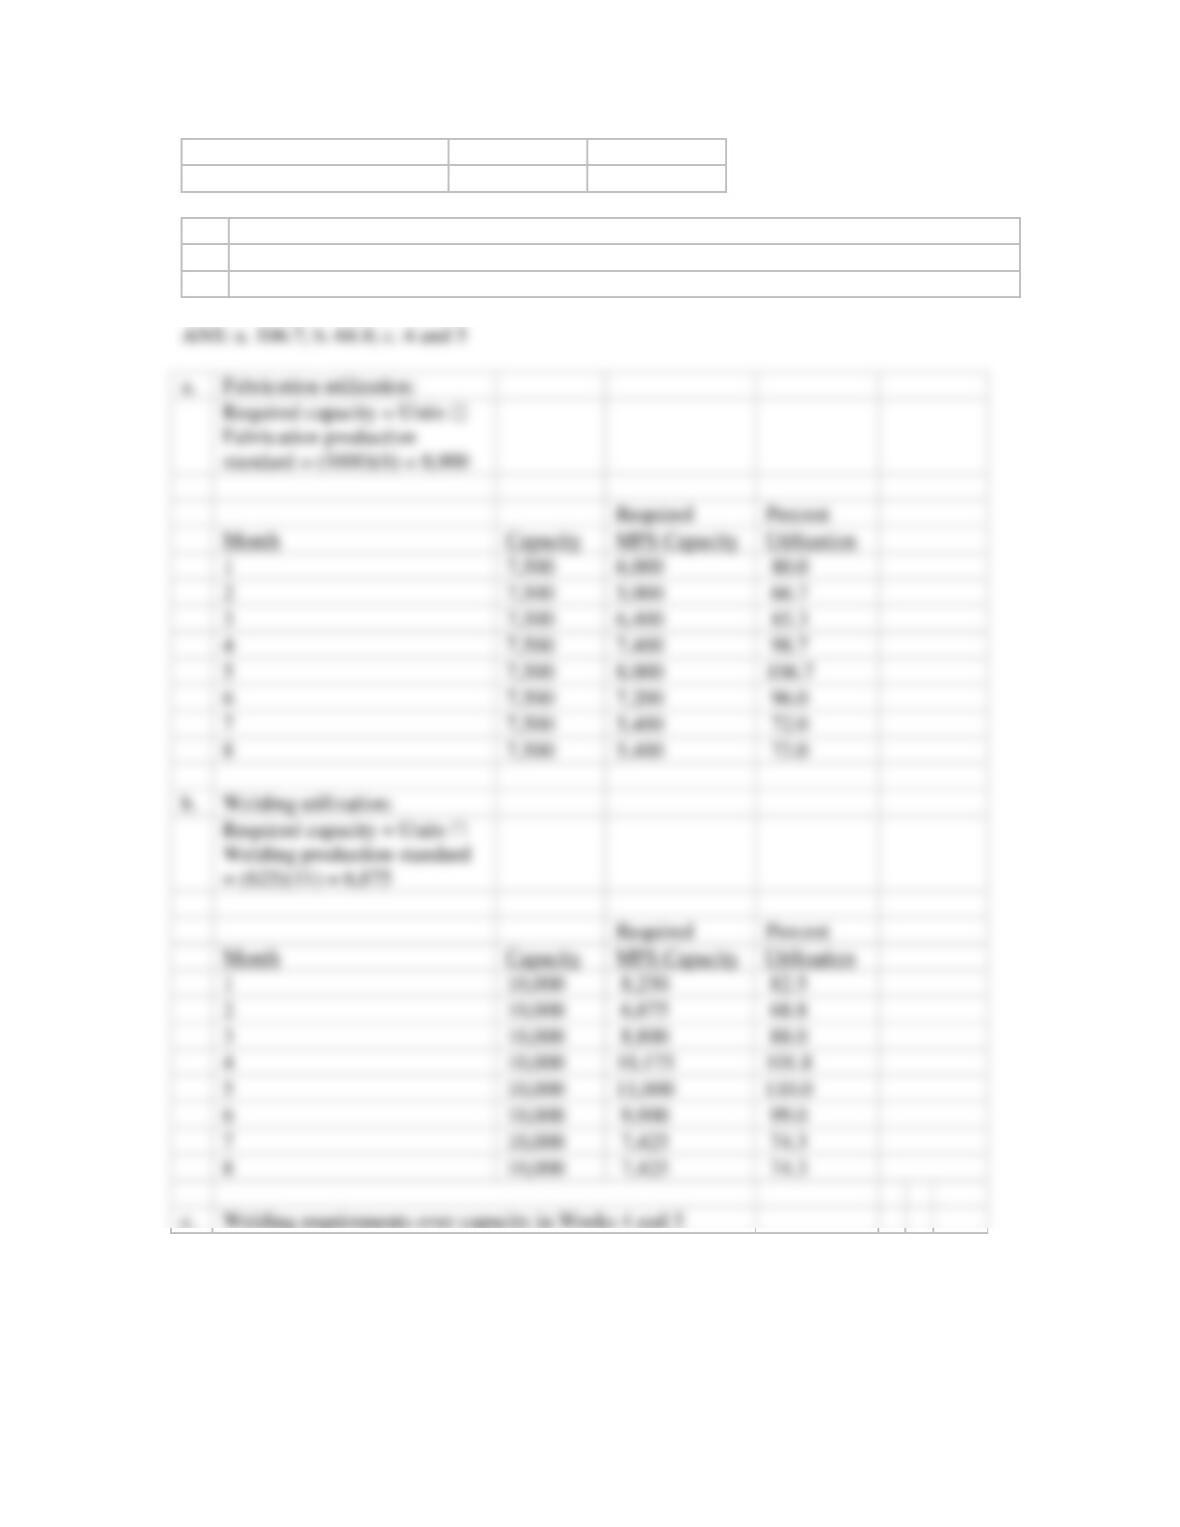
34. The Pacific Chemical Company produces high quality paint in Oregon for sale throughout
the western U.S. The company ships paint in gallon containers. The production manager has
developed the following master production schedule (MPS) for the next six months (data is in
thousands of gallons):
Fabrication utilization:
Required
Percent
Month
Capacity
MPS Capacity
Utilization
1
7,500
6,000
80.0
2
7,500
5,000
66.7
3
7,500
6,400
85.3
4
7,500
7,400
98.7
5
7,500
8,000
106.7
6
7,500
7,200
96.0
7
7,500
5,400
72.0
8
7,500
5,400
72.0
b.
Welding utilization:
Required
Percent
Month
Capacity
MPS Capacity
Utilization
1
10,000
8,250
82.5
2
10,000
6,875
68.8
3
10,000
8,800
88.0
4
10,000
10,175
101.8
5
10,000
11,000
110.0
6
10,000
9,900
99.0
7
10,000
7,425
74.3
8
10,000
7,425
74.3
c.
Welding requirements over capacity in Weeks 4 and 5
OM5 C13
Test Bank
37
Month
1
2
3
4
5
6
Paint
130
150
170
160
160
120
The company’s monthly labor and machine capacity available (in hours) and its production
standards (in hours per gallon) are:
Labor
Machine
Capacity available
15,000
23,000
Production Standard
.09
.12
a.
What is the percentage utilization of the labor capacity in Week 4?
b.
What is the percentage utilization of the machine capacity in Week 2?
c.
In which weeks are the machine requirements over capacity?
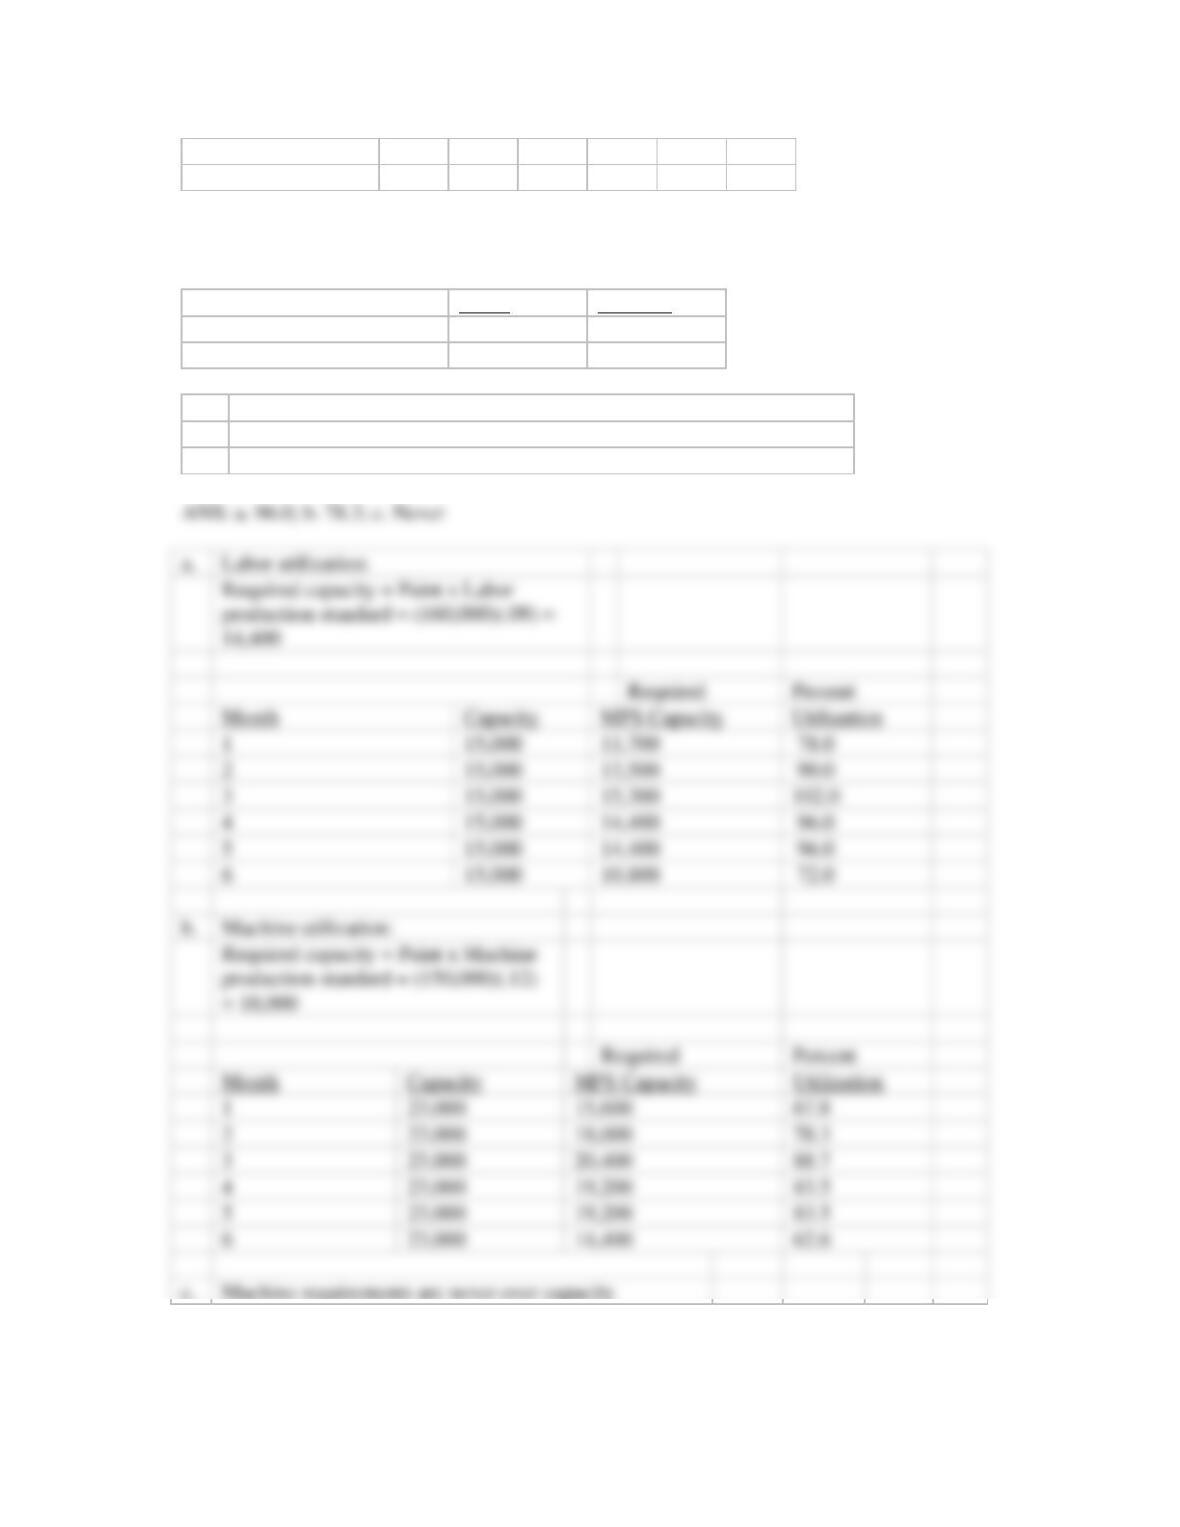
35. A company is seeking to develop a master production schedule for its product. Their
beginning inventory is 1000 units, and they want to maintain a safety stock level of 1000 units.
a.
Labor utilization:
Required
Percent
Month
Capacity
MPS Capacity
Utilization
1
15,000
11,700
78.0
2
15,000
13,500
90.0
3
15,000
15,300
102.0
4
15,000
14,400
96.0
5
15,000
14,400
96.0
6
15,000
10,800
72.0
b.
Machine utilization:
Required
Percent
Month
Capacity
MPS Capacity
Utilization
1
23,000
15,600
67.8
2
23,000
18,000
78.3
3
23,000
20,400
88.7
4
23,000
19,200
83.5
5
23,000
19,200
83.5
6
23,000
14,400
62.6
c.
Machine requirements are never over capacity
OM5 C13
Test Bank
They produce the product in a fixed lot size of 1200 units. Information regarding weekly demand
is shown below:
Week
1
2
3
4
5
6
Demand
1000
1100
1300
900
500
1000
a.
What is the ending inventory level for Week 2?
b.
What is the production quantity for Week 4?
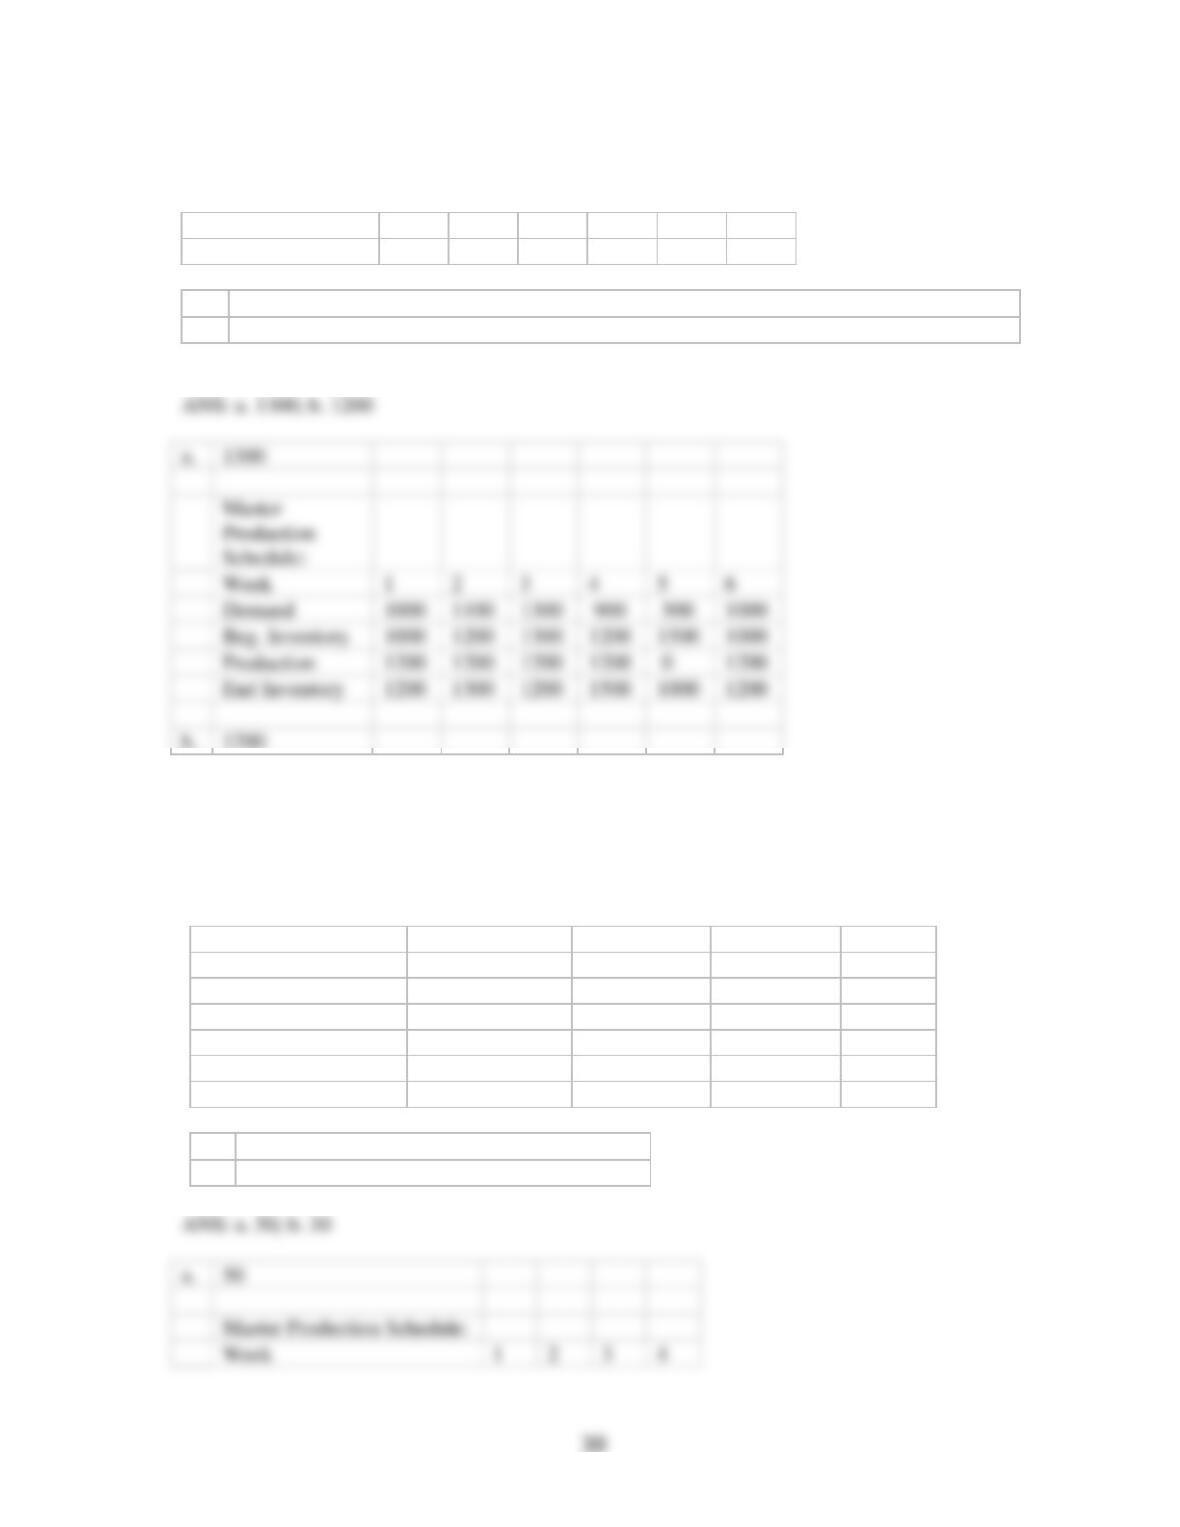
a.
1300
Week
1
2
3
4
5
6
Demand
1000
1100
1300
900
500
1000
Beg. Inventory
1000
1200
1300
1200
1500
1000
Production
1200
1200
1200
1200
0
1200
End Inventory
1200
1300
1200
1500
1000
1200
b.
1200
36. A firm produces one product on a produce-to-stock basis and is trying to develop a master
production schedule for production. The safety stock level for this product is 30 units, and the
fixed lot size is 50 units. The beginning inventory is given as 50 units. The demand for this
product comes from four different sources, and the demand estimates for the next four weeks are
given as:
Week
Source
1
2
3
4
Intra-company orders
10
0
0
20
Warehouse Orders
0
20
0
10
R & D Orders
10
0
10
0
Customer Orders
30
25
15
30
Total Weekly Demand
50
45
25
60
a.
What is the production quantity for Week 2?
b.
What is the beginning inventory for Week 4?
a.
50
Week
1
2
3
4
39
37. A firm produces two models of pagers, products A and B, on a produce-to-stock basis and is
trying to develop a master production schedule for its operation. Safety stock is 30 for product A
and 20 for product B. Fixed lot sizes are 70 for product A and 40 for product B. The beginning
inventories are 30 for A and 30 for B. The demand for these products comes from many different
sources, but the total weekly demand for each of the next six weeks is given as follows:
Week
Product
1
2
3
4
5
6
A
60
30
50
60
70
60
B
50
20
40
30
30
40
a.
What is the production quantity for Product A for Week 3?
b.
What is the ending inventory for Product A for Week 3?
c.
What is the production quantity for Product B for Week 5?
d.
What is the beginning inventory for Product B for Week 5?
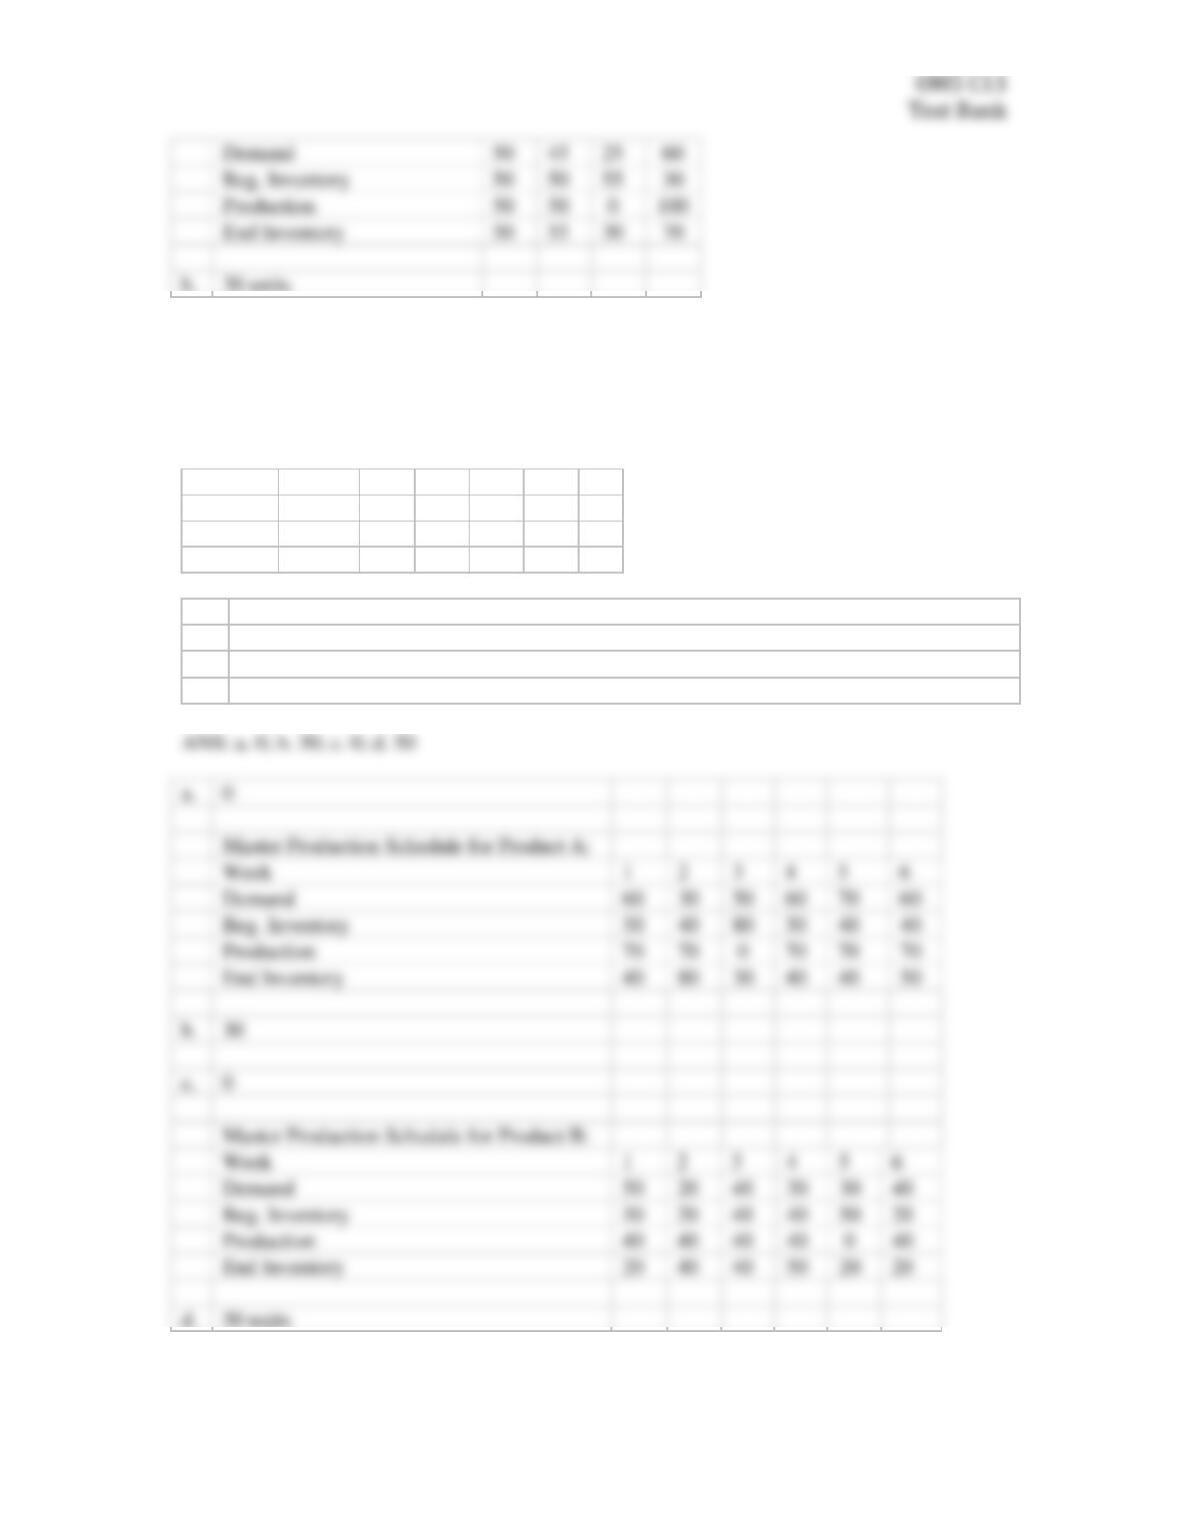
a.
0
Master Production Schedule for Product A:
Week
1
2
3
4
5
6
Demand
60
30
50
60
70
60
Beg. Inventory
30
40
80
30
40
40
Production
70
70
0
70
70
70
End Inventory
40
80
30
40
40
50
b.
30
c.
0
Master Production Schedule for Product B:
Week
1
2
3
4
5
6
Demand
50
20
40
30
30
40
Beg. Inventory
30
20
40
40
50
20
Production
40
40
40
40
0
40
End Inventory
20
40
40
50
20
20
d.
50 units
38. A company produces two end items: Products A and B. They are concerned about the
Beg. Inventory
50
50
55
30
Production
50
50
0
100
End Inventory
50
55
30
70
b.
30 units
OM5 C13
Test Bank
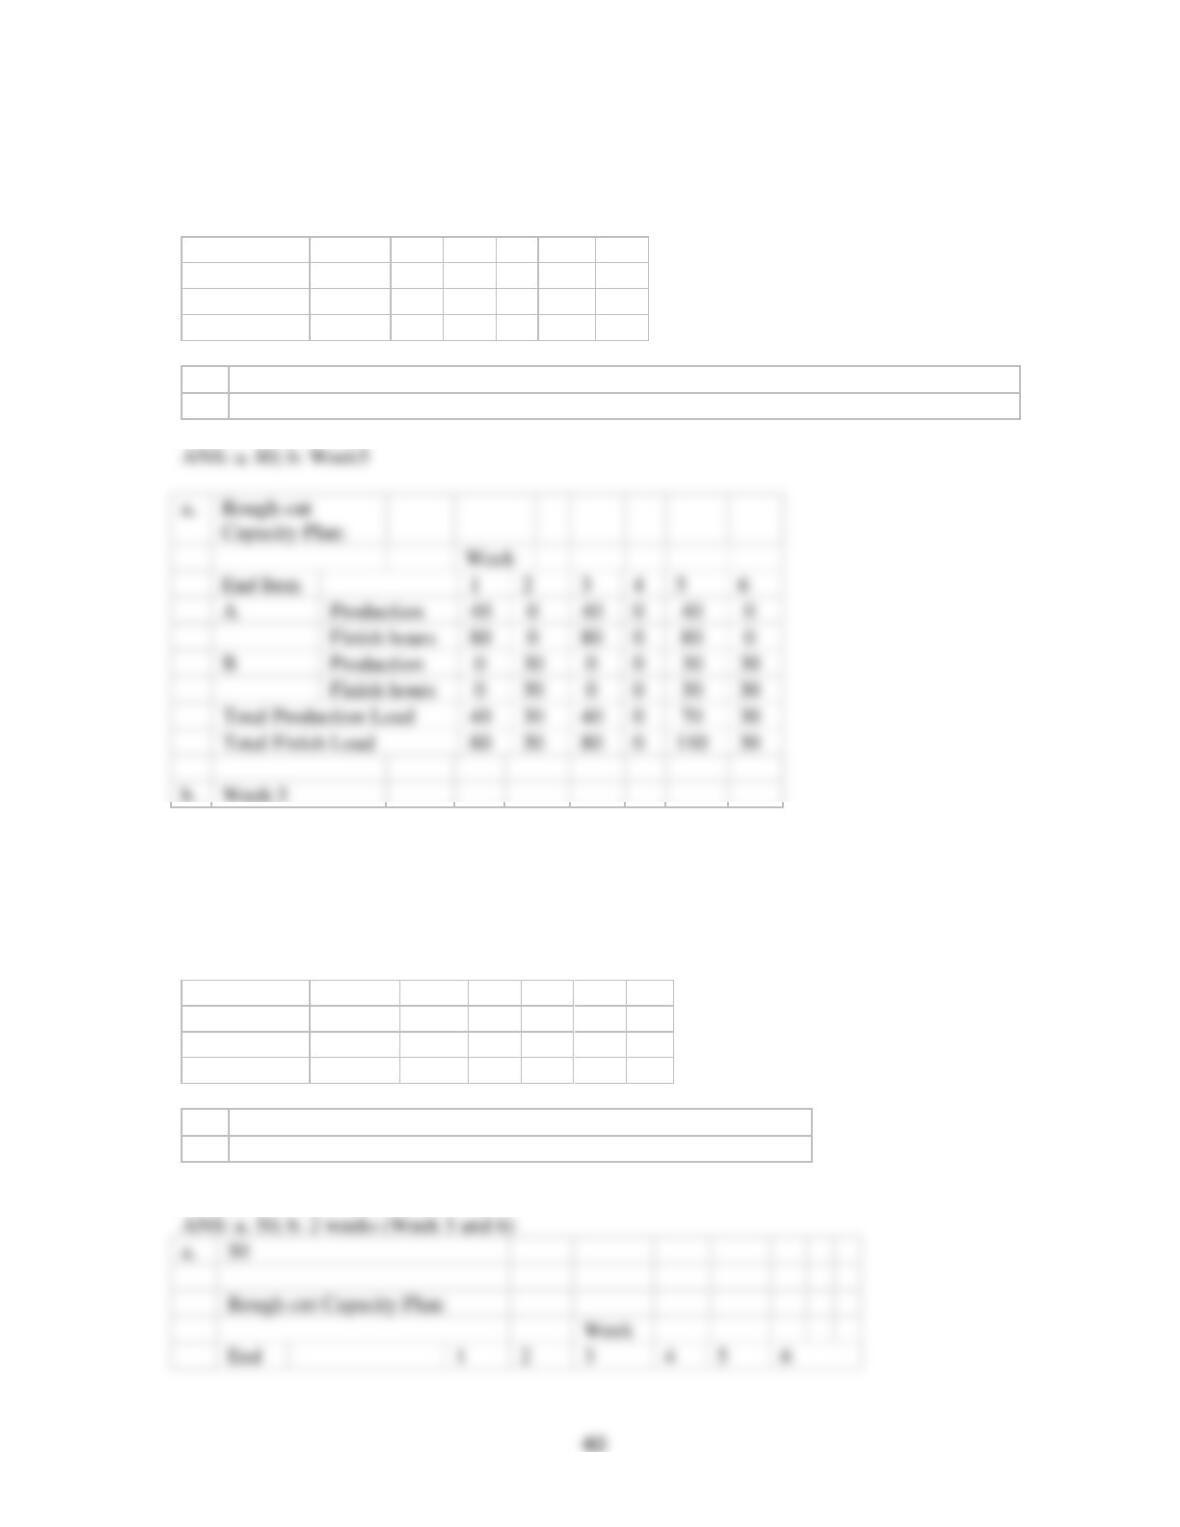
loading on their Finish Shop and are trying to develop a rough-cut capacity plan. To finish
Product A two hours are required and for Product B one hour. Total hours available in the Finish
Shop are 100. They have the following weekly production information:
Week
End Item
1
2
3
4
5
6
A
40
0
40
0
40
0
B
0
30
0
0
30
30
a.
What is the total hourly load on the Finish Shop in Week 3?
b.
In what week is the Finish Shop overloaded?
Week
End Item
1
2
3
4
5
6
A
Production
40
0
40
0
40
0
Finish hours
80
0
80
0
80
0
B
Production
0
30
0
0
30
30
Finish hours
0
30
0
0
30
30
Total Production Load
40
30
40
0
70
30
Total Finish Load
80
30
80
0
110
30
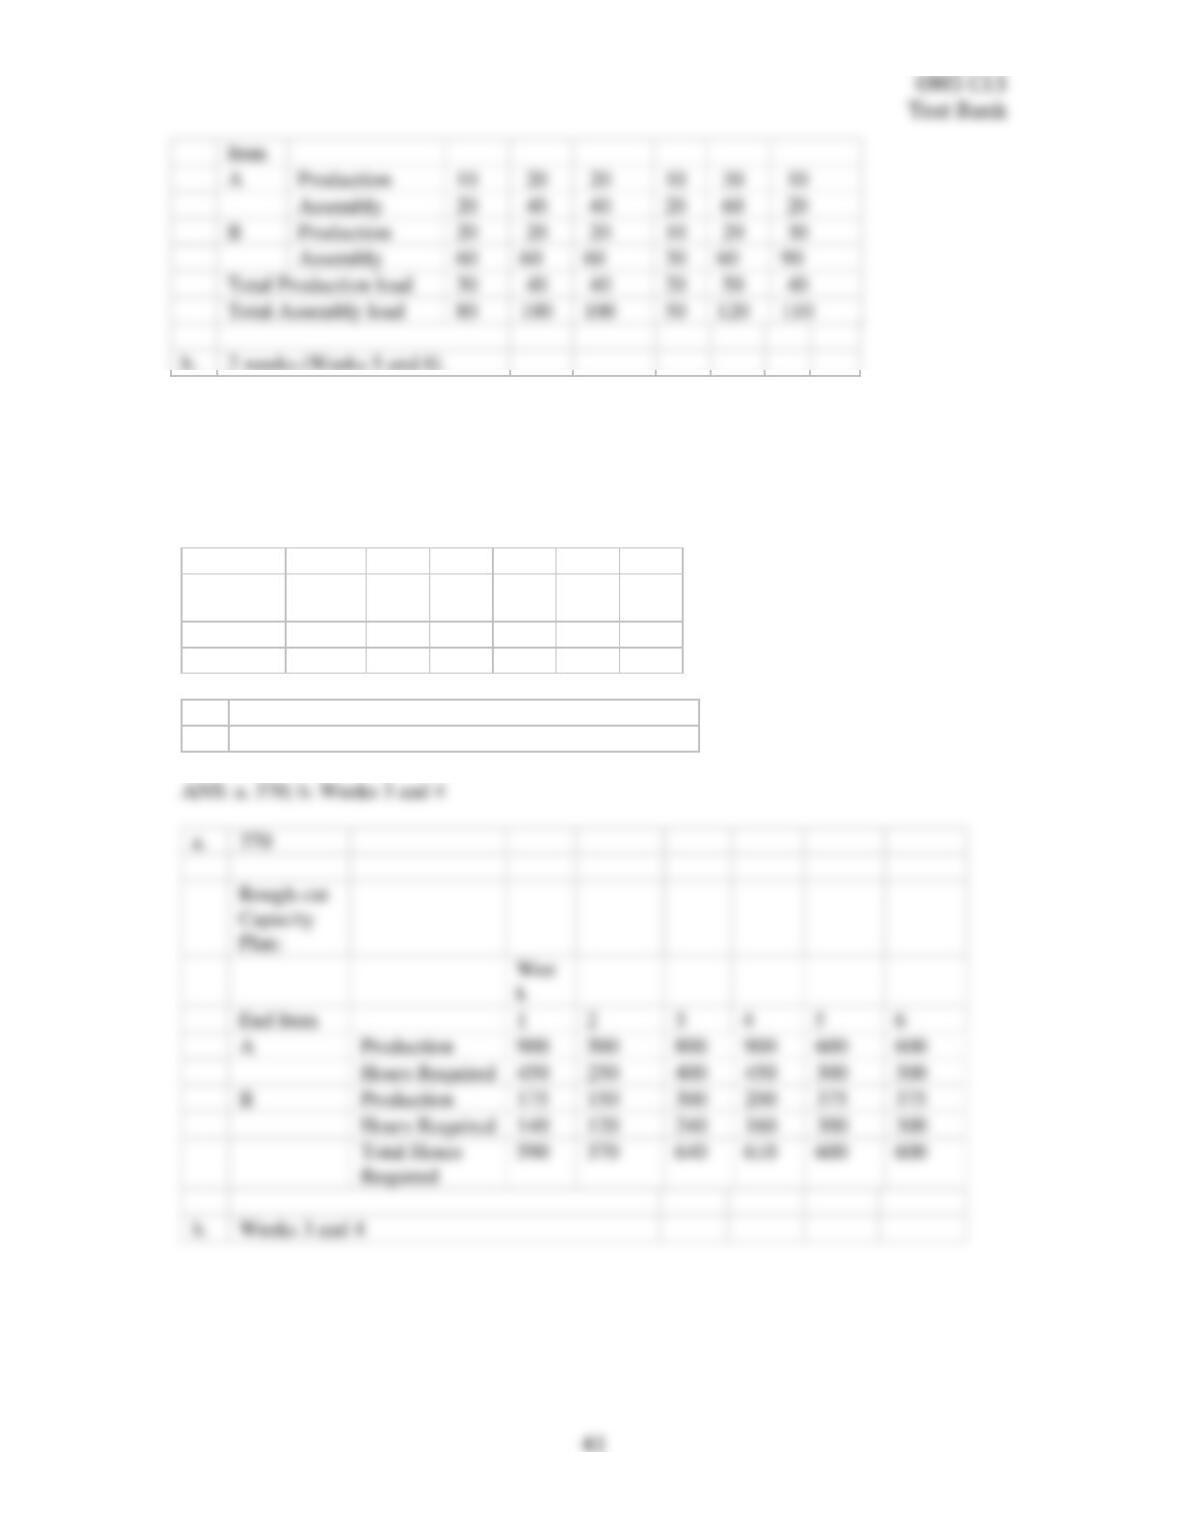
39. A furniture company produces two types of wooden chairs: Products A and B. They are
interested in developing a rough-cut capacity plan to prevent overloading their assembly facility.
Assembly time required for Product A is 2 hours and for product B, it is 3 hours. Total assembly
time available is 100 hours/week. They have the following weekly production information
available:
Week
End Item
1
2
3
4
5
6
A
10
20
20
10
30
10
B
20
20
20
10
20
30
a.
What is the total hourly load on the assembly facility in Week 4?
b.
In how many weeks is the assembly facility overloaded?
a.
50
Rough-cut Capacity Plan:
Week
a.
370
k
End Item
1
2
3
4
5
6
A
Production
900
500
800
900
600
600
Hours Required
450
250
400
450
300
300
B
Production
175
150
300
200
375
375
Hours Required
140
120
240
160
300
300
Required
40. A local manufacturer produces two different products on the same production line. Product
A requires 0.5 hours of labor while Product B requires .8 hours of labor. The total labor available
in any one week is 600 hours. The production manager has just developed the following weekly
production schedule. Identify the weeks in this schedule where the production system will be
overloaded or underloaded.
Week
End Item
1
2
3
4
5
6
A
900
500
800
900
600
600
B
175
150
300
200
375
375
a.
What is the total hourly load on the line in Week 2?
b.
In what Week(s) is the line overloaded?
A
Production
10
20
20
10
30
10
Assembly
20
40
40
20
60
20
B
Production
20
20
20
10
20
30
Assembly
60
60
60
30
60
90
Total Production load
30
40
40
20
50
40
Total Assembly load
80
100
100
50
120
110
b.
2 weeks (Weeks 5 and 6)