The Costs of Production 3263
39. Refer to Table 13-2. What is the marginal product of the fourth worker?
a. 300 units
b. 200 units
c. 100 units
d. 50 units
40. Refer to Table 13–2. At which number of workers does diminishing marginal product begin?
a. 1
b. 2
c. 3
d. 4
3264 The Costs of Production
Table 13-3
Number of
Workers
Output
Fixed
Cost
Variable
Cost
Total
Cost
0
0
$50
$0
$50
1
90
$50
$20
$70
2
170
$50
$40
$90
3
230
$50
$60
$110
4
240
$50
$80
$130
41. Refer to Table 13-3. The marginal product of the second worker is
a. 90 units.
b. 85 units.
c. 80 units.
d. 20 units.
42. Refer to Table 13-3. The marginal product of the third worker is
a. 230 units.
b. 100 units.
c. 77 units.
d. 60 units.
The Costs of Production 3265
43. Refer to Table 13-3. The marginal product of the fourth worker is
a. 10 units.
b. 60 units.
c. 230 units.
d. 240 units.
44. Refer to Table 13–3. At which number of workers does diminishing marginal product begin?
a. 1
b. 2
c. 3
d. 4
45. Refer to Table 13–3. If the firm can sell its output for $1 per unit, what is the profit-maximizing
level of output?
a. 240 units
b. 230 units
c. 190 units
d. 170 units
3266 The Costs of Production
46. When adding another unit of labor leads to an increase in output that is smaller than the increases
in output that resulted from adding previous units of labor, the firm is experiencing
a. diminishing labor.
b. diminishing output.
c. diminishing marginal product.
d. negative marginal product.
47. On a 100–acre farm, a farmer is able to produce 3,000 bushels of wheat when he hires 2 workers.
He is able to produce 4,400 bushels of wheat when he hires 3 workers. Which of the following
possibilities is consistent with the property of diminishing marginal product?
a. The farmer is able to produce 5,600 bushels of wheat when he hires 4 workers.
b. The farmer is able to produce 5,800 bushels of wheat when he hires 4 workers.
c. The farmer is able to produce 6,000 bushels of wheat when he hires 4 workers.
d. Any of the above could be correct.

The Costs of Production 3267
48. On a 100–acre farm, a farmer is able to produce 3,000 bushels of wheat when he hires 2 workers.
He is able to produce 4,400 bushels of wheat when he hires 3 workers. Which of the following
possibilities is consistent with the property of diminishing marginal product?
a. The farmer is able to produce 5,600 bushels of wheat when he hires 4 workers.
b. The farmer is able to produce 5,400 bushels of wheat when he hires 4 workers.
c. The farmer is able to produce 5,200 bushels of wheat when he hires 4 workers.
d. Any of the above could be correct.
49. When the marginal product of an input declines as the quantity of that input increases, the
production function exhibits
a. increasing marginal product.
b. diminishing marginal product.
c. diminishing total product.
d. Both b and c are correct.

3268 The Costs of Production
50. As Bubba’s Bubble Gum Company adds workers while using the same amount of machinery,
some workers may be underutilized because they have little work to do while waiting in line to use
the machinery. When this occurs, Bubba’s Bubble Gum Company encounters
a. economies of scale.
b. diseconomies of scale.
c. increasing marginal product.
d. diminishing marginal product.
51. If a production function shows declining marginal product of an input as the quantity of the input
increases, then the production function exhibits
a. diminishing profitability.
b. increasing returns to scale.
c. increasing marginal product.
d. decreasing marginal product.
The Costs of Production 3269
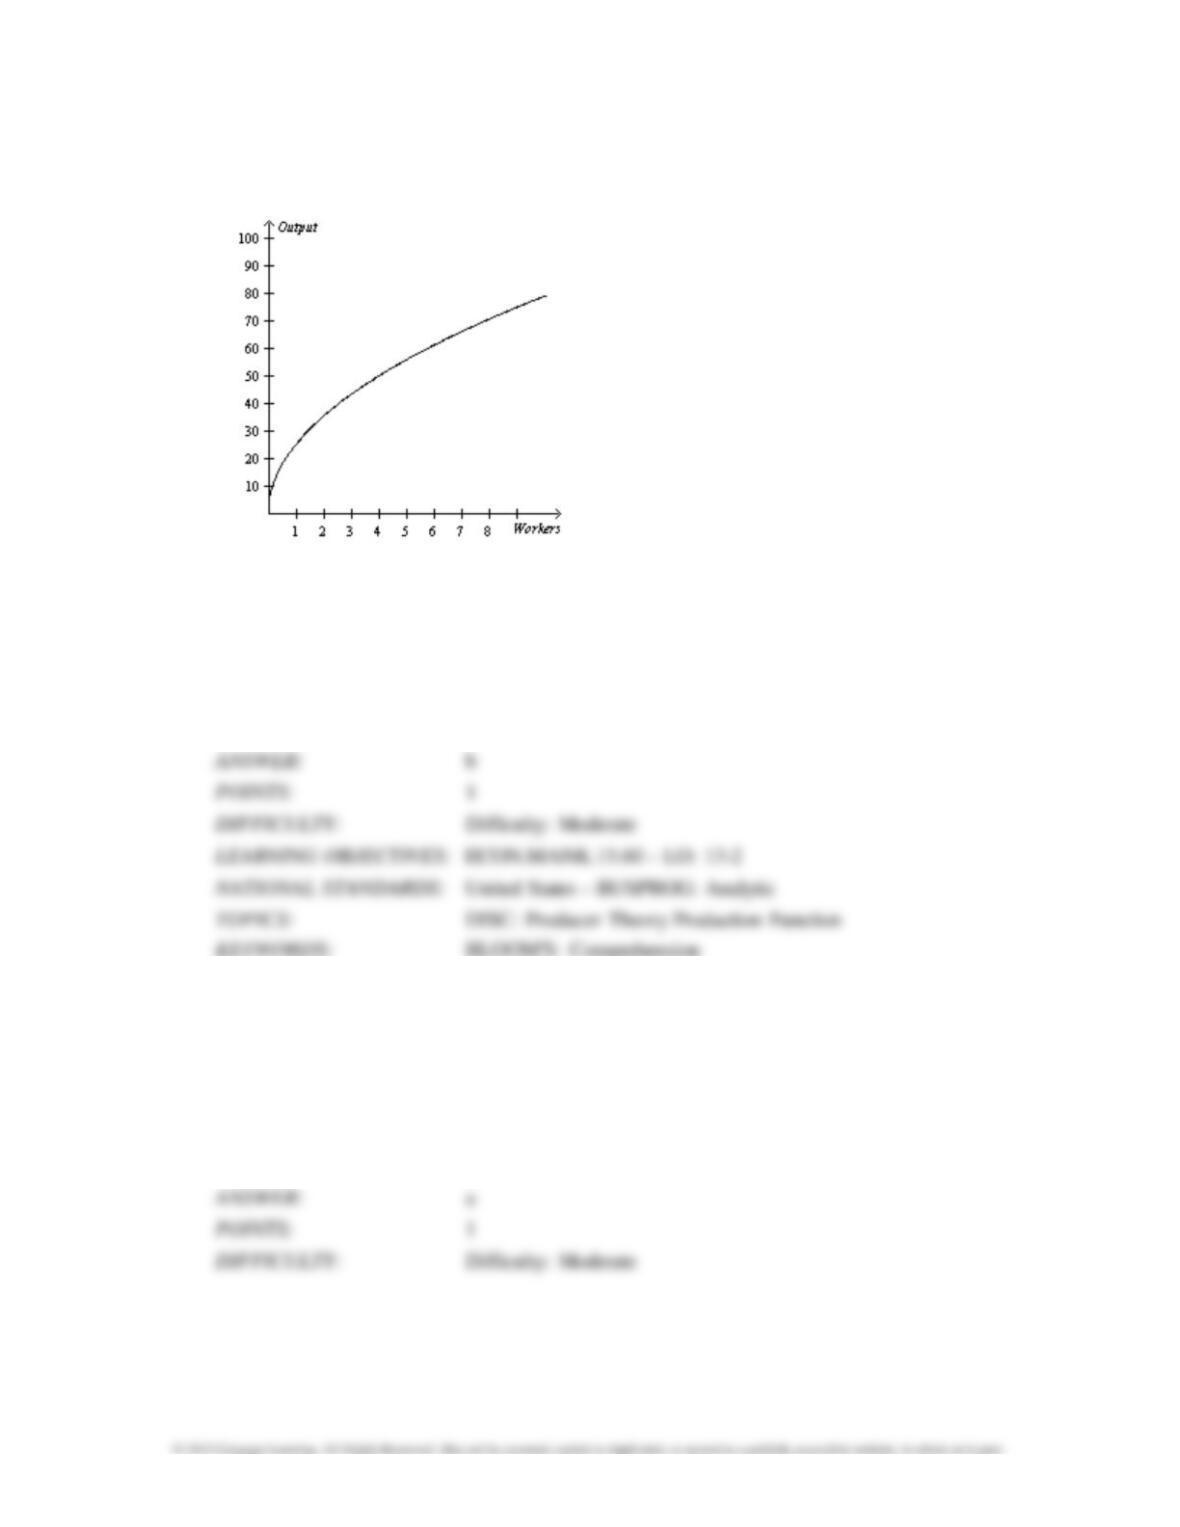
Figure 13-2
52. Refer to Figure 13-2. The graph illustrates a typical
a. total-cost curve.
b. production function.
c. production possibilities frontier.
d. marginal product of labor curve.
53. Refer to Figure 13-2. As the number of workers increases,
a. total output increases but at a decreasing rate.
b. marginal product increases but at a decreasing rate.
c. marginal product increases at an increasing rate.
d. total output decreases.
3270 The Costs of Production
54. Refer to Figure 13-2. As the number of workers increases,
a. marginal product decreases.
b. total output decreases.
c. marginal product increases but at a decreasing rate.
d. Both a and b are correct.
55. Refer to Figure 13-2. If the figure represented production at a cookie factory, the factory
would be experiencing
a. diminishing marginal product of workers.
b. diminishing marginal cost of cookie production.
c. decreasing cost of cookie production.
d. decreasing output of cookies.
The Costs of Production 3271
56. Refer to Figure 13–2. The graph illustrates a typical production function. Based on its shape,
what does the corresponding total cost curve look like?
a. an upward-sloping curve that increases at an increasing rate
b. an upward-sloping curve that increases at a decreasing rate
c. a downward-sloping curve
d. a horizontal straight line
Table 13-4
Charles’s Math Tutoring
Number of
Workers
Output (number
of students tutored
per week)
0
0
1
20
2
45
3
60
4
70
57. Refer to Table 13-4. What is the marginal product of the second worker?
a. 15 students
b. 20 students
c. 22.5 students
d. 25 students

3272 The Costs of Production
58. Refer to Table 13-4. What is the marginal product of the third worker?
a. 15 students
b. 20 students
c. 35 students
d. 60 students
59. Refer to Table 13-4. Charles’s math tutoring company experiences diminishing marginal
productivity with the addition of the
a. first worker.
b. second worker.
c. third worker.
d. fourth worker.
The Costs of Production 3273
60. Refer to Table 13–4. Suppose that Charles’s math tutoring company has a fixed cost of $50 per
month for his cell phone. Each worker costs Charles $60 per day. As output increases from 0 to
45 students, Charles’s total cost curve
a. increases but gets flatter.
b. increases and gets steeper.
c. decreases and gets flatter.
d. decreases but gets steeper.
61. Refer to Table 13–4. Suppose that Charles’s math tutoring company has a fixed cost of $50 per
month for his cell phone. Each worker costs Charles $60 per day. As output increases from 45 to
70 students, Charles’s total cost curve
a. increases but gets flatter.
b. increases and gets steeper.
c. decreases and gets flatter.
d. decreases but gets steeper.
3274 The Costs of Production
Table 13-5
Number of Workers
Output
0
0
1
10,000
2
19,000
3
27,000
4
32,000
5
35,000
6
36,000
62. Refer to Table 13-5. The marginal product of the third worker is
a. 9,000 units.
b. 8,000 units.
c. 7,000 units.
d. 5,000 units.
63. Refer to Table 13-5. The marginal product of the fourth worker is
a. 9,000 units.
b. 8,000 units.
c. 7,000 units.
d. 5,000 units.
The Costs of Production 3275
64. Refer to Table 13-5. Diminishing marginal product begins with the addition of the
a. second worker.
b. third worker.
c. fourth worker.
d. fifth worker.
65. Refer to Table 13–5. Assume that fixed costs are $500, and variable costs are $100 per worker.
For this firm, what are the shapes of the production function and the total-cost curve?
a. Both the production function and total-cost curve are increasing at an increasing rate.
b. Both the production function and total-cost curve are increasing at a decreasing rate.
c. The production function is increasing at an increasing rate, whereas the total-cost function is
increasing at a decreasing rate.
d. The production function is increasing at a decreasing rate, whereas the total-cost function is
increasing at an increasing rate.
3276 The Costs of Production
Table 13-6
Wooden Chair Factory
Number of
Workers
Number of
Machines
Output
(chairs
produced
per hour)
Marginal
Product of
Labor
Cost of
Workers
Cost of
Machines
Total Cost
1
2
5
2
2
10
3
2
20
4
2
35
5
2
55
6
2
70
7
2
80
66. Refer to Table 13-6. Each worker at the Wooden Chair Factory costs $12 per hour. The cost of
each machine is
$20 per day regardless of the number of chairs produced. If the factory produces at a rate of 70
chairs per hour and operates 8 hours per day, what is the factory’s total labor cost per day?
a. $72
b. $112
c. $576
d. $616
The Costs of Production 3277
67. Refer to Table 13-6. Each worker at the Wooden Chair Factory costs $12 per hour. The cost of
each machine is$20 per day regardless of the number of chairs produced. What is the total daily
cost of producing at a rate of 55 chairs per hour if the factory operates 8 hours per day?
a. $480
b. $576
c. $520
d. $616
68. Refer to Table 13-6. Each worker at the Wooden Chair Factory costs $12 per hour. The cost of
each machine is$20 per day regardless of the number of chairs produced. Assume the number of
machines does not change. If the factory produces at a rate of 78 chairs per hour, what is the total
machine cost per day?
a. $20
b. $40
c. $240
d. We are unable to determine total machine costs from the information given.
3278 The Costs of Production
69. Refer to Table 13-6. Each worker at the Wooden Chair Factory costs $12 per hour. The cost of
each machine is $20 per day regardless of the number of chairs produced. If the factory produces
at a rate of 35 chairs per hour, what is the total labor cost per hour?
a. $40
b. $48
c. $384
d. $424
70. Refer to Table 13-6. Assume the Wooden Chair Factory currently employs 5 workers. What is
the marginal product of labor when the factory adds a 6th worker?
a. 5 chairs per hour
b. 15 chairs per hour
c. 25 chairs per hour
d. 70 chairs per hour

The Costs of Production 3279
71. Refer to Table 13-6. Assume the Wooden Chair Factory currently employs 2 workers. What is
the marginal product of labor when the factory adds a 3rd worker?
a. 5 chairs per hour
b. 10 chairs per hour
c. 20 chairs per hour
d. 25 chairs per hour
72. Refer to Table 13–6. The Wooden Chair Factory experiences diminishing marginal product of
labor with the addition of which worker?
a. the third worker
b. the fourth worker
c. the fifth worker
d. the sixth worker
3280 The Costs of Production
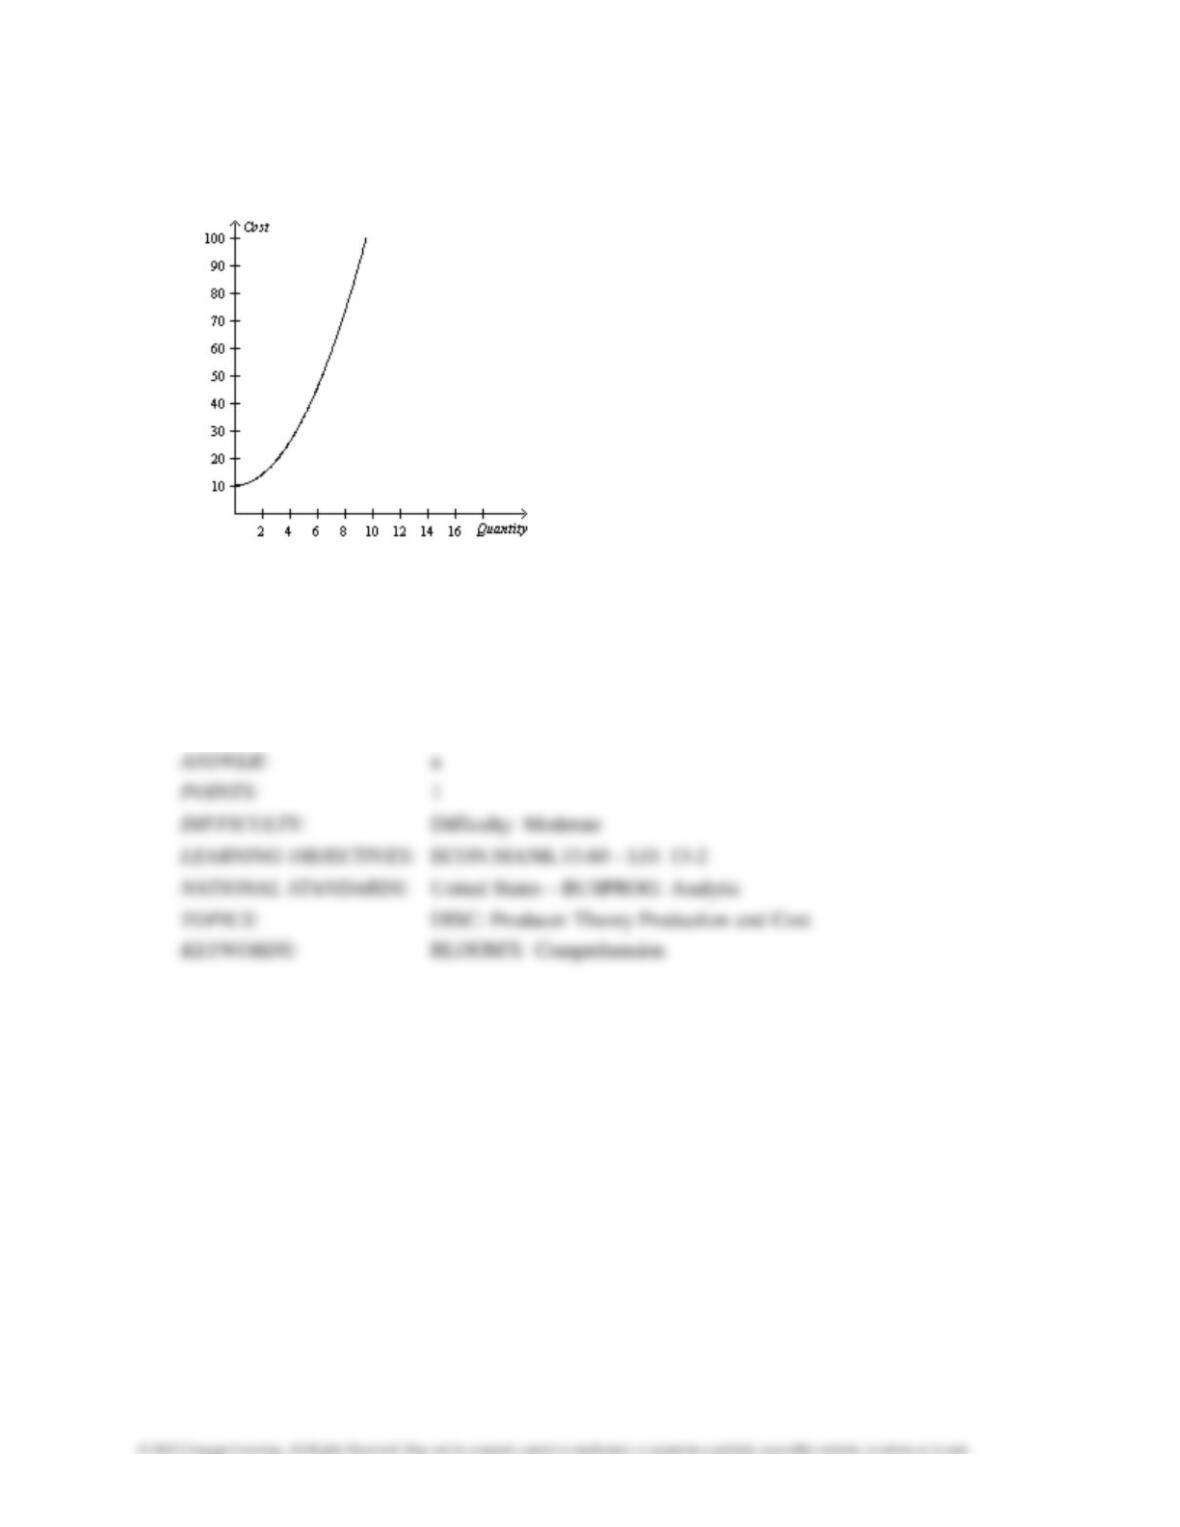
Figure 13-3
73. Refer to Figure 13-3. The graph illustrates a typical
a. total-cost curve.
b. production function.
c. production possibilities frontier.
d. fixed-cost curve.
The Costs of Production 3281
74. Refer to Figure 13-3. The graph illustrates a typical total cost curve. Based on its shape, what
does the corresponding production function look like?
a. an upward-sloping curve that increases at an increasing rate
b. an upward-sloping curve that increases at a decreasing rate
c. a downward-sloping curve
d. a horizontal straight line
75. Refer to Figure 13-3. Which of the following is true of the production function (not pictured)
that underlies this total cost function?
(i) Total output increases as the quantity of inputs increases but at a decreasing rate.
(ii) Marginal product is diminishing for all levels of input usage.
(iii) The slope of the production function decreases as the quantity of inputs increases.
a. (i) only
b. (ii) and (iii) only
c. (i) and (iii) only
d. (i), (ii), and (iii)
3282 The Costs of Production
76. Refer to Figure 13-3. The changing slope of the total cost curve reflects
a. decreasing average variable cost.
b. decreasing average total cost.
c. decreasing marginal product.
d. increasing fixed cost.
77. Refer to Figure 13-3. Which of the following statements best captures the nature of the
underlying production function (not pictured)?
a. Output increases at a decreasing rate with additional units of input.
b. Output increases at an increasing rate with additional units of input.
c. Output decreases at a decreasing rate with additional units of input.
d. Output decreases at an increasing rate with additional units of input.