
FOR INSTRUCTOR USE ONLY
CHAPTER 13
FINANCIAL ANALYSIS: THE BIG PICTURE
SUMMARY OF QUESTIONS BY LEARNING OBJECTIVE AND BLOOM’S TAXONOMY
Item
LO
BT
Item
LO
BT
Item
LO
BT
Item
LO
BT
Item
LO
BT
True-False Statements
1.
1
K
10.
3
K
19.
5
K
28.
6,8
K
37.
6,8
C
2.
2
K
11.
3
K
20.
5
K
29.
6,8
K
38.
6,8
K
3.
2
K
12.
4, 5
K
21.
5
K
30.
6,8
K
39.
6,8
C
4.
2
K
13.
4
K
22.
5
K
31.
6,8
K
40.
6,8
K
5.
2
K
14.
4
K
23.
5
K
32.
6,8
K
41.
6,8
K
6.
2
K
15.
4
K
24.
5
K
33.
6,8
K
42.
6,8
K
7.
2
K
16.
4
AP
25.
5
K
34.
6,8
K
43.
7
K
8.
3
K
17.
4
C
26.
5
C
35.
6,8
K
44.
7
K
9.
3
K
18.
5
K
27.
5
K
36.
6,8
K
45.
7
K
Multiple Choice Questions
46.
1
K
79.
3
AP
112.
5
K
145.
6,8
AP
178.
6,8
K
47.
1
K
80.
3
AP
113.
5
K
146.
6,8
AP
179.
6,8
AN
48.
1
K
81.
3
C
114.
5
K
147.
6,8
AP
180.
6,8
C
49.
2
AP
82.
3
K
115.
5
K
148.
6,8
AP
181.
6,8
AN
50.
2
AP
83.
3
K
116.
5
K
149.
6,8
AP
182.
6,8
AP
51.
2
K
84.
3
K
117.
5
K
150.
6,8
AP
183.
6,8
AP
52.
2
K
85.
3
AP
118.
5
AP
151.
6,8
AP
184.
6,8
AP
53.
2
C
86.
3
K
119.
5
AP
152.
6,8
K
185.
6,8
AP
54.
2
C
87.
4
K
120.
5
AP
153.
6,8
K
186.
6,8
AP
55.
2
K
88.
4
AP
121.
5
AP
154.
6,8
K
187.
6,8
AP
56.
2
K
89.
4
K
122.
5
AP
155.
6,8
K
188.
6,8
AP
57.
2
K
90.
4
K
123.
5
K
156.
6,8
AP
189.
6,8
AP
58.
2
C
91.
4
K
124.
5
K
157.
6,8
AP
190.
6,8
AN
59.
2
K
92.
4
K
125.
6,8
K
158.
6,8
AP
191.
6,8
AP
60.
2
K
93.
4
K
126.
6,8
K
159.
6,8
AP
192.
6,8
AP
61.
2
K
94.
4
K
127.
6,8
K
160.
6,8
K
193.
6,8
AP
62.
2
C
95.
4
AP
128.
6,8
K
161.
6,8
AP
194.
6,8
AP
63.
2
K
96.
4
AP
129.
6,8
K
162.
6,8
K
195.
6,8
AP
64.
2
AP
97.
4
AP
130.
6,8
K
163.
6,8
AP
196.
6,8
AP
65.
2
AP
98.
4
AP
131.
6,8
C
164.
6,8
K
197.
6,8
AP
66.
2
AP
99.
4
K
132.
6,8
C
165.
6,8
AP
198.
6,8
AP
67.
2
AP
100.
4
AP
133.
6,8
K
166.
6,8
K
199.
6,8
AP
68.
2
K
101.
4
K
134.
6,8
K
167.
6,8
K
200.
6,8
AP
69.
2
K
102.
4
AP
135.
6,8
K
168.
6,8
K
201.
6,8
AP
70.
2
K
103.
4
K
136.
6,8
K
169.
6,8
K
202.
6,8
AP
71.
2
C
104.
4
AP
137.
6,8
K
170.
6,8
K
203.
6,8
AP
72.
2
K
105.
5
K
138.
6,8
K
171.
6,8
AN
204.
6,8
AP
73.
2
AP
106.
5
K
139.
6,8
C
172.
6,8
K
205.
6,8
AP
74.
2
K
107.
5
K
140.
6,8
K
173.
6,8
K
206.
6,8
K
75.
2
AP
108.
5
K
141.
6,8
AP
174.
6,8
AN
207.
6,8
K
76.
2
AP
109.
5
K
142.
6,8
AP
175.
6,8
AN
208.
6,8
K
77.
3
K
110.
5
K
143.
6,8
C
176.
6,8
AN
209.
6,8
K
78.
3
K
111.
5
K
144.
6,8
AP
177.
6,8
K
210.
6,8
K
Test Bank for Accounting: Tools for Business Decision Making, Fifth Edition
FOR INSTRUCTOR USE ONLY
13-2
Multiple Choice Questions (Cont.)
211.
6,8
AN
214.
6,8
K
217.
7
C
220.
7
K
212.
6,8
AP
215.
6,8
AN
218.
7
C
221.
7
C
213.
6,8
AP
216.
6,8
C
219.
7
C
Brief Exercises
222.
2
K
227
4
AP
232.
4, 5
AP
237.
6,8
AP
242.
6,8
AP
223.
2
K
228
4
AP
233.
5
AP
238.
6,8
AP
243.
6,8
AP
224.
2
AP
229.
4
AP
234.
5
AP
239.
6,8
AP
225.
2
AP
230.
4
AN
235.
6,8
AP
240.
6,8
AN
226.
4
AP
231.
4
C
236.
6,8
AP
241.
6,8
AP
Exercises
244.
4
AN
247.
4,5
AP
250.
5
AP
253.
6,8
AN
256.
6,8
AP
245.
4
AP
248.
4, 5
AP
251.
6,8
AP
254.
6,8
AP
246.
4
AP
249.
5
AN
252.
6,8
AP
255.
6,8
AN
Completion Statements
257.
2
K
260.
4
K
263.
6,8
K
266.
6,8
K
269.
6,8
K
258.
2
K
261.
5
K
264.
6,8
K
267.
6,8
K
259.
2
K
262.
6,8
K
265.
6,8
K
268.
6,8
K
Matching
270.
6,8
K
271.
6,8
K
Short Answer Essay
272.
1
C
274.
3
K
276.
6,8
K
278.
6,8
S
273.
2
K
275.
4, 5
C
277.
7
C
SUMMARY OF LEARNING OBJECTIVES BY QUESTION TYPE
Learning Objective 1
Item
Type
Item
Type
Item
Type
Item
Type
Item
Type
Item
Type
1.
TF
46.
MC
47.
MC
48.
MC
272.
SA
Learning Objective 2
2.
TF
50.
MC
57.
MC
64.
MC
71.
MC
223.
Be
3.
TF
51.
MC
58.
MC
65.
MC
72.
MC
224.
Be
4.
TF
52.
MC
59.
MC
66.
MC
73.
MC
225.
Be
5.
TF
53.
MC
60.
MC
67.
MC
74.
MC
257.
C
6.
TF
54.
MC
61.
MC
68.
MC
75.
MC
258.
C
7.
TF
55.
MC
62.
MC
69.
MC
76.
MC
259.
C
49.
MC
56.
MC
63.
MC
70.
MC
222.
Be
273.
SA
Learning Objective 3
8.
TF
11.
TF
79.
MC
82.
MC
85.
MC
9.
TF
77.
MC
80.
MC
83.
MC
86.
MC
10.
TF
78.
MC
81.
MC
84.
MC
274.
SA

Financial Analysis: The Big Picture
FOR INSTRUCTOR USE ONLY
13-3
Learning Objective 4
Item
Type
Item
Type
Item
Type
Item
Type
Item
Type
Item
Type
12.
TF
88.
MC
95.
MC
102.
MC
230.
Be
248.
Ex
13.
TF
89.
MC
96.
MC
103.
MC
231.
Be
260.
C
14.
TF
90.
MC
97.
MC
104.
MC
232.
Be
275.
SA
15.
TF
91.
MC
98.
MC
226.
Be
244.
Ex
16.
TF
92.
MC
99.
MC
227.
Be
245.
Ex
17.
TF
93.
MC
100.
MC
228.
Be
246.
Ex
87.
MC
94.
MC
101.
MC
229.
Be
247.
Ex
Learning Objective 5
12.
TF
24.
TF
108.
MC
115.
MC
122.
MC
248.
Ex
18.
TF
25.
TF
109.
MC
116.
MC
123.
MC
249.
Ex
19.
TF
26.
TF
110.
MC
117.
MC
124.
MC
250.
Ex
20.
TF
27.
TF
111.
MC
118.
MC
232.
Be
261.
C
21.
TF
105.
MC
112.
MC
119.
MC
233.
Be
275.
SA
22.
TF
106.
MC
113.
MC
120.
MC
234.
Be
23.
TF
107.
MC
114.
MC
121.
MC
247.
Ex
Learning Objective 6
28.
TF
133.
MC
156.
MC
179.
MC
202.
MC
243.
Be
29.
TF
134.
MC
157.
MC
180.
MC
203.
MC
251.
Ex
30.
TF
135.
MC
158.
MC
181.
MC
204.
MC
252.
Ex
31.
TF
136.
MC
159.
MC
182.
MC
205.
MC
253.
Ex
32.
TF
137.
MC
160.
MC
183.
MC
206.
MC
254.
Ex
33.
TF
138.
MC
161.
MC
184.
MC
207.
MC
255.
Ex
34.
TF
139.
MC
162.
MC
185.
MC
208.
MC
256.
Ex
35.
TF
140.
MC
163.
MC
186.
MC
209.
MC
262.
C
36.
TF
141.
MC
164.
MC
187.
MC
210.
MC
263.
C
37.
TF
142.
MC
165.
MC
188.
MC
211.
MC
264.
C
38.
TF
143.
MC
166.
MC
189.
MC
212.
MC
265.
C
39.
TF
144.
MC
167.
MC
190.
MC
213.
MC
266.
C
40.
TF
145.
MC
168.
MC
191.
MC
214.
MC
267.
C
41.
TF
146.
MC
169.
MC
192.
MC
215.
MC
268.
C
42.
TF
147.
MC
170.
MC
193.
MC
216.
MC
269.
C
125.
MC
148.
MC
171.
MC
194.
MC
235.
Be
270.
Ma
126.
MC
149.
MC
172.
MC
195.
MC
236.
Be
276.
SA
127.
MC
150.
MC
173.
MC
196.
MC
237.
Be
278.
SA
128.
MC
151.
MC
174.
MC
197.
MC
238.
Be
129.
MC
152.
MC
175.
MC
198.
MC
239.
Be
130.
MC
153.
MC
176.
MC
199.
MC
240.
Be
131.
MC
154.
MC
177.
MC
200.
MC
241.
Be
132.
MC
155.
MC
178.
MC
201.
MC
242.
Be
Test Bank for Accounting: Tools for Business Decision Making, Fifth Edition
FOR INSTRUCTOR USE ONLY
13-4
Learning Objective 7
Item
Type
Item
Type
Item
Type
Item
Type
Item
Type
Item
Type
43.
TF
45.
TF
218.
MC
220.
MC
277.
SA
44.
TF
217.
MC
219.
MC
221.
MC
Learning Objective 8
28.
TF
133.
MC
156.
MC
179.
MC
202.
MC
243.
Be
29.
TF
134.
MC
157.
MC
180.
MC
203.
MC
251.
Ex
30.
TF
135.
MC
158.
MC
181.
MC
204.
MC
252.
Ex
31.
TF
136.
MC
159.
MC
182.
MC
205.
MC
253.
Ex
32.
TF
137.
MC
160.
MC
183.
MC
206.
MC
254.
Ex
33.
TF
138.
MC
161.
MC
184.
MC
207.
MC
255.
Ex
34.
TF
139.
MC
162.
MC
185.
MC
208.
MC
256.
Ex
35.
TF
140.
MC
163.
MC
186.
MC
209.
MC
262.
C
36.
TF
141.
MC
164.
MC
187.
MC
210.
MC
263.
C
37.
TF
142.
MC
165.
MC
188.
MC
211.
MC
264.
C
38.
TF
143.
MC
166.
MC
189.
MC
212.
MC
265.
C
39.
TF
144.
MC
167.
MC
190.
MC
213.
MC
266.
C
40.
TF
145.
MC
168.
MC
191.
MC
214.
MC
267.
C
41.
TF
146.
MC
169.
MC
192.
MC
215.
MC
268.
C
42.
TF
147.
MC
170.
MC
193.
MC
216.
MC
269.
C
125.
MC
148.
MC
171.
MC
194.
MC
235.
Be
270.
Ma
126.
MC
149.
MC
172.
MC
195.
MC
236.
Be
276.
SA
127.
MC
150.
MC
173.
MC
196.
MC
237.
Be
278.
SA
128.
MC
151.
MC
174.
MC
197.
MC
238.
Be
129.
MC
152.
MC
175.
MC
198.
MC
239.
Be
130.
MC
153.
MC
176.
MC
199.
MC
240.
Be
131.
MC
154.
MC
177.
MC
200.
MC
241.
Be
132.
MC
155.
MC
178.
MC
201.
MC
242.
Be
Note: TF = True-False C = Completion
MC = Multiple Choice Ex = Exercise
Ma = Matching SA = Short Answer Essay

Financial Analysis: The Big Picture
FOR INSTRUCTOR USE ONLY
13-5
CHAPTER LEARNING OBJECTIVES
1. Understand the concept of sustainable income. Sustainable income refers to a company’s
ability to sustain its profits from operations.
2. Indicate how irregular items are presented. Irregular items—discontinued operations and
extraordinary items—are presented on the income statement net of tax below “Income before
irregular items” to highlight their unusual nature. Changes in accounting principle are reported
retroactively.
3. Explain the concept of comprehensive income. Comprehensive income includes all
changes in stockholders’ equity during a period except those resulting from investments by
stockholders and distributions to stockholders. “Other comprehensive income” is added to net
income to arrive at comprehensive income.
4. Describe and apply horizontal analysis. Horizontal analysis is a technique for evaluating a
series of data over a period of time to determine the increase or decrease that has taken
place, expressed as either an amount or a percentage.
5. Describe and apply vertical analysis. Vertical analysis is a technique that expresses each
item in a financial statement as a percentage of a relevant total or a base amount.
6. Identify and compute ratios used in analyzing a company’s liquidity, solvency, and
profitability. Financial ratios are provided in Illustration 13-16 (liquidity), Illustration 13-17
(solvency) and Illustration 13-18 (profitability).
7. Understand the concept of quality of earnings. A high quality of earnings provides full and
transparent information that will not confuse or mislead users of the financial statements.
Issues related to quality of earnings are (1) alternative accounting methods, (2) pro forma
income, and (3) improper recognition. The price-earnings (P-E) ratio reflects investors’
assessment of a company’s future earnings potential.
*8. Evaluate a company comprehensively using ratio analysis. To evaluate a company, ratios
(liquidity, solvency, and profitability) provide clues to underlying conditions, but intracompany,
intercompany, and industry average comparisons are also needed.
Test Bank for Accounting: Tools for Business Decision Making, Fifth Edition
13-6
TRUE-FALSE STATEMENTS
1. Analysts are interested in sustainable income, which is equal to the past year’s net income.
2. One objective of the income statement is to separate the results of continuing operations
from those of discontinued operations.
3. When the disposal of a significant segment occurs, the income statement should report
both income from continuing operations and income (loss) from discontinued operations.
4. An event or transaction should be classified as an extraordinary item if it is unusual in
nature or if it occurs infrequently.
5. Companies report most changes in accounting principle currently.
6. The loss on disposal of a significant component of a business is disclosed in the statement
of retained earnings.
7. A change in accounting principle occurs when the principle used in the current year is
different from the one used by competitors in the current year.
8. Comprehensive income includes all changes in stockholders’ equity during a period except
those resulting from investments by stockholders and distributions to stockholders.
9. Comprehensive income includes all revenues, expenses, gains, losses, and dividends.
10. Intracompany comparisons of the same financial statement items are often useful to detect
changes in financial relationships and significant trends.
11. Comparisons of company data with industry averages provide information about a
company’s relative position within the industry.
Financial Analysis: The Big Picture
13-7
12. Horizontal, vertical, and circular analyses are the basic tools of financial statement
analysis.
13. In horizontal analysis, the base year is the most current year being examined.
14. Horizontal analysis is a technique for evaluating a financial statement item in the current
year with other items in the current year.
15. Another name for horizontal analysis is trend analysis.
16. If a company has sales of $130 in 2014 and $182 in 2013, the percentage decrease in
sales from 2013 to 2014 is 40%.
17. In horizontal analysis, if an item has a negative amount in the base year, and a positive
amount in the following year, no percentage change for that item can be computed.
18. A primary purpose of vertical analysis is to observe trends over a three-year period.
19. Vertical analysis is a technique for evaluating a series of financial statement data over a
period of time to determine the increase (decrease) that has taken place.
20. Common size analysis expresses each item in a financial statement as a percent of a base
amount.
21. In a common size income statement, net sales are represented by 100%.
22. In a common size income statement, each item is expressed as a percentage of net
income.
23. In a common size balance sheet, total assets are represented by 100%.
Test Bank for Accounting: Tools for Business Decision Making, Fifth Edition
13-8
24. In the vertical analysis of a balance sheet, the base for current liabilities is total liabilities.
25. Vertical analysis is useful in making comparisons of companies of different sizes.
26. Using vertical analysis of the income statement, a company’s net income as a percentage
of net sales is 15%; therefore, the cost of goods sold as a percentage of sales must be
85%.
27. In the vertical analysis of an income statement, each item is generally stated as a
percentage of net income.
28. Liquidity ratios measure the ability of the enterprise to survive over a long period of time.
29. A solvency ratio measures the income or operating success of an enterprise for a given
period of time.
30. The current ratio is a measure of all the ratios calculated for the current year.
31. Accounts receivable turnover is useful in assessing the profitability of receivables.
32. Inventory turnover measures the number of times on average the inventory was sold
during the period.
33. Inventory turnover is a measure of liquidity that focuses on efficient use of inventory.
34. Profitability ratios are frequently used as a basis for evaluating management’s operating
effectiveness.
35. Both profit margin and asset turnover affect a company’s return on assets.
Financial Analysis: The Big Picture
FOR INSTRUCTOR USE ONLY
13-9
36. Leverage and return on equity are closely related.
37. The return on assets will be greater than the rate of return on common stockholders’ equity
if the company has been successful in trading on the equity at a gain.
38. The current ratio is one of the most utilized measures of profitability.
39. From a creditor’s point of view, the higher the debt to assets ratio, the lower the risk that
the company may be unable to pay its obligations.
40. A current ratio of 1.2 to 1 indicates that a company’s current assets exceed its current
liabilities.
41. Using borrowed money to increase the rate of return on common stockholders’ equity is
called “trading on the equity.”
42. Declining profitability and liquidity ratios are indications that a company may not survive.
43. Alternative accounting methods affect the quality of earnings.
44. Improper recognition of income is not one of the factors affecting the quality of earnings.
45. Because pro forma earnings are based on specific rules, these amounts are highly reliable.
Answers to True-False Statements
Test Bank for Accounting: Tools for Business Decision Making, Fifth Edition
13–10
MULTIPLE CHOICE QUESTIONS
46. Which of the following income statement figures would probably be the best indicator of a
company’s future performance?
a. Total revenues
b. Income from operations
c. Net income
d. Gross profit
47. Which of the following is the best definition of sustainable income?
a. Sustainable income is a measure of solvency that does not include capital expenditure.
b. Sustainable income is the same as net income.
c. Sustainable income is income that is unusual in nature and infrequent in occurrence.
d. Sustainable income is the most likely level of income to be obtained in the future.
48. When preparing an income statement, which of the following is the proper order for income
statement components?
a. Comprehensive income, Other comprehensive income items, irregular items, Net
income
b. Net income, irregular items, Comprehensive income, Other comprehensive income
items
c. Irregular items, Net income, Other comprehensive income items, Comprehensive
income
d. Irregular items, Net income, Comprehensive income, Other comprehensive income
items
49. Sophie’s Dog Supplies has income before taxes of $550,000 and an extraordinary loss of
$170,000. If the income tax rate is 30% on all items, the income statement should show
income before irregular items and an extraordinary loss, respectively, of
a. $550,000 and ($170,000).
b. $385,000 and ($86,700).
c. $385,000 and ($119,000).
d. $165,000 and ($51,000).
50. If a company has an extraordinary gain of $20,000 and a 32% tax rate, what is the effect
on net income?
a. Increase of $20,000.
b. Increase of $13,600.
c. Increase of $6,400.
d. No effect.
Financial Analysis: The Big Picture
13–11
51. An extraordinary item must meet which of the following two criteria?
a. Foreseeable and material
b. Infrequent and unusual
c. Substantial and measurable
d. Unusual and measurable
52. All of the following are reported on the income statement net of tax except
a. irregular items.
b. other comprehensive income items.
c. income from operations.
d. extraordinary items.
53. Indian River Groves in central Florida lost about 10% of its strawberries (or $750,000) due
to frost. Based on this information, how will Indian River Groves most likely report this
loss?
a. As an extraordinary item net of taxes.
b. Below discontinued operations.
c. As a pretax ordinary loss prior to income before income taxes.
d. As a discontinued operation net of taxes.
54. All of the following statements regarding changes in accounting principles are true except
which of the following?
a. Most changes in accounting principles are only reported in current periods when the
principle change takes place.
b. Changes in accounting principles are allowed when new principles are preferable to old
ones.
c. Most changes in accounting principles are retroactively reported.
d. Consistency is one of the biggest concerns when a change in accounting principle is
undertaken.
55. An income statement would not include
a. other revenue and gains.
b. extraordinary items.
c. discontinued operations.
d. dividends paid.
56. The discontinued operations section of the income statement refers to
a. discontinuance of a product line.
b. the income or loss on products that have been completed and sold.
c. obsolete equipment and discontinued inventory items.
d. the disposal of a significant component of a business.
Test Bank for Accounting: Tools for Business Decision Making, Fifth Edition
13–12
57. Which one of the following would be classified as an extraordinary item?
a. Expropriation of property by a foreign government
b. Losses attributed to a labor strike
c. Write-down of inventories
d. Gains or losses from sales of equipment
58. When a change in depreciation method occurs
a. prior years‘ financial statements should be changed to reflect the newly adopted
method.
b. the change should be reported in current and future years.
c. the cumulative effect of the change should be reflected on the income statement as of
the beginning of the next year.
d. the cumulative effect of the change in accounting principle should be classified as an
extraordinary item on the income statement.
59. If an item meets one (but not both) of the criteria for an extraordinary item, it
a. only needs to be disclosed in the footnotes of the financial statements.
b. may be treated as sales revenue (if it is a gain) and as an operating expense (if it is a
loss).
c. is reported as an “other revenue or gain” or “other expense and loss,” net of tax.
d. is reported at its gross amount as an “other revenue or gain” or “other expense or
loss.”
60. The order of presentation of items that may appear on the income statement is
a. Extraordinary items, Discontinued operations, Income before income taxes.
b. Discontinued operations, Extraordinary items, Income before income taxes.
c. Income before income taxes, Discontinued operations, Extraordinary items.
d. Income before income taxes, Extraordinary items, Discontinued operations.
61. Which of the following items appears on the income statement before income before
irregular items?
a. Other comprehensive income.
b. Extraordinary items.
c. Income tax expense.
d. Discontinued operations.
Financial Analysis: The Big Picture
13–13
62. Which of the following items should be classified as an extraordinary item on an income
statement?
a. Gain on the sale of property, plant or equipment
b. Loss due to expropriation of property by a foreign government
c. Loss due to discontinued operations
d. Excess of the selling price over the cost of treasury stock
63. Which of the following statements is true with respect to financial statement reporting for all
cases when a company changes from one acceptable accounting method to another?
a. Comparability across periods is impaired
b. Only a footnote is required to report the change
c. Changes in both depreciation methods and inventory methods are reported
retroactively.
d. Management must indicate that the accounting method change is preferable to the old
method.
64. The Holiday House had severe damage done to its Christmas inventory due to an escaped
circus monkey rampaging through the store. The inventory loss was $150,000 before
applicable taxes of $30,000. The Holiday House should record the loss as a(n)
a. $150,000 loss in other expenses and losses.
b. $180,000 extraordinary loss.
c. $120,000 extraordinary loss.
d. $130,000 extraordinary loss.
65. Shambhala Spice Company has experienced a $60,000 loss due to tornado damage to
their inventory. Tornados have never before occurred in this area. Assuming that the
company’s tax rate is 30%, what amount will be reported for this loss on the income
statement?
a. $60,000
b. $42,000
c. $18,000
d. $36,000
Test Bank for Accounting: Tools for Business Decision Making, Fifth Edition
13–14
66. Patchett Company reported income before taxes of $800,000 and an extraordinary loss of
$200,000. Assume that the company’s tax rate is 25%. What amounts will be reported on
the income statement for income before irregular items and extraordinary items,
respectively?
a. $600,000 and $200,000
b. $600,000 and $150,000
c. $600,000 and $180,000
d. $600,000 and $170,000
67. Dandy Candy Company sold its licorice division resulting in a loss of $60,000. Assuming a
tax rate of 25%, the loss on this disposal will be reported on the income statement at what
amount?
a. $75,000
b. $15,000
c. $60,000
d. $45,000
68. Which of the following is not an irregular item on the income statement?
a. Discontinued operations
b. Extraordinary items
c. Other revenues and expenses
d. Loss on disposal of a significant component of a business
69. Which of the following would not be considered an example of a discontinued operation?
a. Shifting production processes within an operation
b. Elimination of a major class of customers
c. Elimination of an entire activity
d. Disposal of a significant component of a business
70. Extraordinary items are reported on the income statement immediately
a. below income from continuing operations.
b. after comprehensive income.
c. below income before taxes.
d. after discontinued operations.
Financial Analysis: The Big Picture
13–15
71. Which of the following would not be considered a change in accounting principle?
a. Changing the estimated percentage used in calculating bad debt expense
b. Changing the inventory costing method used from FIFO to LIFO
c. Changing from straight-line depreciation to double-declining balance depreciation
d. Changing from the cost method of accounting for investments to the equity method
72. In reporting discontinued operations, the income statement should show in a special
section
1. gains on the disposal of a discontinued component.
2. losses on the disposal of a discontinued component.
a. 1 only.
b. 2 only.
c. neither 1 nor 2.
d. both 1 and 2.
73. R. Stone Corporation has income before taxes of $780,000 and an extraordinary gain of
$200,000. If the income tax rate is 25% on all items, the income statement should show
income before irregular items and extraordinary items, respectively, of
a. $635,000 and $200,000.
b. $635,000 and $150,000.
c. $585,000 and $200,000.
d. $585,000 and $150,000.
74. The disposal of a significant component of a business is called
a. a change in accounting principle.
b. an extraordinary item.
c. an other expense.
d. discontinued operations.
75. Lupton Inc. disposes of an unprofitable segment of its business. The operation of the
segment suffered a $160,000 loss in the year of disposal. The loss on disposal of the
segment was $80,000. If the tax rate is 30%, and income before income taxes was
$1,300,000,
a. the income tax expense on the income before discontinued operations is $318,000.
b. the income from continuing operations is $910,000.
c. net income is $1,060,000.
d. the losses from discontinued operations are reported net of income taxes at $240,000.
Test Bank for Accounting: Tools for Business Decision Making, Fifth Edition
13–16
76. Stellar, Inc. decided on January 1 to discontinue its telescope manufacturing division. On
July 1, the division’s assets with a book value of $840,000 are sold for $600,000.
Operating income from January 1 to June 30 for the division amounted to $130,000.
Ignoring income taxes, what total amount should be reported on Stellar’s income statement
for the current year under the caption, Discontinued Operations?
a. $130,000
b. $110,000 loss
c. $240,000 loss
d. $370,000
77. Comprehensive income would not include
a. dividends declared.
b. unrealized gains on available-for-sale securities.
c. discontinued operations.
d. extraordinary gains and losses.
78. Which of the following would be considered an “Other Comprehensive Income” item?
a. Net income
b. Gain on disposal of discontinued operations
c. Extraordinary loss related to flood
d. Unrealized loss on available-for-sale securities
79. Jack’s by the Tracks. has the following partial balance sheet:
JACK’S BY THE TRACKS.
Balance Sheet (partial)
Stockholders’ Equity:
Common Stock $6,000,000
Retained Earnings 2,000,000
Total Paid-in capital and retained earnings 8,000,000
Add: Unrealized gain on available-for-sale securities 800,000
Total Stockholders’ Equity: $8,800,000
What effect will the unrealized gain on available for sales securities have on comprehensive
income?
a. No effect on comprehensive income.
b. Increase of $800,000 in comprehensive income.
c. Increase of $8,800,000 in comprehensive income.
d. Decrease of $800,000 in comprehensive income.
Financial Analysis: The Big Picture
13–17
80. Reardon Inc. has an investment in trading securities of $120,000. This investment
experienced an unrealized loss of $6,000 during the current year. Assuming a 35% tax
rate, the effect of this loss on comprehensive income will be
a. no effect.
b. $120,000 increase.
c. $42,000 decrease.
d. $78,000 decrease.
81. Which of the following would be considered an “Other comprehensive income” item?
a. Loss on disposal of discontinued operations
b. Unrealized loss on available-for-sale securities
c. Extraordinary gain due to expropriated plant facilities
d. Net income
82. Comparisons of financial data made within a company are called
a. intracompany comparisons.
b. interior comparisons.
c. intercompany comparisons.
d. industry comparisons.
83. Which one of the following is not a tool in financial statement analysis?
a. Horizontal analysis
b. Circular analysis
c. Vertical analysis
d. Ratio analysis
84. All of the following statements are true regarding comprehensive income except
a. companies are required to report comprehensive income.
b. a company would add an unrealized loss on available-for-sale securities to net income
to calculate comprehensive income.
c. comprehensive income does not include changes resulting from investments by
stockholders.
d. comprehensive income does not include dividends to stockholders.
Test Bank for Accounting: Tools for Business Decision Making, Fifth Edition
13–18
85. On January 1, 2014, Tri-State Industries had cash and common stock of $180,000. At that
date the company had no other asset, liability or equity balances. On January 2, 2014, it
purchased $160,000 of equity securities for cash that it classified as available-for-sale. It
received cash dividends of $9,000 during the year on these securities. In addition, it had an
unrealized holding gain on these securities of $24,000 net of tax. Based on this
information, what is the amount of comprehensive income in 2014?
a. $33,000
b. $273,000
c. $9,000
d. $24,000
86. A comparison with other companies that provides insight into a company’s competitive
position is most commonly known as which of the following types of comparisons?
a. Industry average comparison
b. Intracompany comparison
c. Intercompany comparison
d. Comprehensive income comparison
87. When a horizontal analysis is performed and a zero or negative amount is reported in the
base year, then
a. no percentage change can be computed.
b. the percent change will be negative.
c. the accountant has made a mistake.
d. the percentage change will be 100% of greater.
88. Danner Corporation reported net sales of $600,000, $680,000, and $780,000 in the years
2013, 2014, and 2015, respectively. If 2013 is the base year, what percentage do 2015
sales represent of the base?
a. 115%
b. 130%
c. 77%
d. 30%
89. In analyzing financial statements, horizontal analysis is a
a. requirement.
b. tool.
c. principle.
d. theory.
Financial Analysis: The Big Picture
13–19
90. Horizontal analysis is also known as
a. linear analysis.
b. vertical analysis.
c. trend analysis.
d. common size analysis.
91. Under which of the following cases may a percentage change be computed?
a. The trend of the amounts is decreasing but all amounts are positive.
b. There is no amount in the base year.
c. There is a negative amount in the base year and a negative amount in the subsequent
year.
d. There is a negative amount in the base year and a positive amount in the subsequent
year.
92. Horizontal analysis is a technique for evaluating a series of financial statement data over a
period of time
a. that has been arranged from the highest number to the lowest number.
b. that has been arranged from the lowest number to the highest number.
c. to determine which items are in error.
d. to determine the amount and/or percentage increase or decrease that has taken place.
93. Horizontal analysis of comparative financial statements includes the
a. development of common size statements.
b. calculation of liquidity ratios.
c. calculation of dollar amount and percentage changes from financial statements over a
period of time, as compared to a base year.
d. evaluation of financial statement data that expresses each item in a financial statement
as a percentage of a base amount.
94. Horizontal analysis is a technique for evaluating financial statement data
a. within a period of time.
b. over a period of time.
c. on a certain date.
d. as it may appear in the future.
Test Bank for Accounting: Tools for Business Decision Making, Fifth Edition
13–20
95. If Year 1 equals $800, Year 2 equals $840, and Year 3 equals $900, the percentage to be
assigned for Year 3 in a trend analysis, assuming that Year 1 is the base year, is
a. 112.5%.
b. 105%.
c. 88.8%.
d. 100%.
96. If Year 1 equals $780, Year 2 equals $858, and Year 3 equals $896, the percentage to be
assigned for Year 2 in a trend analysis, assuming that Year 1 is the base year, is
a. 100%.
b. 120%.
c. 110%.
d. 115%.
97. Assume the following sales data for a company:
2015 $910,000
2014 $770,000
2013 700,000
If 2013 is the base year, what is the percentage increase in sales from 2013 to 2014?
a. 130%
b. 110%
c. 30%
d. 10%
98. If Year 1 equals $700, Year 2 equals $810, and Year 3 equals $650, the percentage to be
assigned for Year 1 in a trend analysis, assuming that Year 1 is the base year, is
a. 100%.
b. 89%.
c. 105%.
d. 112%.
99. In horizontal or trend analysis, each item is expressed as a(n)
a. amount.
b. percentage.
c. rate.
d. amount or a percentage.
Financial Analysis: The Big Picture
13–21
100. Assume the following sales data for a company:
2015 $960,000
2014 720,000
2013 600,000
If 2013 is the base year, what is the percentage increase in sales from 2013 to 2014?
a. 60%
b. 20%
c. 120%
d. 160%
101. Comparative balance sheets
a. are usually prepared for at least one year.
b. are usually prepared for at least two years.
c. do not show both dollar amount and percentage changes.
d. do not show a comparison of total stockholders’ equity.
102. Assume the following cost of goods sold data for a company:
2015 $1,300,000
2014 1,200,000
2013 1,000,000
If 2013 is the base year, what is the percentage increase in cost of goods sold from 2013
to 2015?
a. 130%
b. 30%
c. 70%
d. 20%
103. In horizontal analysis, each item is expressed as a percentage of the
a. net income amount.
b. stockholders’ equity amount.
c. total assets amount.
d. base-year amount.
Test Bank for Accounting: Tools for Business Decision Making, Fifth Edition
13–22
104. Boone Trading Company reported net sales of $400,000, $440,000, and $520,000 in the
years 2013, 2014, and 2015, respectively. If 2013 is the base year, what is the trend
percentage for 2015?
a. 77%
b. 118%
c. 130%
d. 78%
105. Comparisons of data within a company are an example of the following comparative basis
a. industry averages.
b. intercompany.
c. intracompany.
d. interregional.
106. Vertical analysis is also known as
a. perpendicular analysis.
b. common size analysis.
c. trend analysis.
d. straight-line analysis.
107. In a common size balance sheet, the 100 percent figure is
a. total current assets.
b. total property, plant and equipment.
c. total liabilities.
d. total assets.
108. In a common size financial statement, which of the following is given a percentage of 100
percent?
a. Total liabilities
b. Net income
c. Total assets
d. Cost of goods sold
109. In a common size income statement, the 100% figure is
a. net income.
b. cost of goods sold.
c. gross profit.
d. net sales.
Financial Analysis: The Big Picture
13–23
110. A balance sheet that displays only component percentages is called a ________ balance
sheet.
a. condensed
b. common size
c. comparative
d. trendy
111. Vertical analysis is a technique that expresses each item in a financial statement
a. in dollars and cents.
b. as a percent of the item in the previous year.
c. as a percent of a base amount.
d. starting with the highest value down to the lowest value.
112. In vertical analysis
a. a base amount is required.
b. a base amount is optional.
c. the same base is used across all financial statements analyzed.
d. the results of the horizontal analysis are necessary inputs for performing the analysis.
113. The best way to study the relationship of the components within a financial statement is to
prepare
a. common size statements.
b. a trend analysis.
c. profitability analysis.
d. ratio analysis.
114. In performing a vertical analysis, the base for prepaid expenses is
a. total current assets.
b. total assets.
c. total liabilities.
d. prepaid expenses in a previous year.
115. In performing a vertical analysis, the base for sales revenues on the income statement is
a. net sales.
b. sales revenue.
c. net income.
d. cost of goods available for sale.
Test Bank for Accounting: Tools for Business Decision Making, Fifth Edition
13–24
116. In performing a vertical analysis, the base for sales returns and allowances is
a. sales revenue.
b. sales discounts.
c. net sales.
d. total revenues.
117. In performing a vertical analysis, the base for cost of goods sold is
a. total selling expenses.
b. net sales.
c. total revenues.
d. total expenses.
118. Salamagundi, Inc. has the following Income Statement (in millions):
SALAMAGUNDI, INC.
Income Statement
For the Year Ended December 31, 2014
Net Sales $160
Cost of Goods Sold 90
Gross Profit 70
Operating Expenses 40
Net Income $ 30
Using vertical analysis, what percentage is assigned to net sales?
a. 150%
b. Can’t be computed.
c. 60%
d. 100%
119. Salamagundi, Inc. has the following Income Statement (in millions):
SALAMAGUNDI, INC.
Income Statement
For the Year Ended December 31, 2014
Net Sales $160
Cost of Goods Sold 90
Gross Profit 70
Operating Expenses 40
Net Income $ 30
Using vertical analysis, what percentage is assigned to gross profit?
a. 43.8%
b. 100%
c. 60%
d. 56.3%
Financial Analysis: The Big Picture
13–25
120. Cochran Corporation, Inc. has the following income statement (in millions):
COCHRAN CORPORATION, INC.
Income Statement
For the Year Ended December 31, 2014
Net Sales $240
Cost of Goods Sold 80
Gross Profit 160
Operating Expenses 65
Net Income $ 95
Using vertical analysis, what percentage is assigned to cost of goods sold?
a. 67%
b. 33%
c. 100%
d. 30%
121. Cochran Corporation, Inc. has the following income statement (in millions):
COCHRAN CORPORATION, INC.
Income Statement
For the Year Ended December 31, 2014
Net Sales $240
Cost of Goods Sold 80
Gross Profit 160
Operating Expenses 65
Net Income $ 95
Using vertical analysis, what percentage is assigned to net income?
a. 100%
b. 60%
c. 40%
d. 33%
122. Given the following data for the King Company:
Current liabilities $ 400
Long-term debt 480
Common stock 700
Retained earnings 520
Total liabilities & stockholders’ equity $2,100
How would common stock appear on a common size balance sheet?
a. 25%
b. 58%
c. 33%
d. 30%
Test Bank for Accounting: Tools for Business Decision Making, Fifth Edition
13–26
123. The following schedule is a display of what type of analysis?
Amount Percent
Current assets $100,000 25%
Property, plant, and equipment 300,000 75%
Total assets $400,000 100%
a. Horizontal analysis
b. Differential analysis
c. Vertical analysis
d. Ratio analysis
124. In vertical analysis, the base amount for salaries and wages expense is generally
a. net sales.
b. salary & wages expense in a previous year.
c. gross profit.
d. net income.
125. Which one of the following is not a characteristic generally evaluated in ratio analysis?
a. Liquidity
b. Profitability
c. Marketability
d. Solvency
126. Ratios are most useful in identifying
a. trends.
b. differences.
c. causes.
d. relationships.
127. Short-term creditors are usually most interested in assessing
a. solvency.
b. liquidity.
c. marketability.
d. profitability.
128. A common measure of liquidity is
a. return on assets.
b. accounts receivable turnover.
c. profit margin.
d. debt to equity.
Financial Analysis: The Big Picture
13–27
129. A common measure of profitability is the
a. current ratio.
b. current cash debt coverage.
c. return on common stockholders’ equity.
d. debt to assets.
130. A common measure of long-term solvency is
a. the cash debt coverage.
b. the current ratio.
c. the asset turnover.
d. inventory turnover.
131. Return on assets is most closely related to
a. profit margin and debt to assets ratio.
b. profit margin and asset turnover.
c. times interest earned and debt to stockholders’ equity.
d. profit margin and free cash flow.
132. Return on common stockholders’ equity is most closely related to
a. gross profit rate and operating expenses to sales ratio.
b. profit margin and free cash flow.
c. times interest earned and debt to stockholders’ equity ratio.
d. return on asset and leverage (debt to assets ratio).
133. Long-term creditors are usually most interested in evaluating
a. liquidity.
b. marketability.
c. profitability.
d. solvency.
134. Which one of the following would be considered a long-term solvency ratio?
a. Accounts receivable turnover
b. Return on assets
c. Current cash debt coverage
d. Debt to assets ratio
Test Bank for Accounting: Tools for Business Decision Making, Fifth Edition
13–28
135. Stockholders are most interested in evaluating
a. liquidity.
b. solvency.
c. profitability.
d. marketability.
136. In ratio analysis, the ratios are never expressed as a
a. rate.
b. logarithm.
c. percentage.
d. simple proportion.
137. The current ratio is
a. calculated by dividing current liabilities by current assets.
b. used to evaluate a company’s liquidity and short-term debt paying ability.
c. used to evaluate a company’s solvency and long-term debt paying ability.
d. calculated by subtracting current liabilities from current assets.
138. The current ratio is a
a. liquidity ratio.
b. profitability ratio.
c. long-term solvency ratio.
d. cash flow ratio.
139. A company with $60,000 in current assets and $35,000 in current liabilities pays a $1,000
current liability. As a result of this transaction, the current ratio and working capital will
a. both decrease.
b. both increase.
c. increase and remain the same, respectively.
d. remain the same and decrease, respectively.
140. The accounts receivable turnover and inventory turnover are used to analyze
a. long-term solvency.
b. profitability.
c. liquidity.
d. leverage.
Financial Analysis: The Big Picture
13–29
141. Winsor Clothing Store had a balance in the Accounts Receivable account of $760,000 at
the beginning of the year and a balance of $840,000 at the end of the year. Net credit
sales during the year amounted to $6,800,000. The average collection period of the
accounts receivable in terms of days was
a. 30 days.
b. 365 days.
c. 45.1 days.
d. 42.9 days.
142. Bill’s Dollar Store had a balance in the Accounts Receivable account of $760,000 at the
beginning of the year and a balance of $840,000 at the end of the year. Net credit sales
during the year amounted to $6,880,000. The accounts receivable turnover was
a. 8.2 times.
b. 9.1 times.
c. 8.6 times.
d. 4.3 times.
143. A high accounts receivable turnover indicates
a. customers are making payments quickly.
b. a large portion of the company’s sales are on credit.
c. many customers are not paying their receivables.
d. the company’s sales have increased.
144. LKN Company had net credit sales of $4,290,000 and cost of goods sold of $3,000,000 for
the year. The Accounts Receivable balances at the beginning and end of the year were
$600,000 and $700,000, respectively. The accounts receivable turnover ratio was
a. 7.2 times.
b. 6.6 times.
c. 3.3 times.
d. 6.1 times.
145. Hickory Hills Pro Shop had a balance in the Accounts Receivable account of $800,000 at
the beginning of the year and a balance of $900,000 at the end of the year. Net credit
sales during the year amounted to $7,310,000. The accounts receivable turnover was
a. 8.6 times.
b. 8.3 times.
c. 8.2 times.
d. 8.9 times.
Test Bank for Accounting: Tools for Business Decision Making, Fifth Edition
13–30
146. Hickory Hills Pro Shop had a balance in the Accounts Receivable account of $800,000 at
the beginning of the year and a balance of $900,000 at the end of the year. Net credit
sales during the year amounted to $7,310,000. The average collection period of the
receivables in terms of days was
a. 44 days.
b. 42.4 days.
c. 365 days.
d. 41 days.
147. Somen to Park Corporation had net credit sales of $4,060,000 and cost of goods sold of
$3,000,000 for the year. The Accounts Receivable balances at the beginning and end of
the year were $650,000 and $750,000, respectively. The accounts receivable turnover was
a. 6.7 times.
b. 6.2 times.
c. 5.8 times.
d. 6.4 times.
148. Chodron Corporation had net credit sales of $13,000,000 and cost of goods sold of
$9,250,000 for the year. The average inventory for the year amounted to $2,500,000. The
inventory turnover for the year is
a. 3.7 times.
b. 5.3 times.
c. 3.1 times.
d. 1.4 times.
149. Chodron Corporation had net credit sales of $13,000,000 and cost of goods sold of
$9,250,000 for the year. The average inventory for the year amounted to $2,500,000. The
average days in inventory during the year was approximately
a. 260 days.
b. 120 days.
c. 99 days.
d. 70 days.
Financial Analysis: The Big Picture
13–31
150. Savory Thymes, Inc. had net credit sales of $9,000,000 and cost of goods sold of
$5,250,000 for the year. The average inventory for the year amounted to $2,500,000. The
inventory turnover for the year is
a. 3.2 times.
b. 2.8 times.
c. 2.6 times.
d. 2.1 times.
151. Savory Thymes, Inc.had net credit sales of $9,000,000 and cost of goods sold of
$5,250,000 for the year. The average inventory for the year amounted to $2,500,000. The
average days in inventory during the year was approximately
a. 115 days.
b. 130 days.
c. 139 days.
d. 174 days.
152. Which one of the following would not be considered a liquidity ratio?
a. Current ratio
b. Inventory turnover
c. Current cash debt coverage
d. Return on assets
153. The asset turnover is
a. net sales divided by net income.
b. average total assets divided by net income.
c. net sales divided by average total assets.
d. average total assets divided by net sales.
154. The asset turnover measures
a. how often a company replaces its assets.
b. how efficiently a company uses its assets to generate sales.
c. the portion of the assets that have been financed by creditors.
d. the overall rate of return on assets.
Test Bank for Accounting: Tools for Business Decision Making, Fifth Edition
13–32
155. The profit margin is calculated by dividing
a. sales by cost of goods sold.
b. gross profit by net sales.
c. net income by stockholders’ equity.
d. net income by net sales.
156. Tito Corporation had net income of $2,000,000 and paid dividends to common
stockholders of $500,000 in 2014. The weighted average number of shares outstanding in
2014 was 500,000 shares. Tito Corporation’s common stock is selling for $50 per share on
the NASDAQ. Tito Corporation’s price-earnings ratio is
a. 3 times.
b. 10 times.
c. 12.5 times.
d. 4 times.
157. Tito Corporation had net income of $2,000,000 and paid dividends to common
stockholders of $500,000 in 2014. The weighted average number of shares outstanding in
2014 was 500,000 shares. Tito Corporation’s common stock is selling for $50 per share on
the NASDAQ. Tito Corporation’s payout ratio for 2014 is
a. $5 per share.
b. 20%.
c. 25%.
d. 10%.
158. BVI Corporation had net income of $1,600,000 and paid dividends to common
stockholders of $400,000 in 2014. The weighted average number of shares outstanding in
2014 was 500,000 shares. BVI Corporation’s common stock is selling for $50 per share on
the NASDAQ. BVI Corporation’s price-earnings ratio is
a. 3.2 times.
b. 15.6 times.
c. 10 times.
d. 5 times.
Financial Analysis: The Big Picture
13–33
159. BVI Corporation had net income of $1,600,000 and paid dividends to common
stockholders of $400,000 in 2014. The weighted average number of shares outstanding in
2014 was 500,000 shares. BVI Corporation’s common stock is selling for $50 per share on
the NASDAQ. BVI Corporation’s payout ratio for 2014 is
a. $5 per share.
b. 25%.
c. 20%.
d. 12.5%.
160. The debt to assets ratio measures
a. the company’s profitability.
b. whether interest can be paid on debt in the current year.
c. the proportion of interest paid relative to dividends paid.
d. the percentage of the total assets provided by creditors.
161. Aps Company reported the following on its income statement:
Income before income taxes $420,000
Income tax expense 120,000
Net income $300,000
An analysis of the income statement revealed that interest expense was $70,000. Aps
Company’s times interest earned was
a. 5.3 times.
b. 9 times.
c. 7 times.
d. 4.3 times.
162. Trading on the equity (leverage) refers to the
a. amount of working capital.
b. amount of capital provided by owners.
c. use of borrowed money to increase the return to owners.
d. number of times interest is earned.
Test Bank for Accounting: Tools for Business Decision Making, Fifth Edition
13–34
163. Rama Company reported the following on its income statement:
Income before income taxes $500,000
Income tax expense 150,000
Net income $350,000
An analysis of the income statement revealed that interest expense was $60,000. Rama
Company’s times interest earned was
a. 6.8 times.
b. 9.3 times.
c. 8.3 times.
d. 5.8 times.
164. A company that is leveraged is one that
a. has a high earnings per share.
b. contains debt financing.
c. contains equity financing.
d. has a high current ratio.
165. The current assets of Orangette Company are $227,500. The current liabilities are
$130,000. The current ratio expressed as a proportion is
a. 175%.
b. 1.75:1.
c. .57:1.
d. $210,000 ÷ $120,000.
166. A weakness of the current ratio is
a. the difficulty of the calculation.
b. it uses year-end balances of current asset and current liability accounts.
c. it is rarely used by sophisticated analysts.
d. it can be expressed as a percentage, as a rate, or as a proportion.
167. A supplier to a company would be most interested in the
a. asset turnover.
b. profit margin.
c. current ratio.
d. earnings per share.
Financial Analysis: The Big Picture
13–35
168. Which one of the following ratios would not likely be used by a short-term creditor in
evaluating whether to sell on credit to a company?
a. Current ratio
b. Inventory turnover
c. Asset turnover
d. Accounts receivables turnover
169. Ratios are used as tools in financial analysis
a. instead of horizontal and vertical analyses.
b. because they can provide information that may not be apparent from inspection of the
individual components of the financial statements.
c. because even single ratios by themselves are quite meaningful.
d. because they are prescribed by GAAP.
170. The ratios that are used to determine a company’s short-term debt paying ability are
a. asset turnover, times interest earned, current ratio, and accounts receivables turnover.
b. times interest earned, inventory turnover, current ratio, and receivables turnover.
c. times interest earned, accounts receivable turnover ratio, current ratio, and inventory
turnover.
d. current ratio, current debt coverage, receivable turnover, and inventory turnover.
171. Ed’s Drive-In $175,000 of current assets and $80,000 of current liabilities before borrowing
$60,000 from the bank with a 3-month note payable. What effect did the borrowing
transaction have on Ed’s Drive-In’s current ratio?
a. The ratio remained unchanged.
b. The change in the current ratio cannot be determined.
c. The ratio decreased.
d. The ratio increased.
172. A liquidity ratio measures the
a. income or operating success of an enterprise over a period of time.
b. ability of the enterprise to survive over a long period of time.
c. short-term ability of the enterprise to pay its maturing obligations and to meet
unexpected needs for cash.
d. number of times interest is earned.
Test Bank for Accounting: Tools for Business Decision Making, Fifth Edition
13–36
173. If equal amounts are added to the numerator and the denominator of the current ratio and
the ratio is over one, the ratio will always
a. increase.
b. decrease.
c. stay the same.
d. equal zero.
174. If a company has a current ratio of 1.2:1, what respective effects will the borrowing of cash
by short-term debt and collection of accounts receivable have on the ratio?
Short-term Borrowing Collection of Receivable
a. Increase No effect
b. Increase Increase
c. Decrease No effect
d. Decrease Decrease
175. A company has an accounts receivable turnover ratio of 10. The average net accounts
receivable during the period are $700,000. What is the amount of net credit sales for the
period?
a. $70,000
b. $7,000,000
c. $700,000
d. $770,000
176. If the average collection period is 52 days, what is the accounts receivable turnover?
a. 7.0 times
b. 14.2 times
c. 14.0 times
d. 5.2 times
177. A general rule to use in assessing the average collection period is that it
a. should not exceed 30 days.
b. can be any length as long as the customer continues to buy merchandise.
c. should not greatly exceed the return period.
d. should not greatly exceed the credit term period.
Financial Analysis: The Big Picture
FOR INSTRUCTOR USE ONLY
13–37
178. The inventory turnover is calculated by dividing
a. cost of goods sold by the ending inventory.
b. cost of goods sold by the beginning inventory.
c. cost of goods sold by the average inventory.
d. average inventory by cost of goods sold.
179. A company has an average inventory on hand of $75,000 and its average days in
inventory is 36.5 days. What is the cost of goods sold?
a. $750,000
b. $1,752,000
c. $1,680,000
d. $876,000
180. A successful grocery store would probably have
a. a low inventory turnover.
b. a high inventory turnover.
c. zero profit margin.
d. low volume.
181. Net sales are $2,400,000, beginning total assets are $700,000, and the asset turnover is
3.0. What is the ending total asset balance?
a. $800,000
b. $900,000
c. $700,000
d. $750,000
182. The following information pertains to Unique Company. Assume that all balance sheet
amounts represent both average and ending balance figures. Assume that all sales were
on credit.
Assets
Cash and short-term investments $ 40,000
Accounts receivable (net) 30,000
Inventory 20,000
Property, plant and equipment 210,000
Total Assets $300,000
Liabilities and Stockholders’ Equity
Current liabilities $ 60,000
Long-term liabilities 90,000
Stockholders’ equity—common 150,000
Test Bank for Accounting: Tools for Business Decision Making, Fifth Edition
FOR INSTRUCTOR USE ONLY
13–38
182. (Cont.)
Total Liabilities and Stockholders’ Equity $300,000
Income Statement
Sales revenue $ 90,000
Cost of goods sold 45,000
Gross profit 45,000
Operating expenses 20,000
Net income $ 25,000
Number of shares of common stock 6,000
Market price of common stock $20
Dividends per share on common stock 0.90
Cash provided by operations $30,000
What is the current ratio for this company?
a. 1.5
b. 1.0
c. 1.17
d. 0.67
183. The following information pertains to Unique Company. Assume that all balance sheet
amounts represent both average and ending balance figures. Assume that all sales were
on credit.
Assets
Cash and short-term investments $ 40,000
Accounts receivable (net) 30,000
Inventory 20,000
Property, plant and equipment 210,000
Total Assets $300,000
Liabilities and Stockholders’ Equity
Current liabilities $ 60,000
Long-term liabilities 90,000
Stockholders’ equity—common 150,000
Total Liabilities and Stockholders’ Equity $300,000
Financial Analysis: The Big Picture
FOR INSTRUCTOR USE ONLY
13–39
183. (Cont.) Income Statement
Sales revenue $ 90,000
Cost of goods sold 45,000
Gross margin 45,000
Operating expenses 20,000
Net income $ 25,000
Number of shares of common stock 6,000
Market price of common stock $20
Dividends per share on common stock 0.90
Cash provided by operations $30,000
What is the accounts receivable turnover for this company?
a. 1.5 times
b. 2 times
c. 3.0 times
d. 6 times
184. The following information pertains to Unique Company. Assume that all balance sheet
amounts represent both average and ending balance figures. Assume that all sales were
on credit.
Assets
Cash and short-term investments $ 40,000
Accounts receivable (net) 30,000
Inventory 20,000
Property, plant and equipment 210,000
Total Assets $300,000
Liabilities and Stockholders’ Equity
Current liabilities $ 60,000
Long-term liabilities 90,000
Stockholders’ equity—common 150,000
Total Liabilities and Stockholders’ Equity $300,000
Income Statement
Sales revenue $ 90,000
Cost of goods sold 45,000
Gross margin 45,000
Operating expenses 20,000
Net income $ 25,000
Number of shares of common stock 6,000
Market price of common stock $20
Dividends per share on common stock 0.90
Cash provided by operations $30,000
Test Bank for Accounting: Tools for Business Decision Making, Fifth Edition
13–40
184. (Cont.)
What is the inventory turnover for this company?
a. 2 times
b. 2.25 times
c. 1 time
d. .44 times
185. The following information pertains to Unique Company. Assume that all balance sheet
amounts represent both average and ending balance figures. Assume that all sales were
on credit.
Assets
Cash and short-term investments $ 40,000
Accounts receivable (net) 30,000
Inventory 20,000
Property, plant and equipment 210,000
Total Assets $300,000
Liabilities and Stockholders’ Equity
Current liabilities $ 60,000
Long-term liabilities 90,000
Stockholders’ equity—common 150,000
Total Liabilities and Stockholders’ Equity $300,000
Income Statement
Sales revenue $ 90,000
Cost of goods sold 45,000
Gross margin 45,000
Operating expenses 20,000
Net income $ 25,000
Number of shares of common stock 6,000
Market price of common stock $20
Dividends per share on common stock 0.90
Cash provided by operations $30,000
What is the return on assets for this company?
a. 8.3%
b. 10.0%
c. 11.9%
d. 16.7%
Financial Analysis: The Big Picture
FOR INSTRUCTOR USE ONLY
13–41
186. The following information pertains to Unique Company. Assume that all balance sheet
amounts represent both average and ending balance figures. Assume that all sales were
on credit.
Assets
Cash and short-term investments $ 40,000
Accounts receivable (net) 30,000
Inventory 20,000
Property, plant and equipment 210,000
Total Assets $300,000
Liabilities and Stockholders’ Equity
Current liabilities $ 60,000
Long-term liabilities 90,000
Stockholders’ equity—common 150,000
Total Liabilities and Stockholders’ Equity $300,000
Income Statement
Sales revenue $ 90,000
Cost of goods sold 45,000
Gross margin 45,000
Operating expenses 20,000
Net income $ 25,000
Number of shares of common stock 6,000
Market price of common stock $20
Dividends per share on common stock 0.90
Cash provided by operations $30,000
What is the profit margin for this company?
a. 55.6%
b. 33.3%
c. 27.8%
d. 8.3%
187. The following information pertains to Unique Company. Assume that all balance sheet
amounts represent both average and ending balance figures. Assume that all sales were
on credit.
Assets
Cash and short-term investments $ 40,000
Accounts receivable (net) 30,000
Inventory 20,000
Property, plant and equipment 210,000
Total Assets $300,000
Liabilities and Stockholders’ Equity
Current liabilities $ 60,000
Long-term liabilities 90,000
Stockholders’ equity—common 150,000
Total Liabilities and Stockholders’ Equity $300,000
Test Bank for Accounting: Tools for Business Decision Making, Fifth Edition
FOR INSTRUCTOR USE ONLY
13–42
187. (Cont.) Income Statement
Sales revenue $ 90,000
Cost of goods sold 45,000
Gross margin 45,000
Operating expenses 20,000
Net income $ 25,000
Number of shares of common stock 6,000
Market price of common stock $20
Dividends per share on common stock 0.90
Cash provided by operations $30,000
What is the return on common stockholders’ equity for this company?
a. 16.7%
b. 20.0%
c. 33.3%
d. 40.0%
188. The following information pertains to Unique Company. Assume that all balance sheet
amounts represent both average and ending balance figures. Assume that all sales were
on credit.
Assets
Cash and short-term investments $ 40,000
Accounts receivable (net) 30,000
Inventory 20,000
Property, plant and equipment 210,000
Total Assets $300,000
Liabilities and Stockholders’ Equity
Current liabilities $ 60,000
Long-term liabilities 90,000
Stockholders’ equity—common 150,000
Total Liabilities and Stockholders’ Equity $300,000
Income Statement
Sales revenue $ 90,000
Cost of goods sold 45,000
Gross margin 45,000
Operating expenses 20,000
Net income $ 25,000
Number of shares of common stock 6,000
Market price of common stock $20
Dividends per share on common stock 0.90
Cash provided by operations $30,000
Financial Analysis: The Big Picture
13–43
188. (Cont.)
What is the price earnings ratio for this company?
a. 4.8 times
b. 2.0 times
c. 6.4 times
d. 3.2 times
189. The following information pertains to Unique Company. Assume that all balance sheet
amounts represent both average and ending balance figures. Assume that all sales were
on credit.
Assets
Cash and short-term investments $ 40,000
Accounts receivable (net) 30,000
Inventory 20,000
Property, plant and equipment 210,000
Total Assets $300,000
Liabilities and Stockholders’ Equity
Current liabilities $ 60,000
Long-term liabilities 90,000
Stockholders’ equity—common 150,000
Total Liabilities and Stockholders’ Equity $300,000
Income Statement
Sales revenue $ 90,000
Cost of goods sold 45,000
Gross margin 45,000
Operating expenses 20,000
Net income $ 25,000
Number of shares of common stock 6,000
Market price of common stock $20
Dividends per share on common stock 0.90
Cash provided by operations $30,000
What is the current cash debt coverage for this company?
a. 0.5 times
b. 3 times
c. 0.33 times
d. 0.14 times
Test Bank for Accounting: Tools for Business Decision Making, Fifth Edition
13–44
190. Junebag Corporation reported net income $36,000; net sales $400,000; and average
assets $600,000 for 2014. What is the 2014 profit margin?
a. 9%
b. 11%
c. 60%
d. 67%
191. The following information pertains to Blue Flower Company. Assume that all balance sheet
amounts represent both average and ending balance figures. Assume that all sales were
on credit.
Assets
Cash and short-term investments $ 45,000
Accounts receivable (net) 30,000
Inventory 15,000
Property, plant and equipment 210,000
Total Assets $300,000
Liabilities and Stockholders’ Equity
Current liabilities $ 60,000
Long-term liabilities 90,000
Stockholders’ equity—common 15,000
Total Liabilities and Stockholders’ Equity $300,000
Income Statement
Sales revenue $ 121,000
Cost of goods sold 66,000
Gross margin 55,000
Operating expenses 30,000
Net income $ 25,000
Number of shares of common stock 6,000
Market price of common stock $20
Dividends per share on common stock .50
Cash provided by operations $40,000
What is the current ratio for this company?
a. 1.00
b. 1.25
c. 1.50
d. 0.67

Financial Analysis: The Big Picture
FOR INSTRUCTOR USE ONLY
13–45
192. The following information pertains to Blue Flower Company. Assume that all balance sheet
amounts represent both average and ending balance figures. Assume that all sales were
on credit.
Assets
Cash and short-term investments $ 45,000
Accounts receivable (net) 30,000
Inventory 15,000
Property, plant and equipment 210,000
Total Assets $300,000
Liabilities and Stockholders’ Equity
Current liabilities $ 60,000
Long-term liabilities 90,000
Stockholders’ equity—common 150,000
Total Liabilities and Stockholders’ Equity $300,000
Income Statement
Sales revenue $ 121,000
Cost of goods sold 66,000
Gross margin 55,000
Operating expenses 30,000
Net income $ 25,000
Number of shares of common stock 6,000
Market price of common stock $20
Dividends per share on common stock .50
Cash provided by operations $40,000
What is the accounts receivable turnover for this company?
a. 2.2 times
b. 4.4 times
c. 8.1 times
d. 4.0 times
193. The following information pertains to Blue Flower Company. Assume that all balance sheet
amounts represent both average and ending balance figures. Assume that all sales were
on credit.
Assets
Cash and short-term investments $ 45,000
Accounts receivable (net) 30,000
Inventory 15,000
Property, plant and equipment 210,000
Total Assets $300,000
Liabilities and Stockholders’ Equity
Current liabilities $ 60,000
Long-term liabilities 90,000
Stockholders’ equity—common 150,000
Total Liabilities and Stockholders’ Equity $300,000
Test Bank for Accounting: Tools for Business Decision Making, Fifth Edition
FOR INSTRUCTOR USE ONLY
13–46
193. (Cont.) Income Statement
Sales revenue $ 121,000
Cost of goods sold 66,000
Gross margin 55,000
Operating expenses 30,000
Net income $ 25,000
Number of shares of common stock 6,000
Market price of common stock $20
Dividends per share on common stock .50
Cash provided by operations $40,000
What is the inventory turnover for this company?
a. 4.4 times
b. 8.1 times
c. 8.8 times
d. 0.23 time
194. The following information pertains to Blue Flower Company. Assume that all balance sheet
amounts represent both average and ending balance figures. Assume that all sales were
on credit.
Assets
Cash and short-term investments $ 45,000
Accounts receivable (net) 30,000
Inventory 15,000
Property, plant and equipment 210,000
Total Assets $300,000
Liabilities and Stockholders’ Equity
Current liabilities $ 60,000
Long-term liabilities 90,000
Stockholders’ equity—common 150,000
Total Liabilities and Stockholders’ Equity $300,000
Income Statement
Sales revenue $ 121,000
Cost of goods sold 66,000
Gross margin 55,000
Operating expenses 30,000
Net income $ 25,000
Number of shares of common stock 6,000
Market price of common stock $20
Dividends per share on common stock .50
Cash provided by operations $40,000
Financial Analysis: The Big Picture
13–47
194. (Cont.)
What is the return on assets for this company?
a. 18.3%
b. 13.3%
c. 8.3%
d. 16.7%
195. The following information pertains to Blue Flower Company. Assume that all balance sheet
amounts represent both average and ending balance figures. Assume that all sales were
on credit.
Assets
Cash and short-term investments $ 45,000
Accounts receivable (net) 30,000
Inventory 15,000
Property, plant and equipment 210,000
Total Assets $300,000
Liabilities and Stockholders’ Equity
Current liabilities $ 60,000
Long-term liabilities 90,000
Stockholders’ equity—common 150,000
Total Liabilities and Stockholders’ Equity $300,000
Income Statement
Sales revenue $ 121,000
Cost of goods sold 66,000
Gross margin 55,000
Operating expenses 30,000
Net income $ 25,000
Number of shares of common stock 6,000
Market price of common stock $20
Dividends per share on common stock .50
Cash provided by operations $40,000
What is the profit margin for this company?
a. 41.3%
b. 45.5%
c. 33.1%
d. 20.7%
Test Bank for Accounting: Tools for Business Decision Making, Fifth Edition
FOR INSTRUCTOR USE ONLY
13–48
196. The following information pertains to Blue Flower Company. Assume that all balance sheet
amounts represent both average and ending balance figures. Assume that all sales were
on credit.
Assets
Cash and short-term investments $ 45,000
Accounts receivable (net) 30,000
Inventory 15,000
Property, plant and equipment 210,000
Total Assets $300,000
Liabilities and Stockholders’ Equity
Current liabilities $ 60,000
Long-term liabilities 90,000
Stockholders’ equity—common 150,000
Total Liabilities and Stockholders’ Equity $300,000
Income Statement
Sales revenue $ 121,000
Cost of goods sold 66,000
Gross margin 55,000
Operating expenses 30,000
Net income $ 25,000
Number of shares of common stock 6,000
Market price of common stock $20
Dividends per share on common stock .50
Cash provided by operations $40,000
What is the return on common stockholders’ equity for this company?
a. 33.3%
b. 16.7%
c. 26.7%
d. 36.7%
197. The following information pertains to Blue Flower Company. Assume that all balance sheet
amounts represent both average and ending balance figures. Assume that all sales were
on credit.
Assets
Cash and short-term investments $ 45,000
Accounts receivable (net) 30,000
Inventory 15,000
Property, plant and equipment 210,000
Total Assets $300,000
Liabilities and Stockholders’ Equity
Current liabilities $ 60,000
Long-term liabilities 90,000
Stockholders’ equity—common 150,000
Total Liabilities and Stockholders’ Equity $300,000

Financial Analysis: The Big Picture
FOR INSTRUCTOR USE ONLY
13–49
197. (Cont.)
Income Statement
Sales revenue $ 121,000
Cost of goods sold 66,000
Gross margin 55,000
Operating expenses 30,000
Net income $ 25,000
Number of shares of common stock 6,000
Market price of common stock $20
Dividends per share on common stock .50
Cash provided by operations $40,000
What is the price earnings ratio for this company?
a. 1.9 times
b. 2.7 times
c. 3.8 times
d. 4.8 times
198. The following information pertains to Blue Flower Company. Assume that all balance sheet
amounts represent both average and ending balance figures. Assume that all sales were
on credit.
Assets
Cash and short-term investments $ 45,000
Accounts receivable (net) 30,000
Inventory 15,000
Property, plant and equipment 210,000
Total Assets $300,000
Liabilities and Stockholders’ Equity
Current liabilities $ 60,000
Long-term liabilities 90,000
Stockholders’ equity—common 150,000
Total Liabilities and Stockholders’ Equity $300,000
Income Statement
Sales revenue $ 121,000
Cost of goods sold 66,000
Gross margin 55,000
Operating expenses 30,000
Net income $ 25,000
Number of shares of common stock 6,000
Market price of common stock $20
Dividends per share on common stock .50
Cash provided by operations $40,000
Test Bank for Accounting: Tools for Business Decision Making, Fifth Edition
FOR INSTRUCTOR USE ONLY
13–50
198. (Cont.)
What is the current cash debt coverage ratio for this company?
a. 0.67 times
b. 1.5 times
c. 0.27 times
d. 0.44 times
199. The following information is available for Patterson Company:
2014 2013
Accounts receivable $ 360,000 $ 340,000
Inventory 280,000 320,000
Net credit sales 3,000,000 2,600,000
Cost of goods sold 1,500,000 840,000
Net income 300,000 170,000
The accounts receivable turnover for 2014 is
a. 8.3 times.
b. 4.3 times.
c. 8.6 times.
d. 7.6 times.
200. The following information is available for Patterson Company:
2014 2013
Accounts receivable $ 360,000 $ 340,000
Inventory 280,000 320,000
Net credit sales 3,000,000 1,400,000
Cost of goods sold 1,500,000 840,000
Net income 300,000 170,000
The inventory turnover for 2014 is
a. 5.4 times.
b. 5.0 times.
c. 2.5 times.
d. 3.0 times.
201. The following amounts were taken from the financial statements of R.Dodd Company:
2014 2013
Current liabilities $1,280,000 $1,220,000
Long-term liabilities 1,800,000 1,600,000
Interest expense 100,000 50,000
Income tax expense 50,000 30,000
Net income 400,000 170,000
Net cash provided by operating activity 425,000 270,000
Financial Analysis: The Big Picture
13–51
201. (Cont.)
The times interest earned for 2014 is
a. 4.0 times.
b. 5.0 times.
c. 4.5 times.
d. 5.5 times.
202. The following amounts were taken from the financial statements of R.Dodd Company:
2014 2013
Current liabilities $1,280,000 $1,220,000
Long-term liabilities 1,800,000 1,600,000
Interest expense 100,000 50,000
Income tax expense 50,000 30,000
Net income 400,000 170,000
Net cash provided by operating activity 425,000 270,000
The cash debt coverage for 2014 is
a. 13.8%.
b. 33.2%.
c. 9.6%.
d. 23.6%.
203. The following amounts were taken from the financial statements of Ando Company:
2014 2013
Total assets $800,000 $1,000,000
Net sales 720,000 650,000
Gross profit 352,000 320,000
Net income 126,000 117,000
Weighted average number of
common shares outstanding 90,000 90,000
Market price of common stock $35 $39
The return on assets for 2014 is
a. 16%.
b. 14%.
c. 32%.
d. 28%.
Test Bank for Accounting: Tools for Business Decision Making, Fifth Edition
13–52
204. The following amounts were taken from the financial statements of Ando Company:
2014 2013
Total assets $800,000 $1,000,000
Net sales 720,000 650,000
Gross profit 352,000 320,000
Net income 144,000 117,000
Weighted average number of
common shares outstanding 90,000 90,000
Market price of common stock $35 $39
The profit margin ratio for 2014 is
a. 20.6%.
b. 21.0%.
c. 20%.
d. 40.9%.
205. The following amounts were taken from the financial statements of Ando Company:
2014 2013
Total assets $800,000 $1,000,000
Net sales 720,000 650,000
Gross profit 352,000 320,000
Net income 144,000 117,000
Weighted average number of
common shares outstanding 90,000 90,000
Market price of common stock $48 $39
The price-earnings ratio for 2014 is
a. 30 times.
b. 25 times.
c. 48 times.
d. 3 times.
206. Solvency is of most interest to
a. short-term creditors.
b. stockholders.
c. competitors.
d. long-term creditors.
207. The current ratio would be of most interest to
a. short-term creditors.
b. long-term creditors.
c. stockholders.
d. customers.
Financial Analysis: The Big Picture
13–53
208. Which measure(s) is(are) an evaluation of a company’s ability to pay current liabilities?
1. Current cash debt coverage ratio.
2. Current ratio.
a. 1 only.
b. 2 only.
c. Both 1 and 2.
d. Neither 1 nor 2.
209. Which measure(s) is(are) useful in evaluating the efficiency in managing inventories?
1. Inventory turnover
2. Days in inventory
a. 1 only.
b. 2 only.
c. Both 1 and 2.
d. Neither 1 nor 2.
210. Which of these is not a liquidity ratio?
a. Current ratio
b. Asset turnover
c. Inventory turnover
d. Accounts receivable turnover
211. Akers Corporation reported net income $48,000; net sales $480,000; and average assets
$800,000 for 2014. What is the 2014 profit margin?
a. 6%
b. 10%
c. 48%
d. 60%
212. Beta Corporation had net income of $325,000 and paid dividends to common stockholders
of $50,000 in 2014. The weighted average number of shares outstanding in 2014 was
50,000 shares. Beta Corporation’s common stock is selling for $45.50 per share on the
New York Stock Exchange. Beta Corporation‘s price-earnings ratio is
a. 14.0 times.
b. 7.0 times.
c. 6.1 times.
d. 8.3 times.
Test Bank for Accounting: Tools for Business Decision Making, Fifth Edition
13–54
213. Bertram Corporation had net income of $325,000 and paid dividends to common
stockholders of $50,000 in 2014. The weighted average number of shares outstanding in
2014 was 50,000 shares. Bertram Corporation’s common stock is selling for $45.50 per
share on the New York Stock Exchange. Bertram Corporation’s payout ratio for 2014 is
a. $6.5 per share.
b. 18%.
c. 15.4%.
d. 40%.
214. A successful discount retail store such as Kmart would probably have
a. a low inventory turnover.
b. a high inventory turnover.
c. zero profit margin.
d. low volume.
215. Net sales are $3,000,000, beginning total assets are $1,400,000, and the asset turnover is
2.5 times. What is the ending total asset balance?
a. $1,200,000
b. $1,000,000
c. $1,400,000
d. $1,600,000
216. All of the following are ways that a company’s current ratio would decrease except
a. purchasing inventory on account.
b. adding equal amounts to the numerator and denominator.
c. paying off one-third of its accounts payable.
d. paying cash for new equipment.
217. All of the following may be indicators of channel stuffing except
a. deep discounts to customers.
b. customers incentives for buying early.
c. an extremely good earnings period followed by several subsequent bad periods.
d. inventory levels that reflect seasonal demand levels.
Financial Analysis: The Big Picture
13–55
218. The use of alternative accounting methods
a. is not a problem in ratio analysis because the footnotes disclose the method used.
b. may be a problem in ratio analysis even if disclosed.
c. is not a problem in ratio analysis since eventually all methods will lead to the same
end.
d. is only a problem in ratio analysis with respect to inventory.
219. Which situation below might indicate a company has a low quality of earnings?
a. Revenue is recorded when recognized
b. Repair costs are capitalized and then depreciated.
c. The financial statements are prepared in accordance with generally accepted
accounting principles.
d. The same accounting principles are used each year.
220. Which of the following ratios may be used to measure a company’s quality of earnings?
a. Price-earnings ratio
b. Return on assets ratio
c. Current ratio
d. Times interest earned ratio
221. All of the following situtations below might indicate a company has a low quality of
earnings except
a. A lack of disclosure about guaranteed payments that were mentioned in the MD&A of
the annual report.
b. Maintenance costs are capitalized and then depreciated.
c. Revenue is recognized when earned.
d. Adoption of a different inventory method for each of the last three years.
Test Bank for Accounting: Tools for Business Decision Making, Fifth Edition
FOR INSTRUCTOR USE ONLY
13–56
Answers to Multiple Choice Questions
Financial Analysis: The Big Picture
FOR INSTRUCTOR USE ONLY
13–57
BRIEF EXERCISES
Be. 222
Listed below are some selected Items that may appear on a corporate income statement. Indicate
the order in which these items would appear on an income statement. (The first one should be
assigned the number “1”, the second “2,” etc.)
_____ Extraordinary item
_____ Income before income taxes
_____ Discontinued operations
_____ Net income
_____ Income from continuing operations
_____ Income tax expense
Be. 223
Indicate whether the following items would be reported as an ordinary or an extraordinary item in
Chemco Corporation’s income statement.
(a) Loss attributable to labor strike.
(b) Gain on sale of fixed assets.
(c) Loss from fire. Chemco is a chemical company.
(d) Loss from sale of marketable securities.
(e) Expropriation of property by a foreign government.
(f) Loss from tornado damage. Chemco Corporation is located in the Midwest’s tornado alley.
(g) Loss from government condemnation of property through newly enacted law.
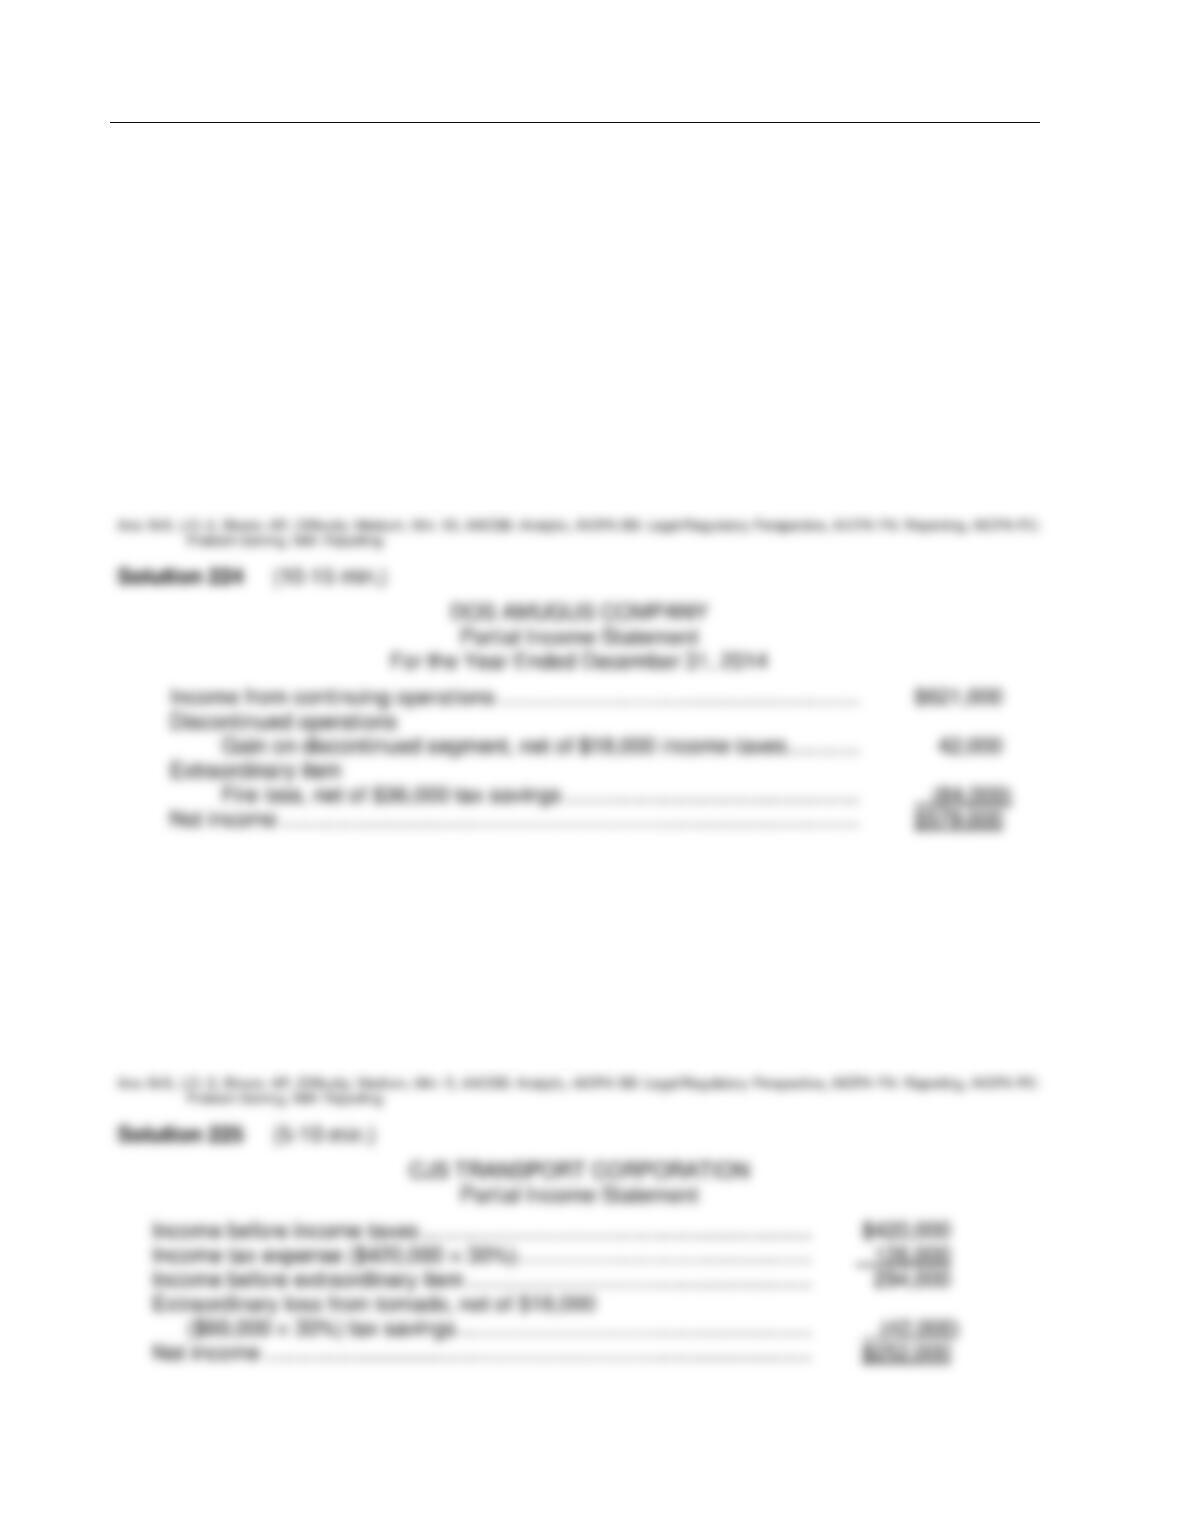
Test Bank for Accounting: Tools for Business Decision Making, Fifth Edition
FOR INSTRUCTOR USE ONLY
13–58
Be. 224
Dos Amugus Company has income from continuing operations of $621,000(after tax) for the year
ended December 31, 2014. It also has the following items (before considering income taxes):
(1) An extraordinary fire loss of $120,000.
(2) A gain of $60,000 on the discontinuance of a major component.
(3) A cumulative effect of a change in accounting principle that resulted in an increase in prior
years’ depreciation of $50,000.
Assume all items are subject to income taxes at a 30% tax rate.
Instructions
Prepare an income statement, beginning with income from continuing operations.
Be. 225
An inexperienced accountant for CJS Transport Corporation showed the following in CJS
Transport’s 2014 income statement: income before income taxes $420,000; Extraordinary loss
from tornado (before taxes) $60,000; and net income $132,000. The extraordinary loss and
taxable income are both subject to a 30% tax rate.
Instructions
Prepare a corrected income statement beginning with “Income before income taxes.”
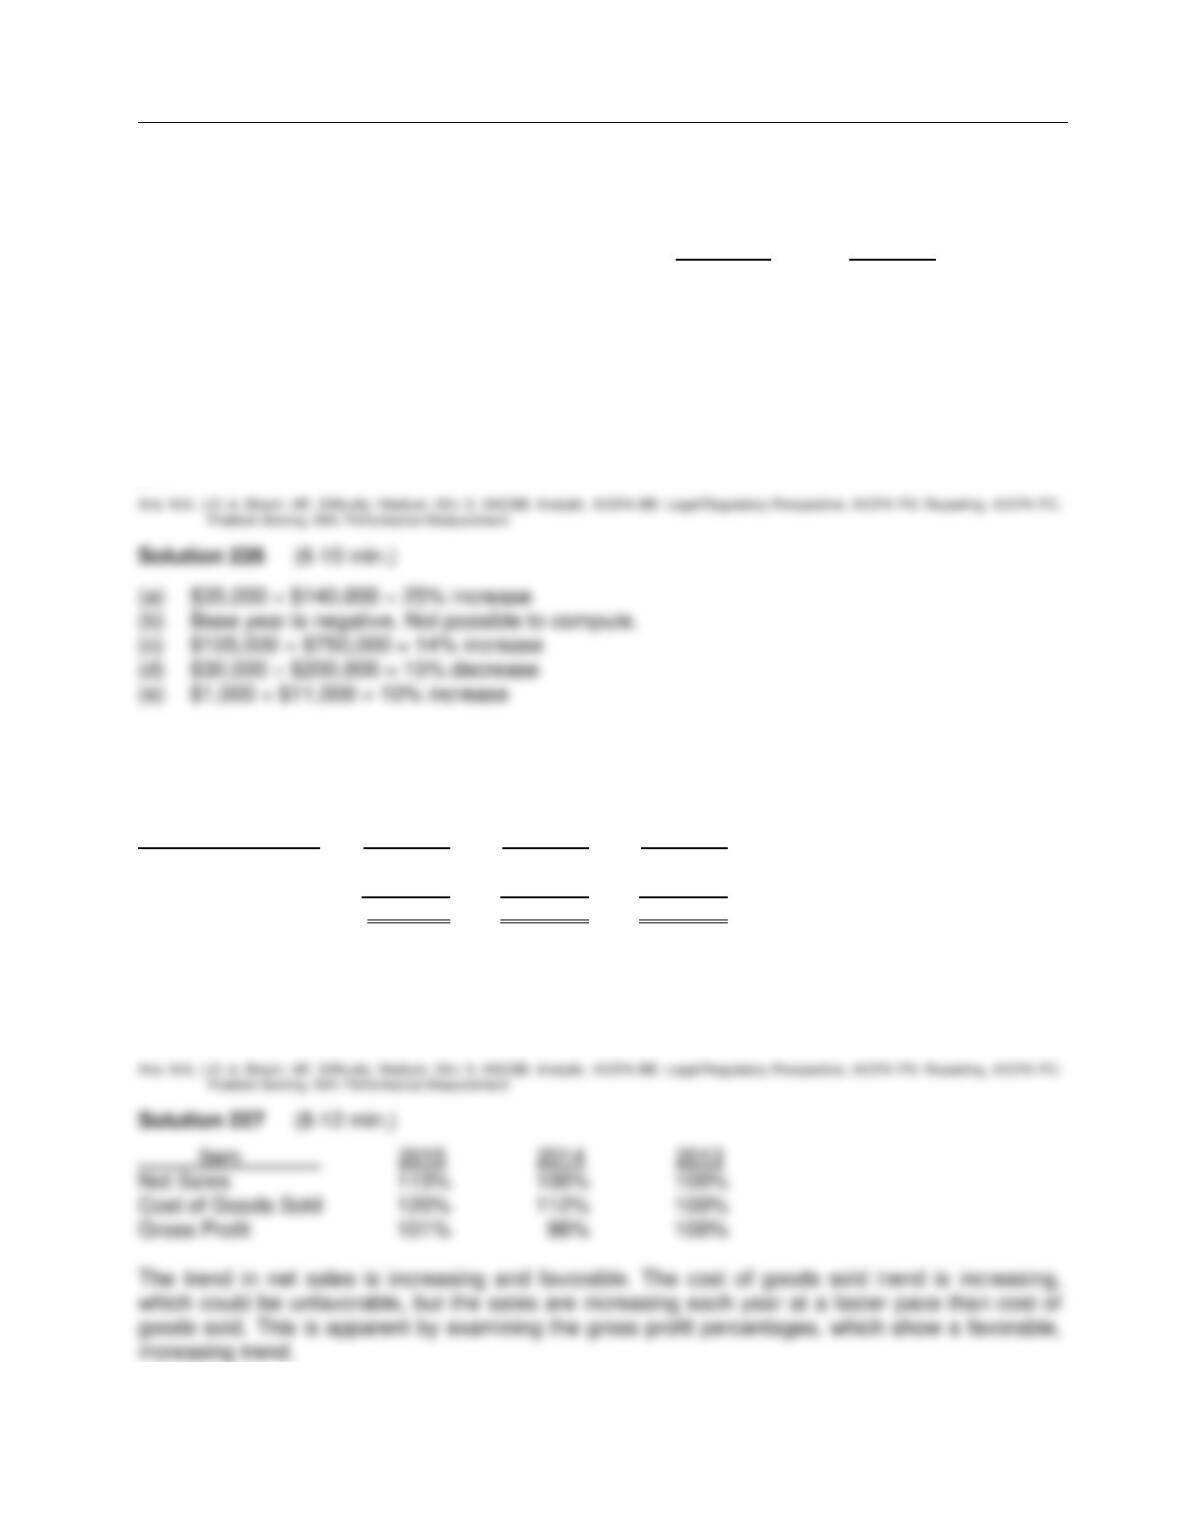
Financial Analysis: The Big Picture
FOR INSTRUCTOR USE ONLY
13–59
Be. 226
Comparative information taken from the Bergeron Company financial statements is shown below:
2014 2013
(a) Accounts receivable $ 175,000 $ 140,000
(b) Retained earnings 30,000 (14,000)
(c) Sales revenue 855,000 750,000
(d) Operating expenses 170,000 200,000
(e) Income taxes payable 11,000 10,000
Instructions
Using horizontal analysis, show the percentage change from 2013 to 2014 with 2013 as the base
year.
Be. 227
The following items were taken from the financial statements of Kramer Manufacturing, Inc., over
a three-year period:
Item 2015 2014 2013
Net Sales $226,000 $212,000 $200,000
Cost of Goods Sold 150,000 140,000 125,000
Gross Profit $ 76,000 $ 72,000 $ 75,000
Instructions
Using horizontal analysis and 2013 as the base year, compute the trend percentages for net
sales, cost of goods sold, and gross profit. Explain whether the trends are favorable or
unfavorable for each item.
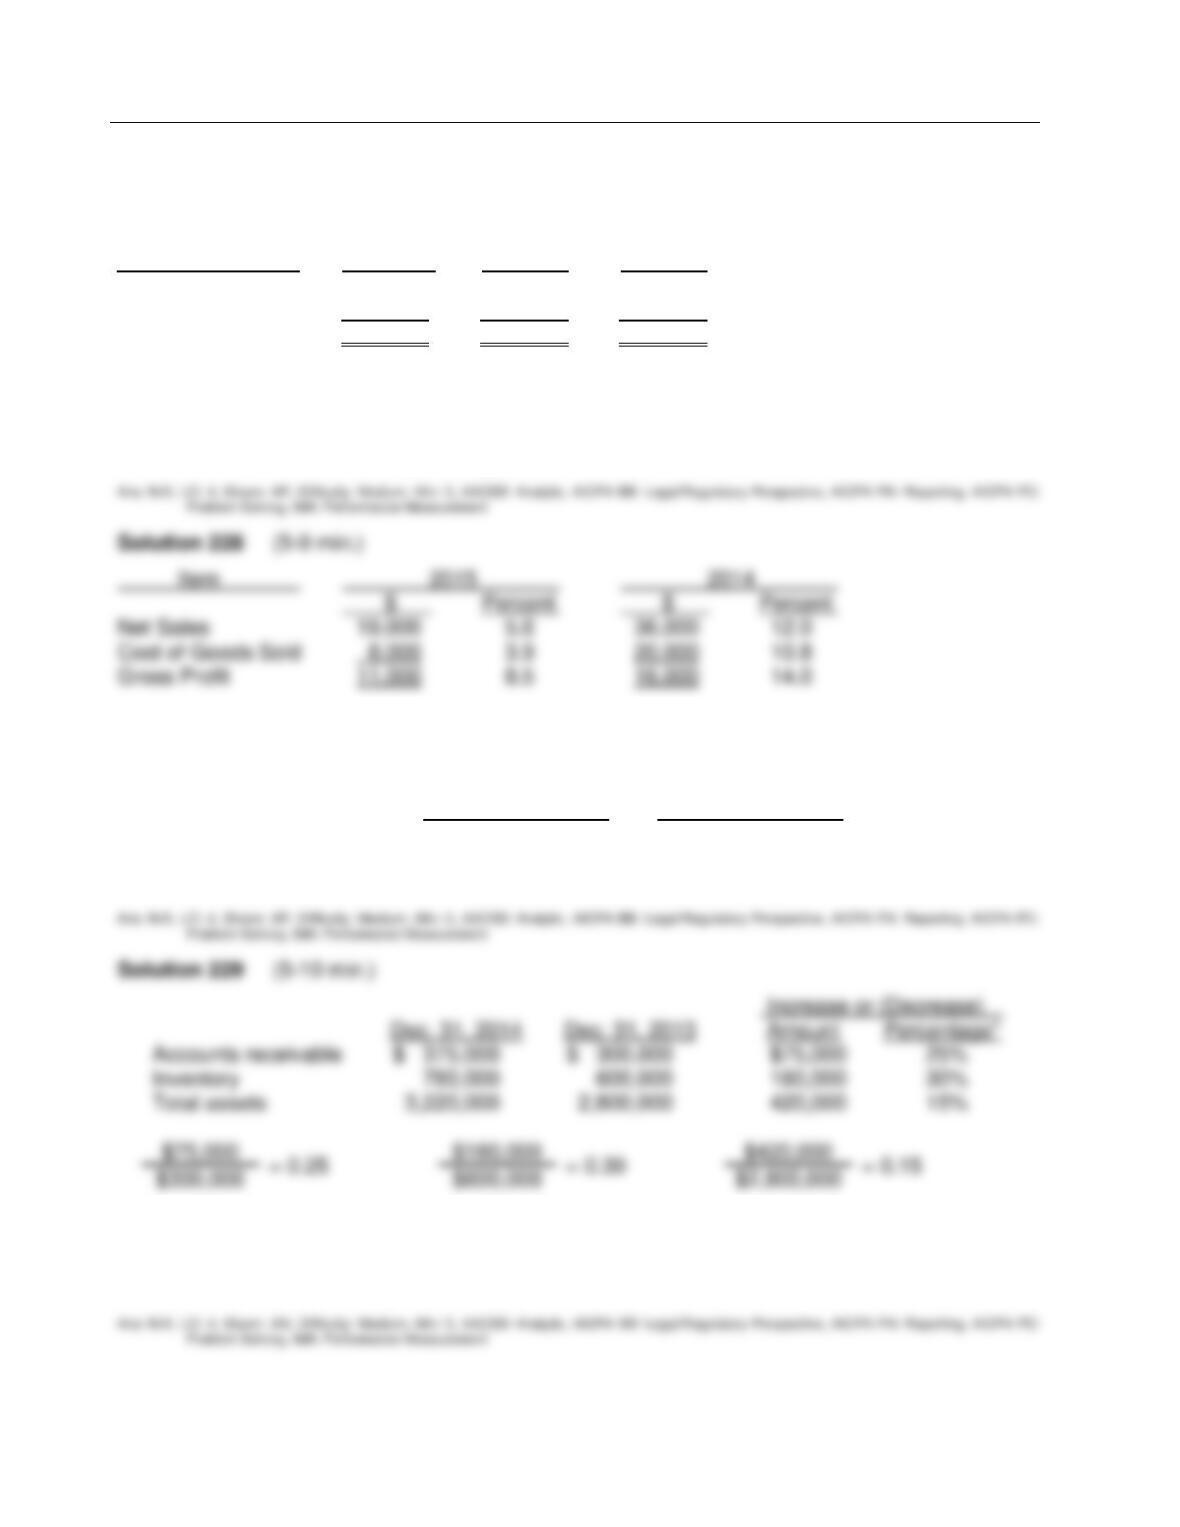
Test Bank for Accounting: Tools for Business Decision Making, Fifth Edition
FOR INSTRUCTOR USE ONLY
13–60
Be. 228
The following items were taken from the financial statements of Mint, Inc., over a three-year
period:
Item 2015 2014 2013
Net Sales $355,000 $336,000 $300,000
Cost of Goods Sold 214,000 206,000 186,000
Gross Profit $141,000 $130,000 $114,000
Instructions
Compute the following for each of the above time periods.
a. The amount and percentage change from 2013 to 2014.
b. The amount and percentage change from 2014 to 2015.
Be. 229
Using these data from the comparative balance sheet of Sunta Fe Spice Company, perform
horizontal analysis.
December 31, 2014 December 31, 2013
Accounts receivable $ 375,000 $ 300,000
Inventory 780,000 600,000
Total assets 3,220,000 2,800,000
Be. 230
If Hard in Parle Company had net income of $620,000 in 2014 and it experienced a 19% increase
in net income over 2013, what was its 2013 net income?
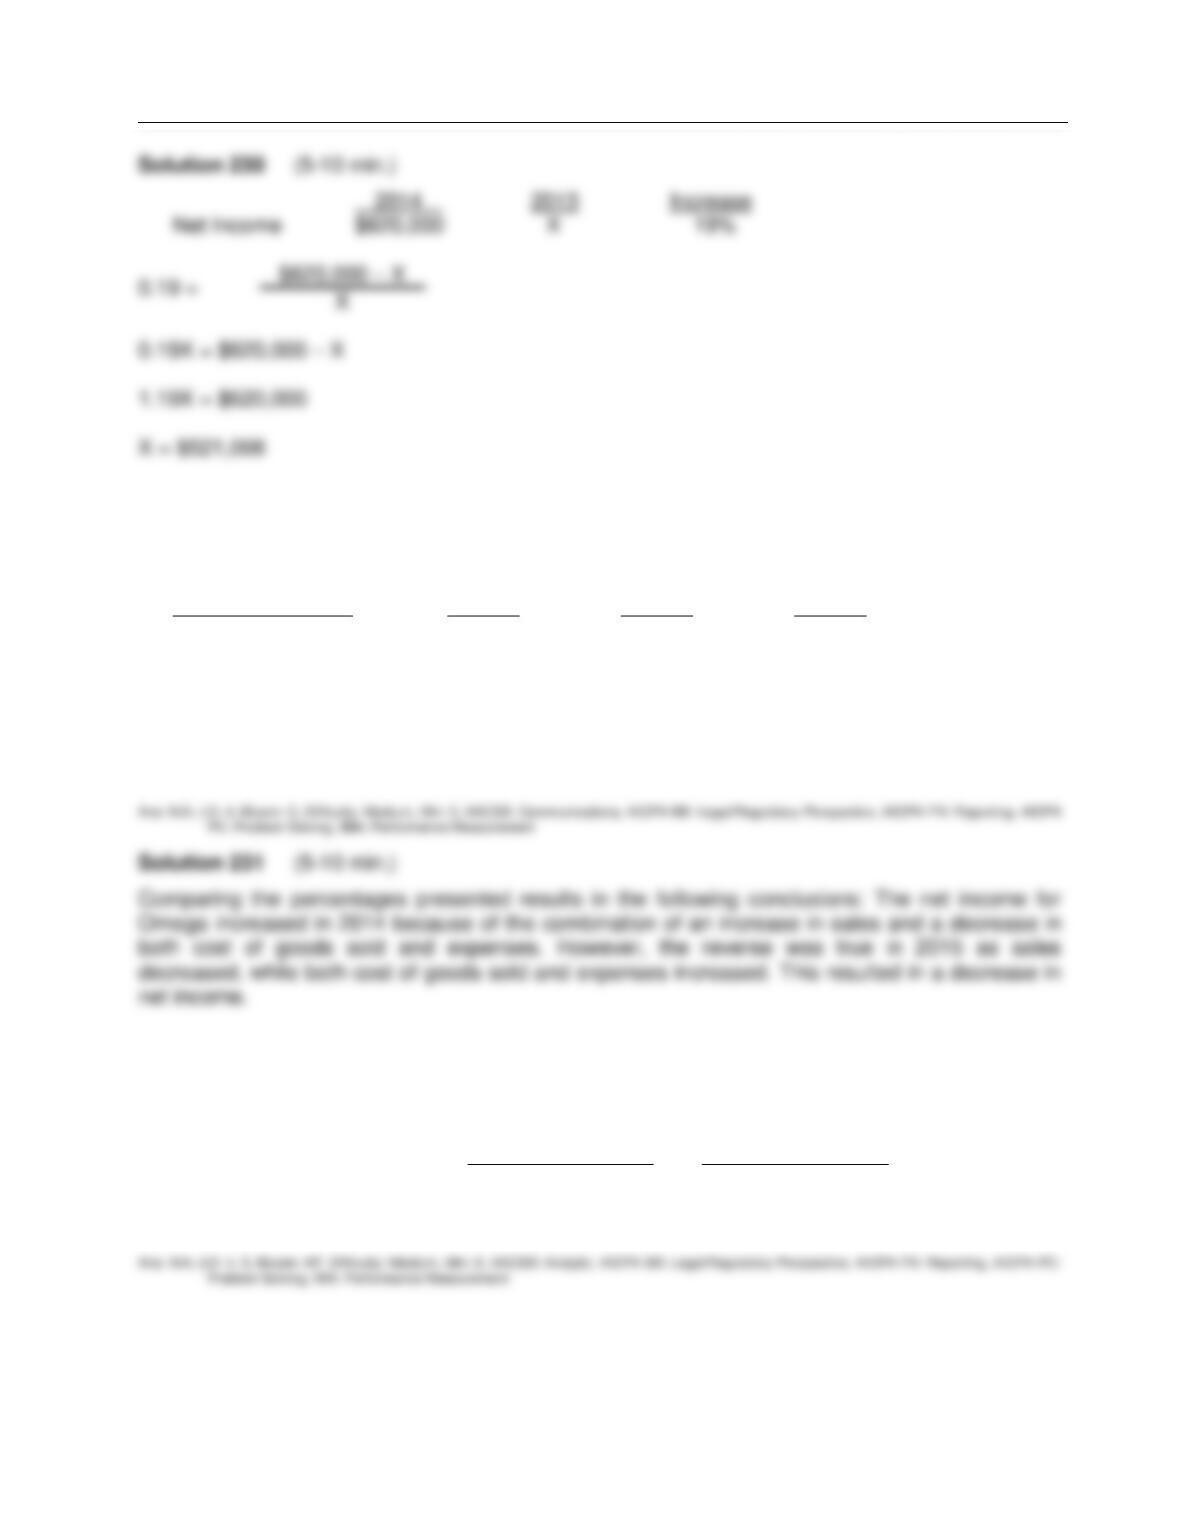
Financial Analysis: The Big Picture
FOR INSTRUCTOR USE ONLY
13–61
Be. 231
Horizontal analysis (trend analysis) percentages for Omega Company’s sales, cost of goods sold,
and expenses are listed here.
Horizontal Analysis 2015 2014 2013
Sales revenue 98.2% 104.8% 100.0%
Cost of goods sold 103.1 97.5 100.0
Expenses 108.6 96.4 100.0
Instructions
Explain whether Omega’s net income increased, decreased, or remained unchanged over the 3–
year period.
Be. 232
Using the following selected items from the comparative balance sheet of Kato Company, illustrate
horizontal and vertical analysis.
December 31, 2014 December 31, 2013
Accounts Receivable $ 720,000 $ 630,000
Inventory 450,000 360,000
Total Assets 3,200,000 3,000,000
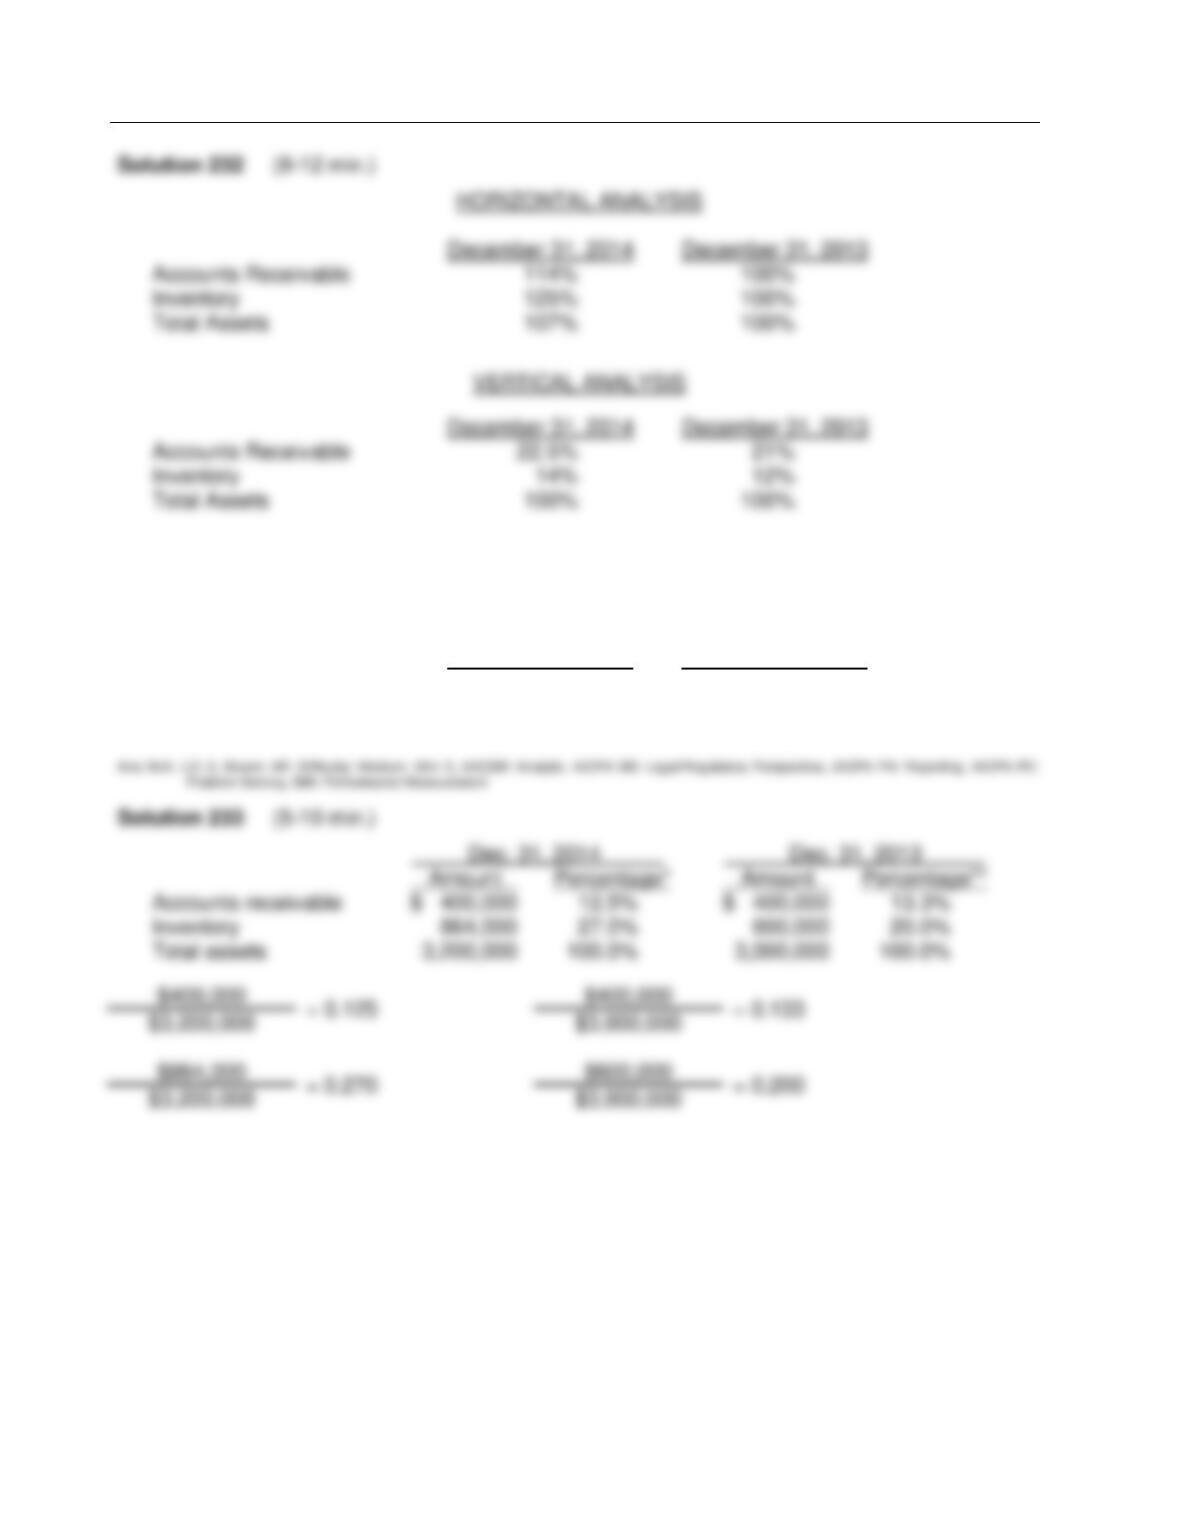
Test Bank for Accounting: Tools for Business Decision Making, Fifth Edition
FOR INSTRUCTOR USE ONLY
13–62
Be. 233
Using these data from the comparative balance sheet of K. Leen Company, perform vertical
analysis.
December 31, 2014 December 31, 2013
Accounts receivable $ 400,000 $ 400,000
Inventory 864,000 600,000
Total assets 3,200,000 3,000,000
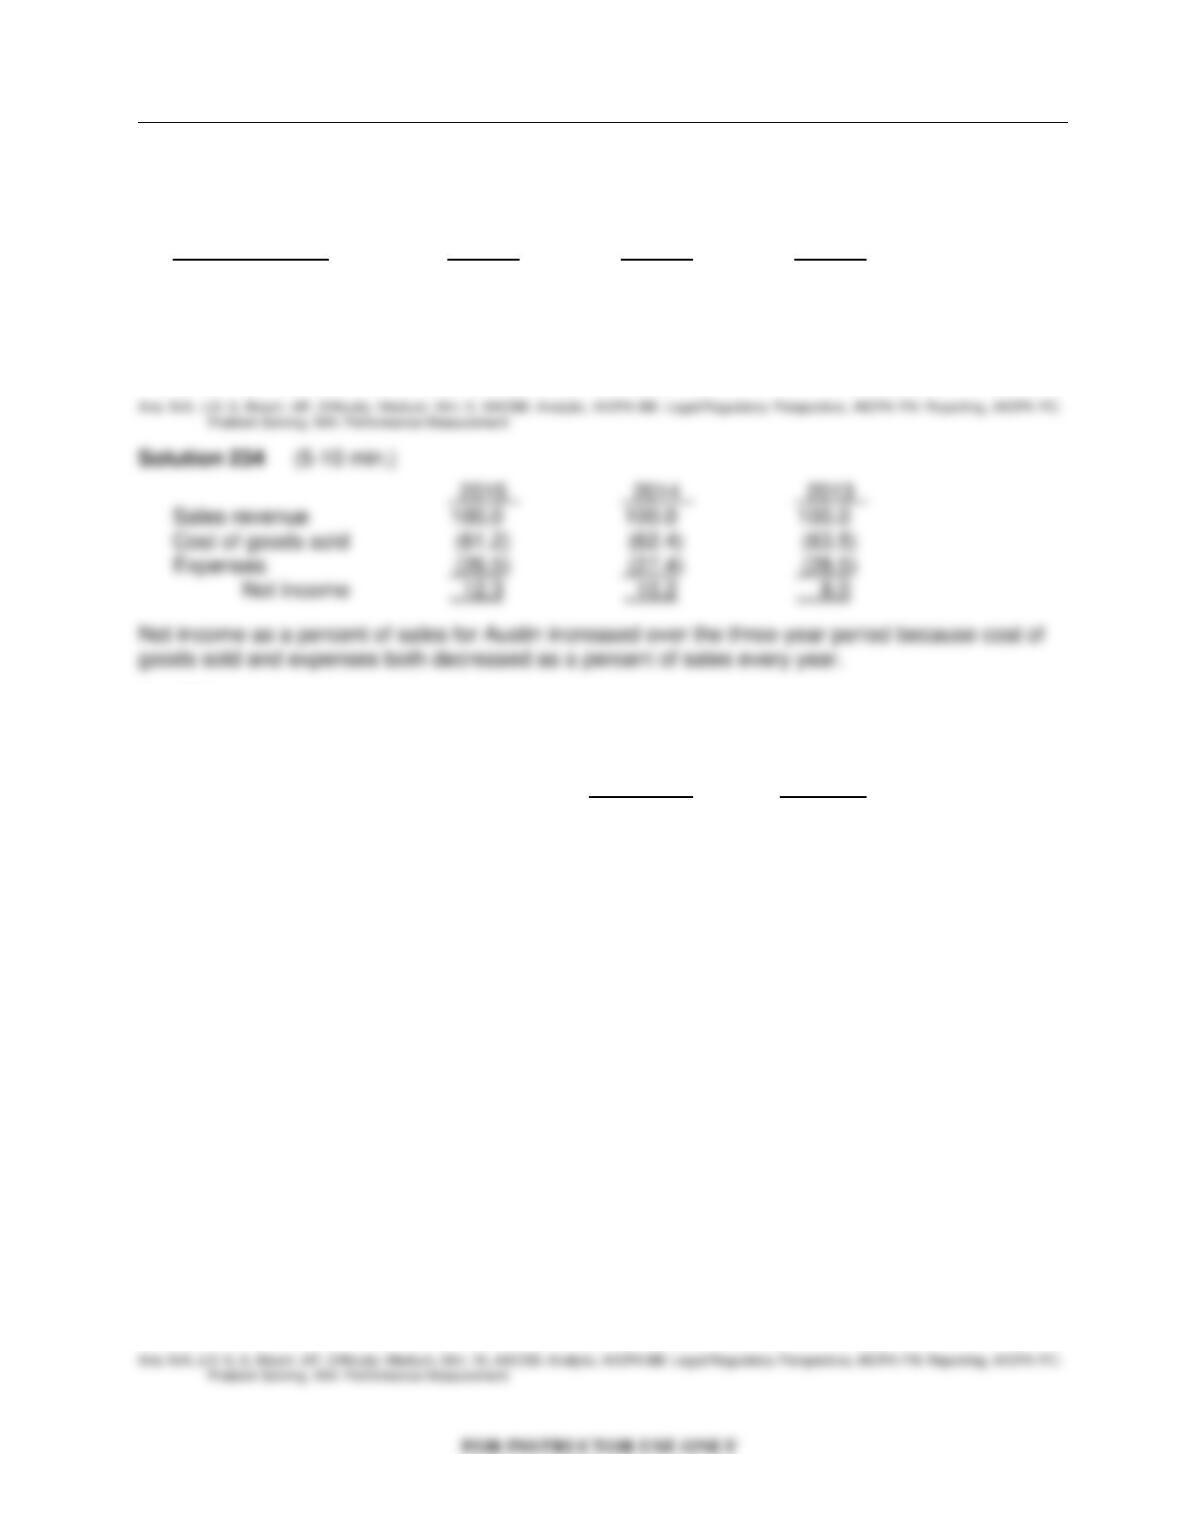
Financial Analysis: The Big Picture
13–63
Be. 234
Vertical analysis (common-size) percentages for Austin Company’s sales, cost of goods sold, and
expenses are listed here.
Vertical Analysis 2015 2014 2013
Sales revenue 100.0% 100.0% 100.0%
Cost of goods sold 61.2 62.4 63.5
Expenses 26.5 27.4 28.5
Did Austin Company’s net income as a percent of sales increase, decrease, or remain unchanged
over the 3-year period? Provide numerical support for your answer.
Be. 235
Selected information from the comparative financial statements of Barcelona Company for the
year ended December 31 appears below:
2014 2013
Accounts receivable (net) $ 175,000 $200,000
Inventory 130,000 170,000
Total assets 1,100,000 800,000
Current liabilities 140,000 110,000
Long-term debt 410,000 300,000
Net credit sales 900,000 700,000
Cost of goods sold 600,000 530,000
Interest expense 40,000 25,000
Income tax expense 60,000 29,000
Net income 120,000 85,000
Net cash provided by operating activities 250,000 135,000
Instructions
Answer the following questions relating to the year ended December 31, 2014. Show
computations.
1. The inventory turnover for 2014 is __________.
2. The number of times interest earned in 2014 is __________.
3. The accounts receivable turnover for 2014 is __________.
4. The return on assets for 2014 is __________.
5. The current cash debt coverage for 2014 is __________.
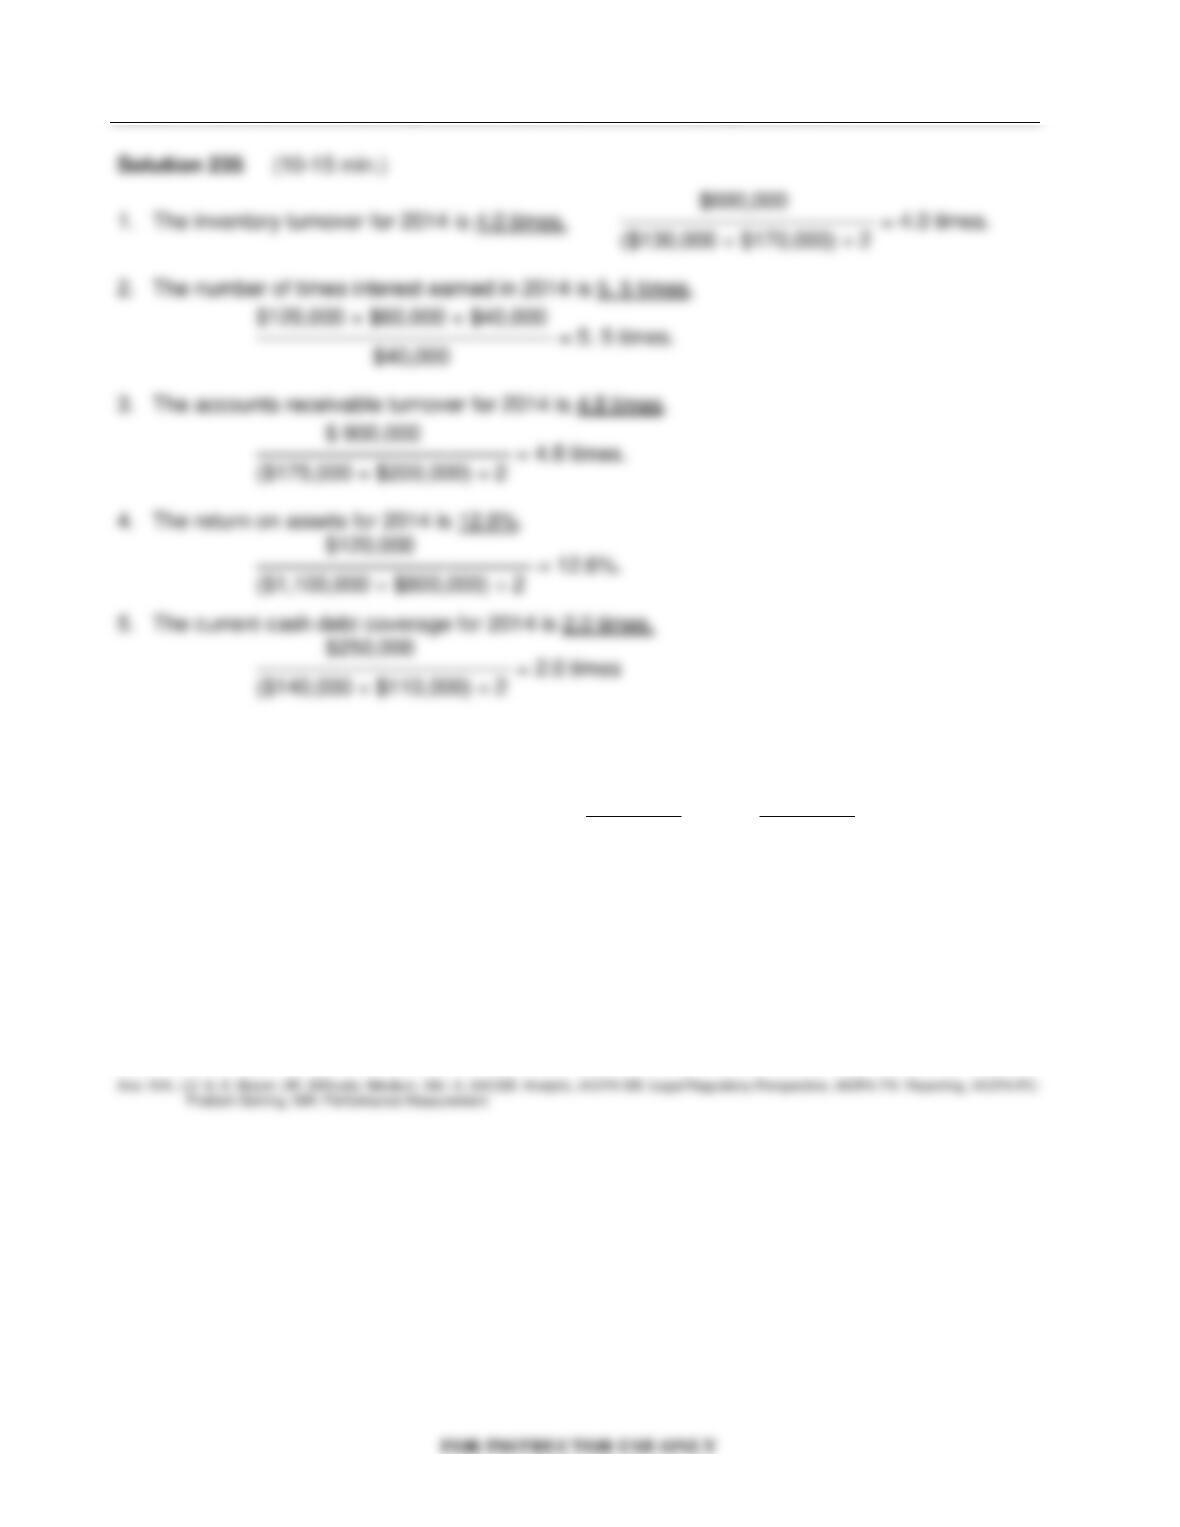
Test Bank for Accounting: Tools for Business Decision Making, Fifth Edition
13–64
Be. 236
Selected data for Buechner Corporation appear below.
2014 2013
Net credit sales $630,000 $520,000
Cost of goods sold 409,500 312,000
Inventory at end of year 64,000 85,000
Accounts receivable at end of year 90,000 50,000
Instructions
Compute the following for 2014:
(a) Gross profit percentage
(b) Inventory turnover
(c) Accounts receivable turnover
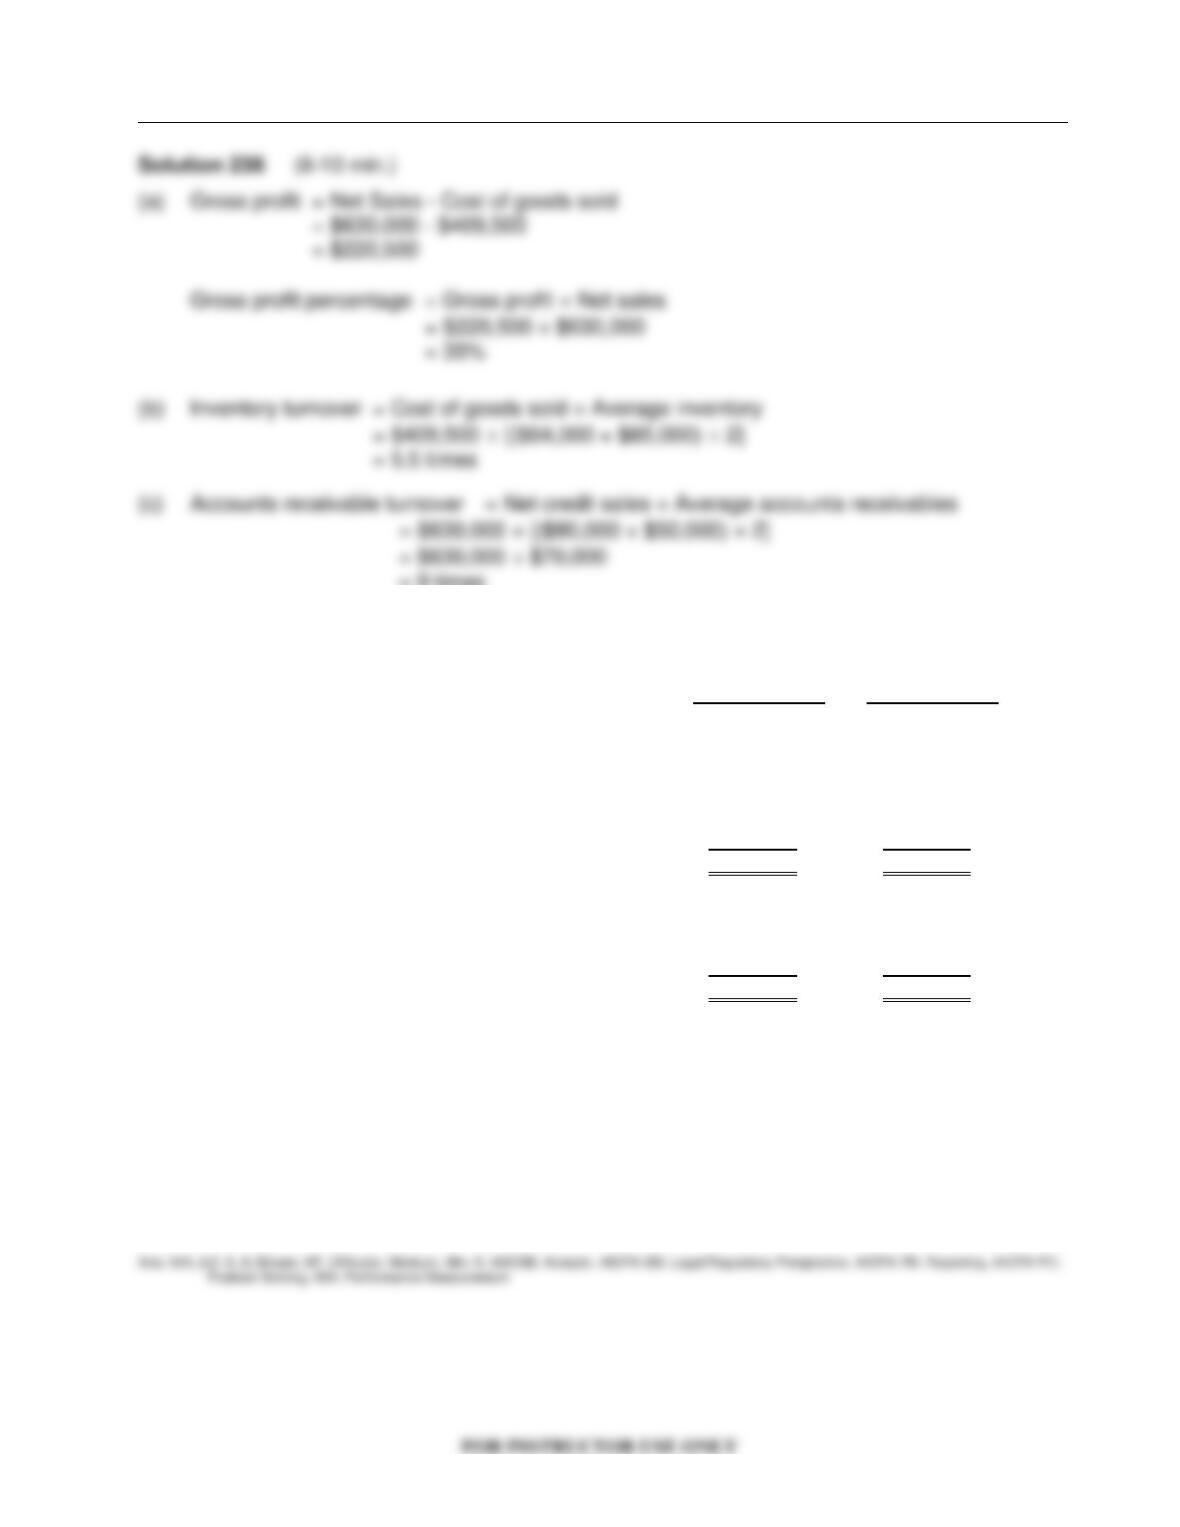
Financial Analysis: The Big Picture
13–65
= 9 times
Be. 237
Corsig Corporation had the following comparative current assets and current liabilities:
Dec. 31, 2014 Dec. 31, 2013
Current assets
Cash $ 25,000 $ 30,000
Debt investments 40,000 10,000
Accounts receivable 60,000 90,000
Inventory 110,000 90,000
Prepaid expenses 35,000 25,000
Total current assets $270,000 $245,000
Current liabilities
Accounts payable $120,000 $110,000
Salaries and wages payable 40,000 30,000
Income tax payable 10,000 15,000
Total current liabilities $170,000 $155,000
During 2014, net credit sales and cost of goods sold were $570,000 and $350,000, respectively.
Net cash provided by operating activities for 2014 was $140,000.
Instructions
Compute the following liquidity measures for 2014:
1. Current ratio
2. Current cash debt coverage
3. Accounts receivable turnover
4. Inventory turnover
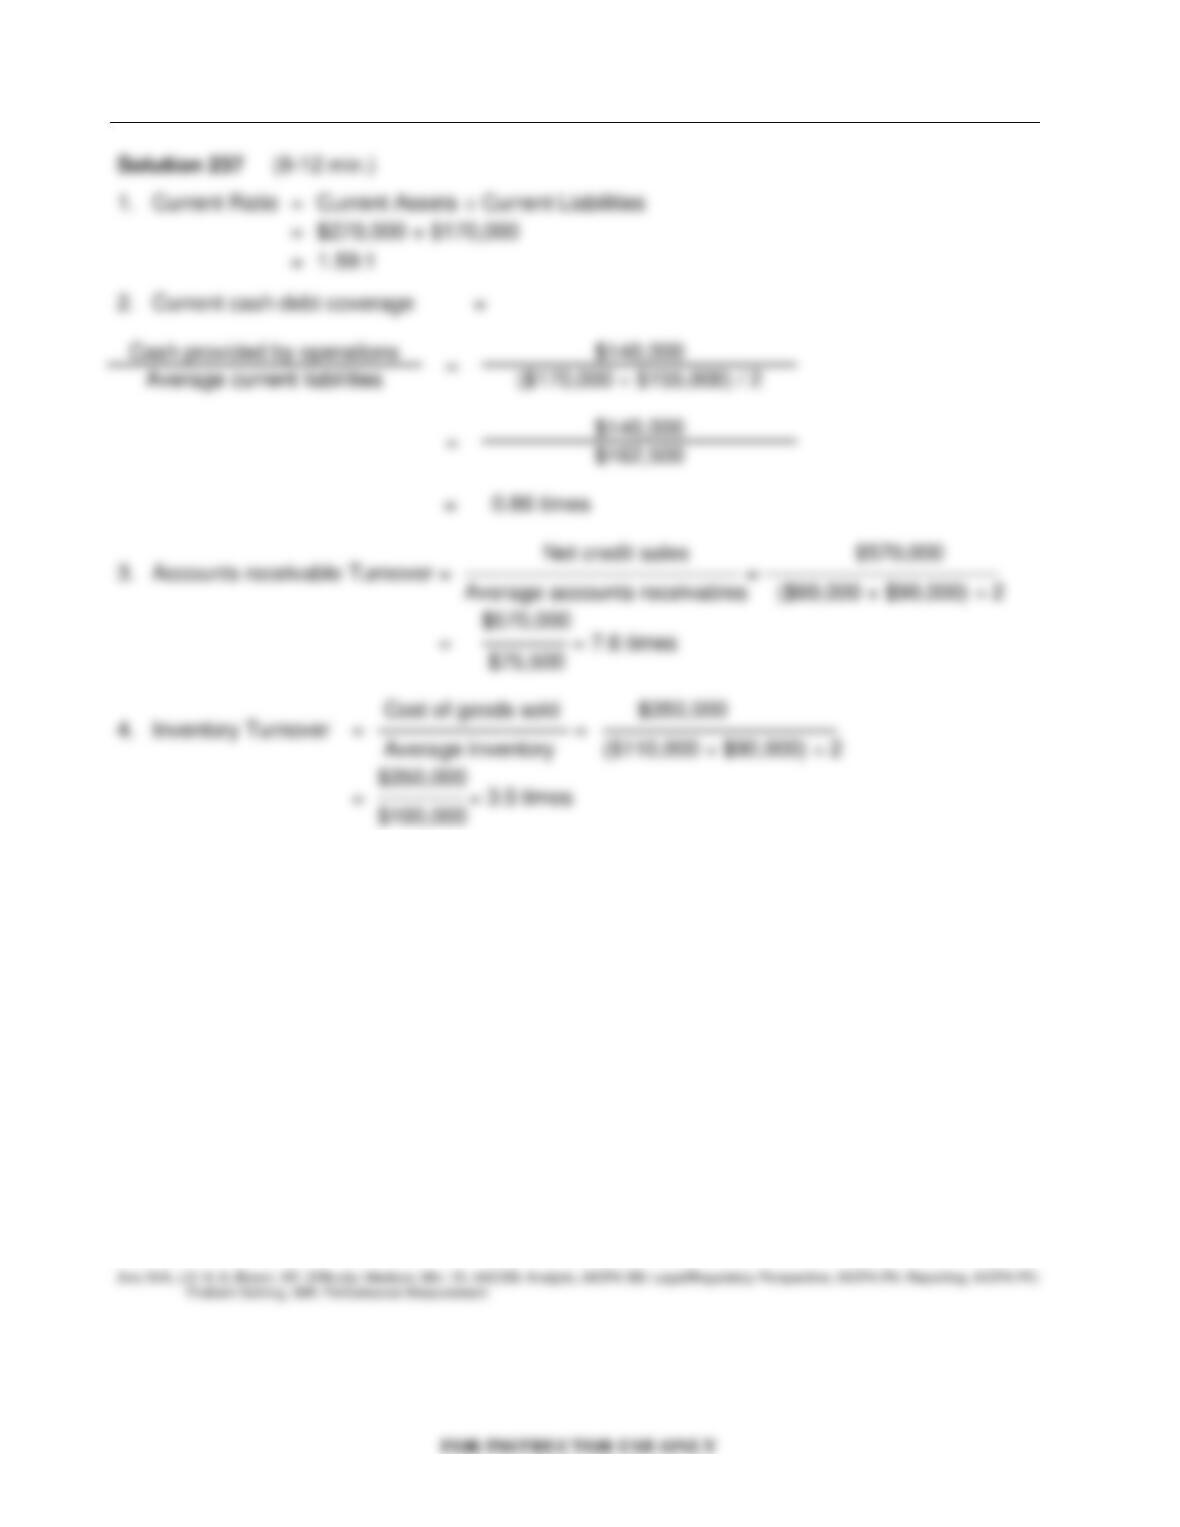
Test Bank for Accounting: Tools for Business Decision Making, Fifth Edition
13–66
Be. 238
Selected data from the Florida Fruit Company are presented below:
Total assets $1,500,000
Average total assets 1,850,000
Net income 175,000
Net sales 1,300,000
Average common stockholders’ equity 1,000,000
Net cash provided by operating activities 275,000
Instructions
Assuming that no dividends were declared or paid during the period, calculate the following
profitability ratios from the above information:
1. Profit margin
2. Asset turnover
3. Return on assets
4. Return on common stockholders’ equity
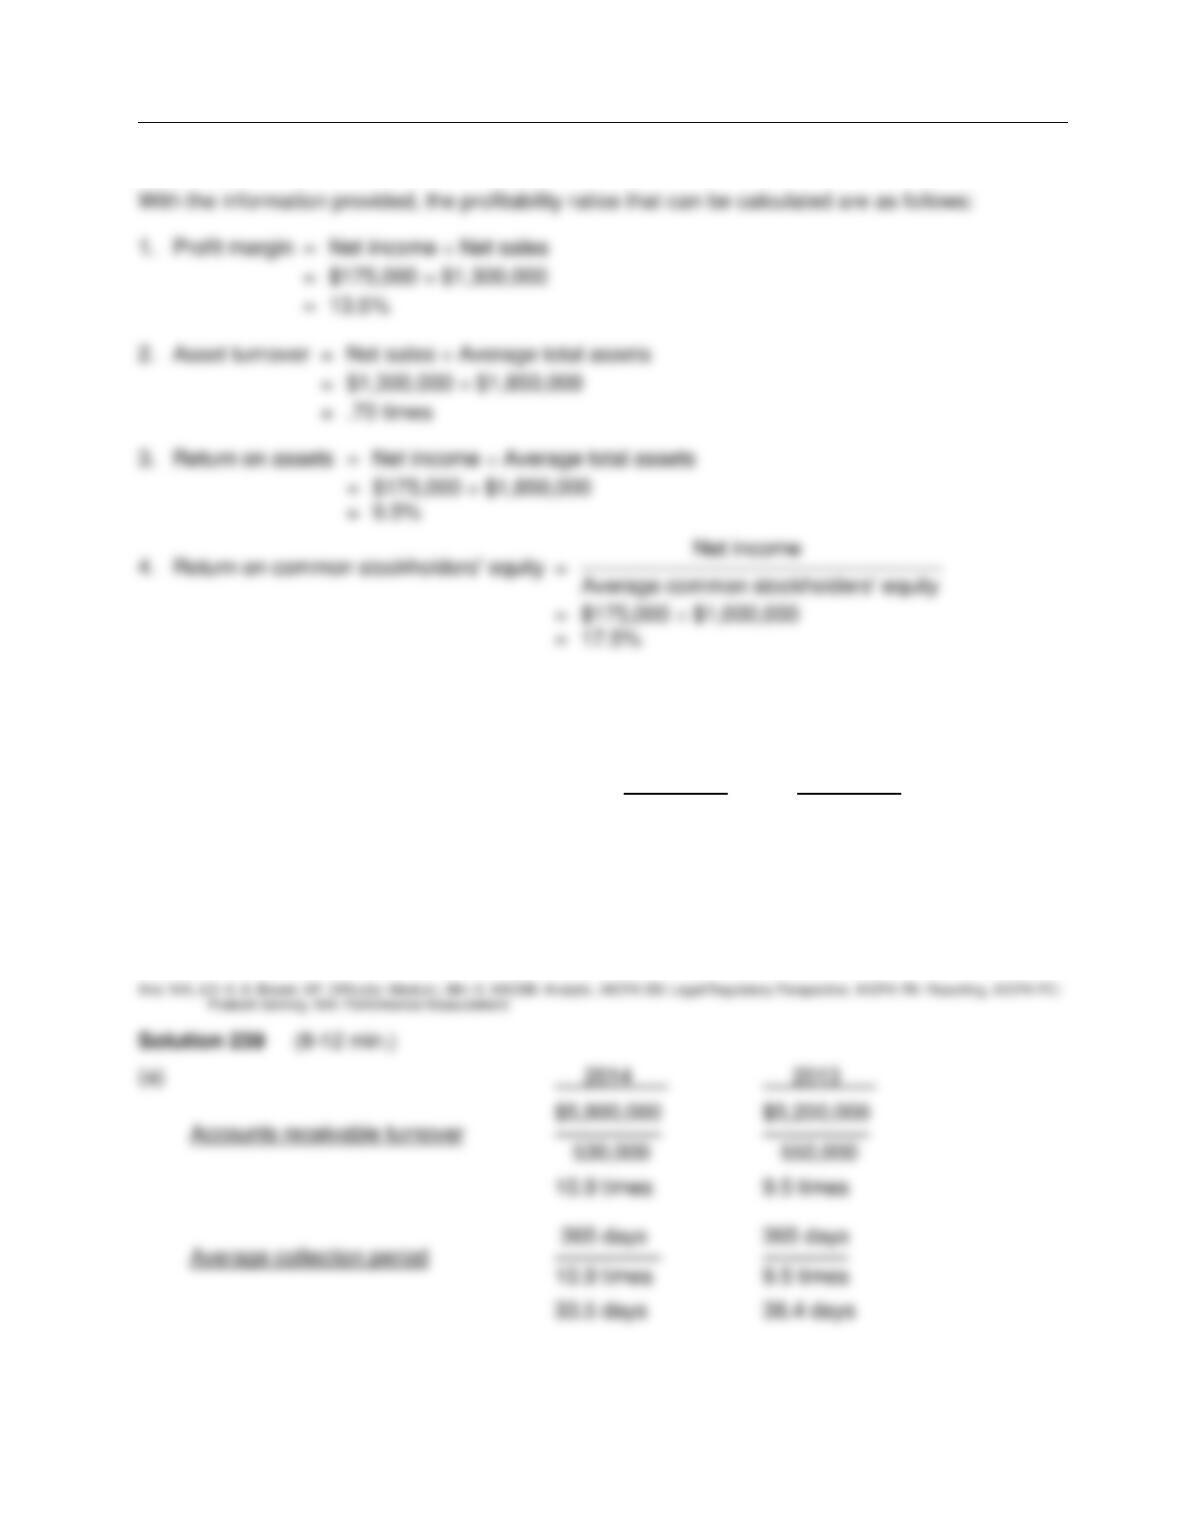
Financial Analysis: The Big Picture
FOR INSTRUCTOR USE ONLY
13–67
Solution 238 (10-15 min.)
Be. 239
The following data are taken from the financial statements of Bar Harbor Company:
2014 2013
Average accounts receivable $ 530,000 $ 550,000
Net sales on account 5,800,000 5,200,000
Terms for all sales are 2/10, n/30
Instructions
(a) Compute the accounts receivable turnover and the average collection period for both years.
(b) What conclusion can an analyst draw about the management of the accounts receivable?
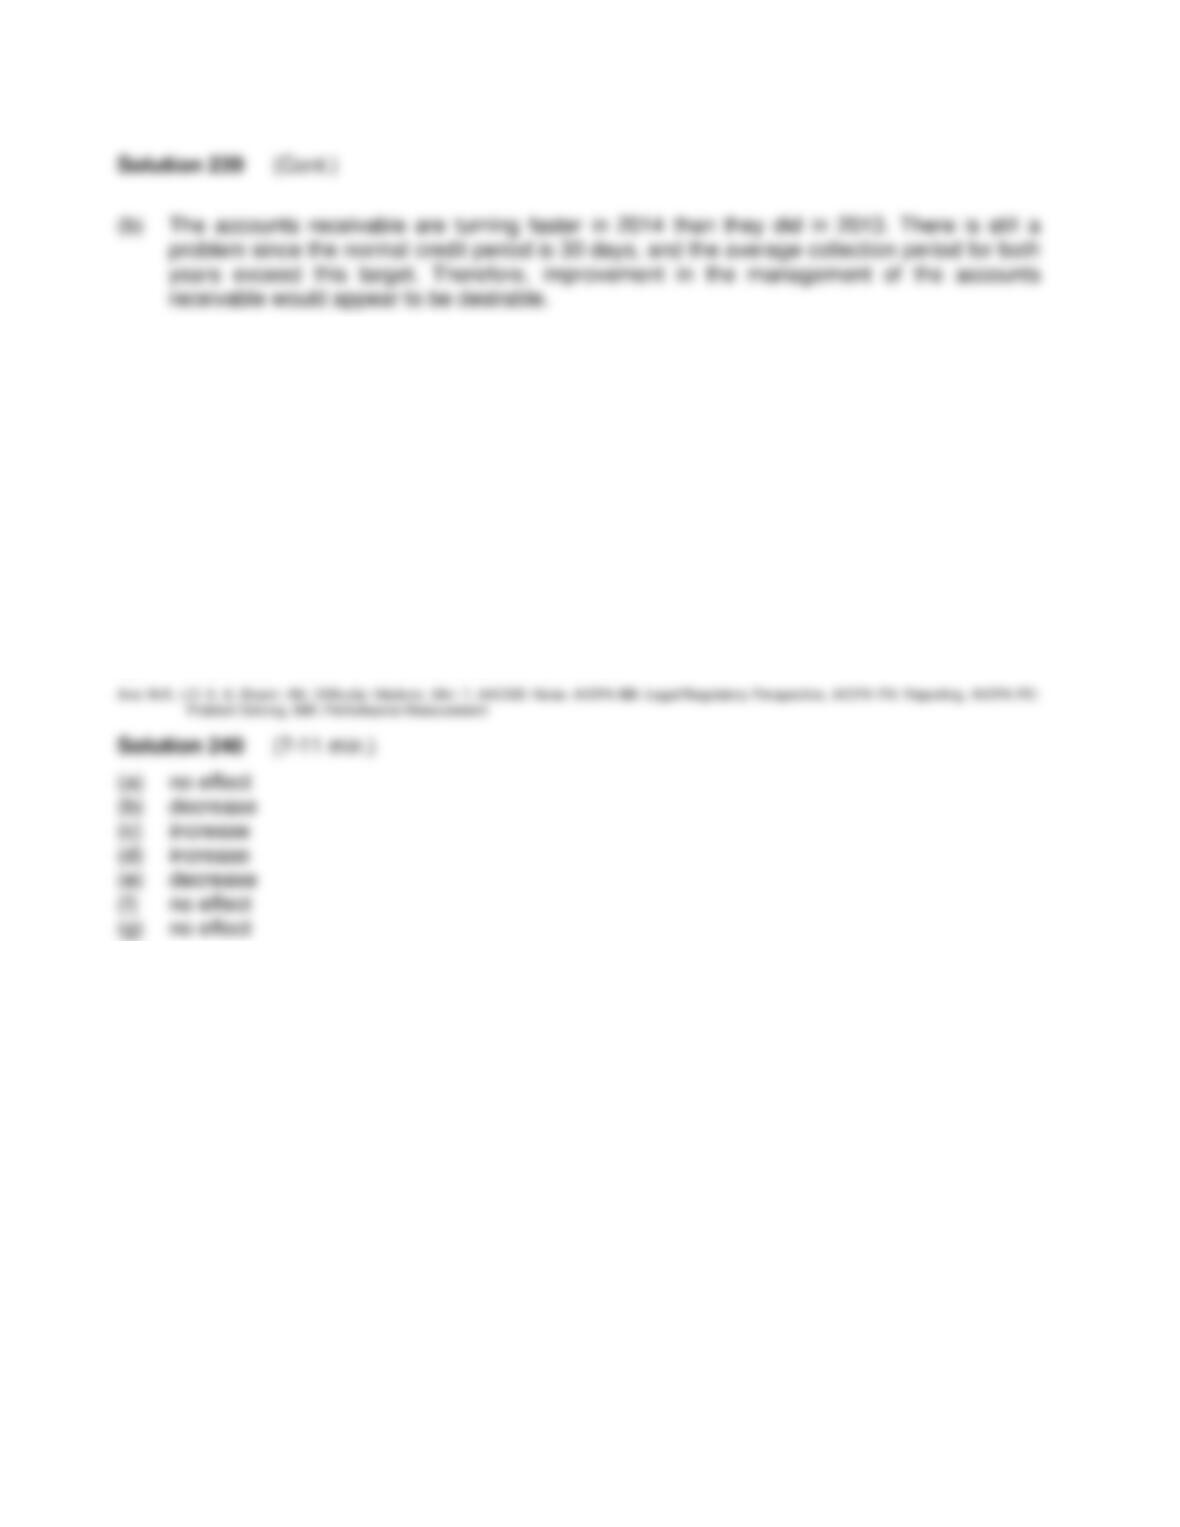
Test Bank for Accounting: Tools for Business Decision Making, Fifth Edition
FOR INSTRUCTOR USE ONLY
13–68
Be. 240
State the effect of the following transactions on the current ratio. Use increase, decrease, or no
effect for your answer.
(a) Collection of an accounts receivable
(b) Declaration of cash dividends
(c) Additional stock is sold for cash
(d) Accounts payable are paid
(e) Equipment is purchased for cash
(f) Inventory purchases are made for cash
(g) Temporary investments are purchased for cash
Be. 241
The balance sheet for Appalachian Corporation at the end of the current year includes the
following:
Bonds payable, 6% ……………………………………………… $5,000,000
6% Preferred stock, $100 par ……………………………….. 1,000,000
Common stock, $10 par ……………………………………….. 2,000,000
Net income was $565,000 and income tax expense for the current year amounted to $285,000.
Cash dividends paid on common stock were $200,000, and the common stock was selling for $28
per share at the end of the year. There were no ownership changes during the year.
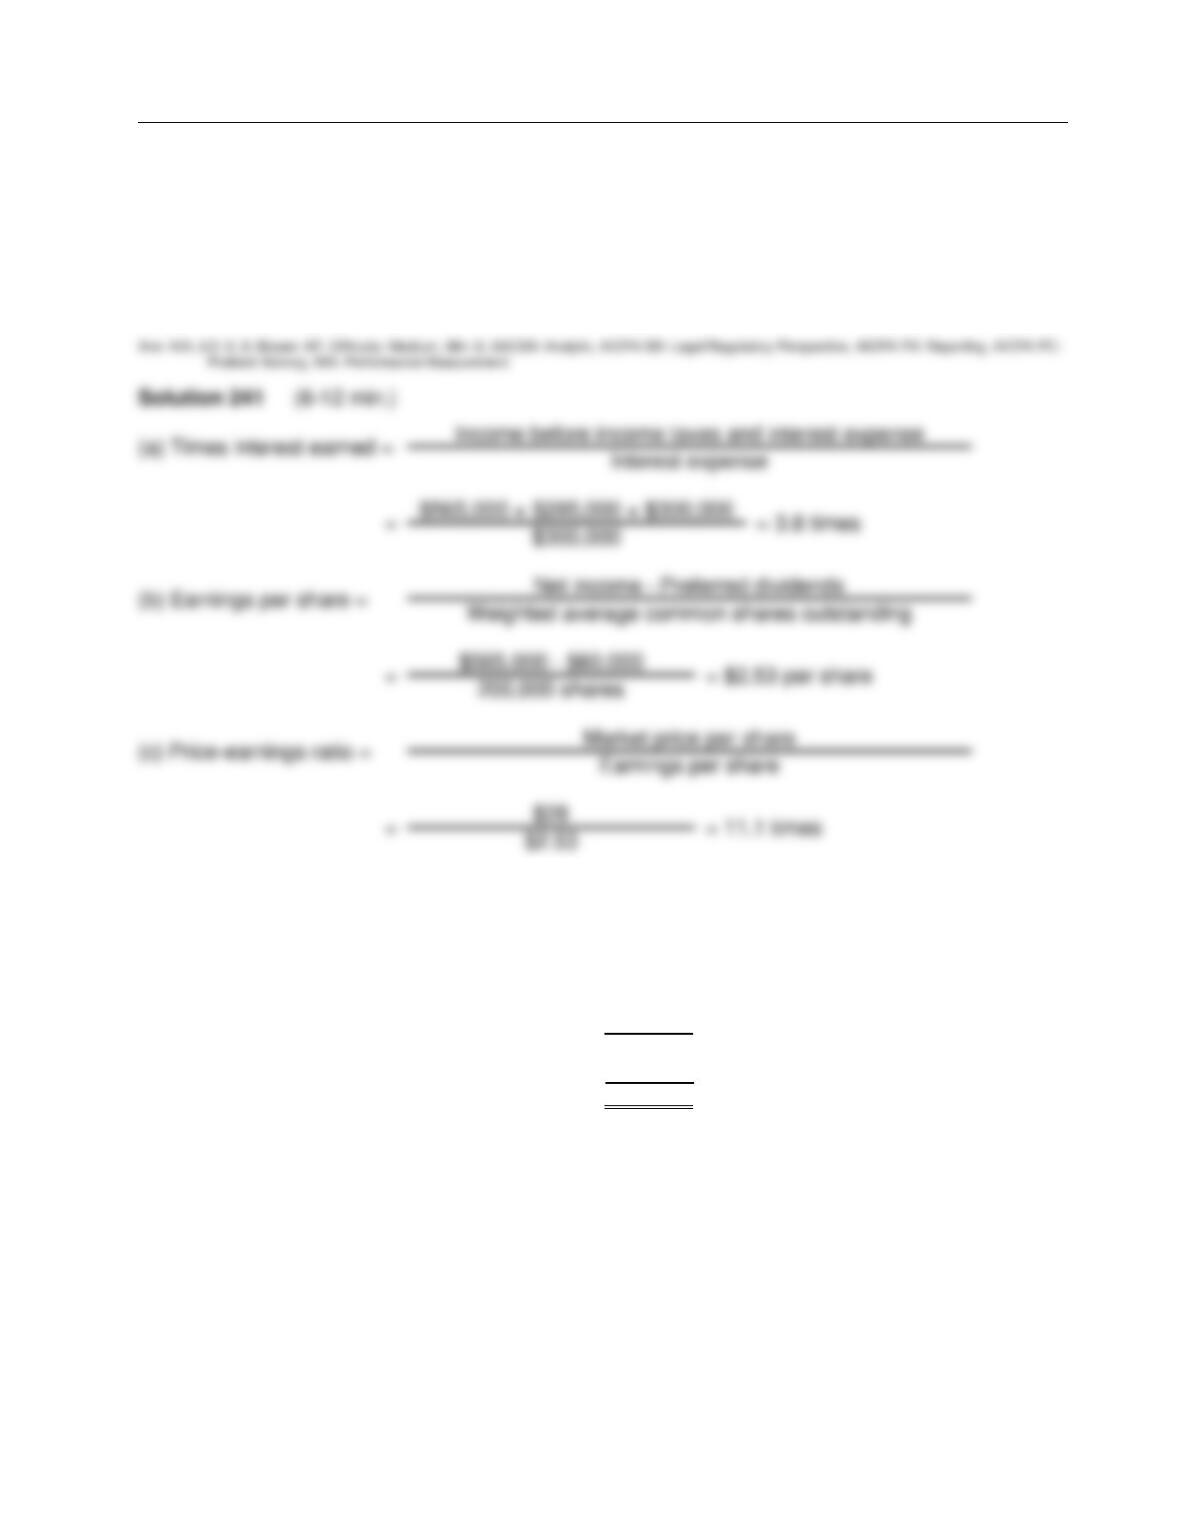
Financial Analysis: The Big Picture
FOR INSTRUCTOR USE ONLY
13–69
Be. 241 (Cont.)
Instructions
Determine each of the following:
(a) Number of times that bond interest was earned.
(b) Earnings per share for common stock.
(c) Price-earnings ratio.
Be. 242
The income statement for the Carolina Service Company for the year ended December 31, 2014,
appears below.
Sales revenue $670,000
Cost of goods sold 390,000
Gross profit 280,000
Expenses 180,000*
Net income $100,000
*Includes $25,000 of interest expense and $20,000 of income tax expense.
Additional information:
1. Common stock outstanding on January 1, 2014, was 50,000 shares. On July 1, 2014, 10,000
more shares were issued.
2. The market price of Carolina’s stock was $22 at the end of 2014.
3. Cash dividends of $35,000 were paid, $5,000 of which were paid to preferred stockholders.
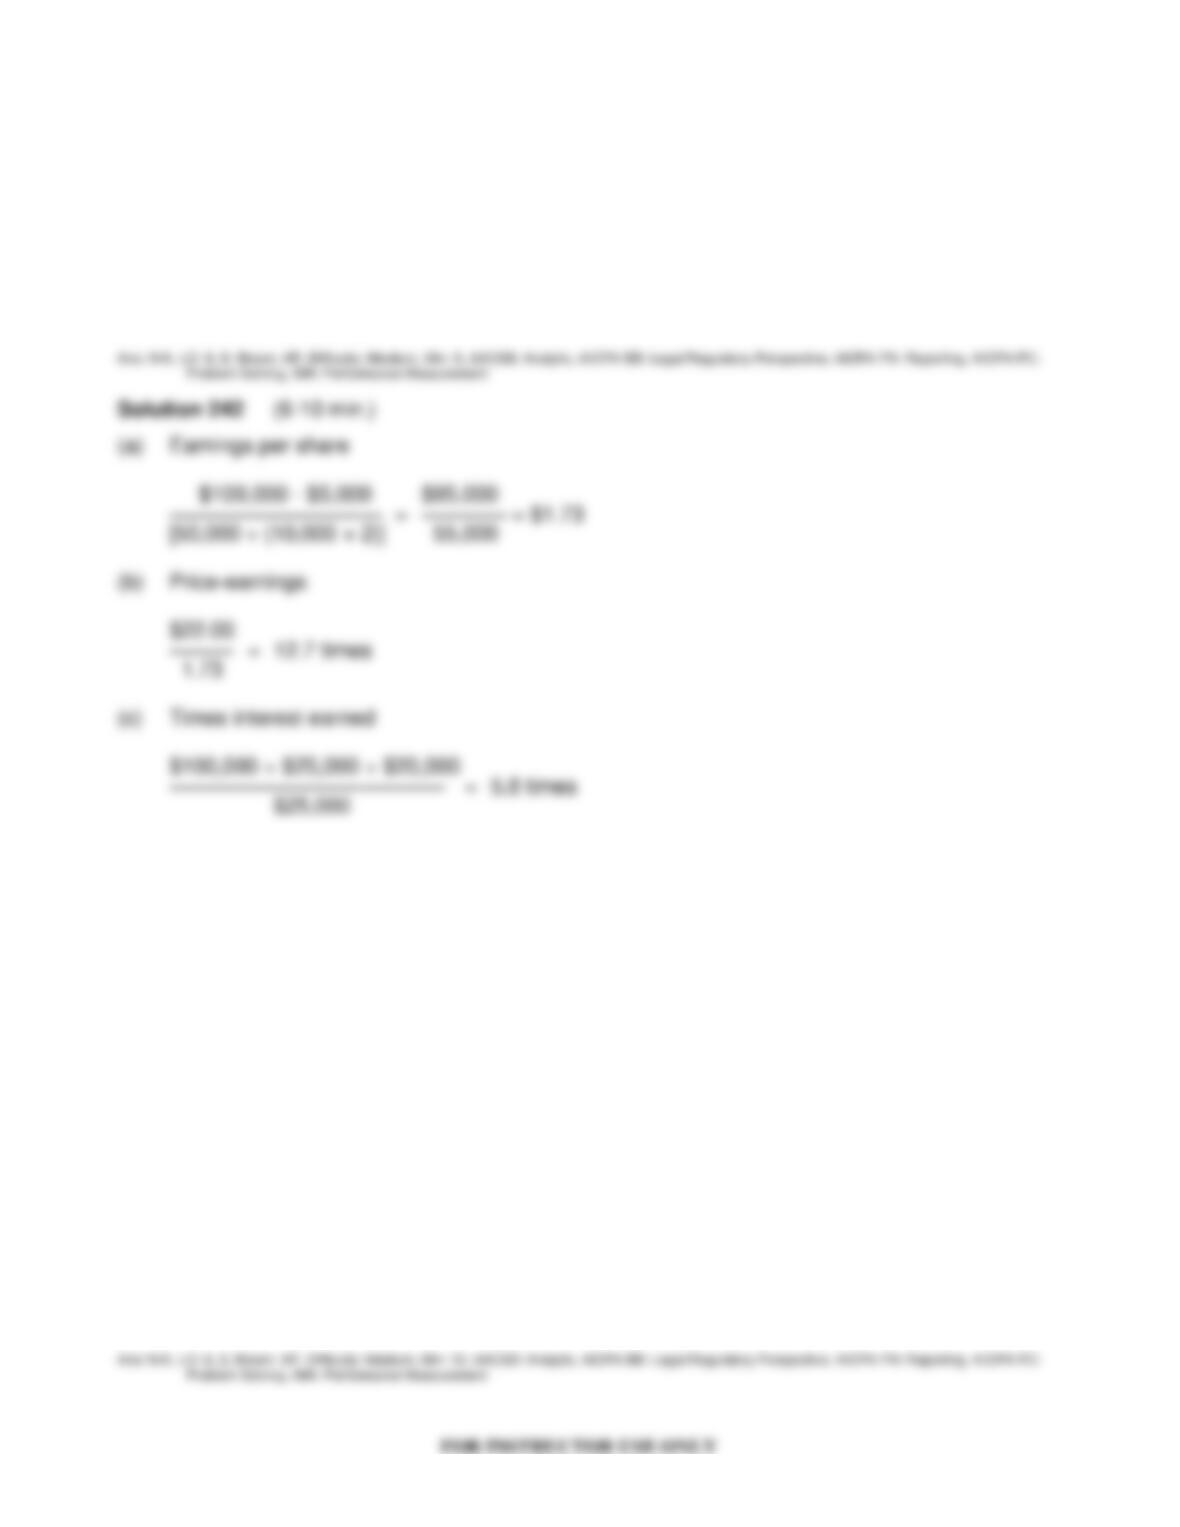
Test Bank for Accounting: Tools for Business Decision Making, Fifth Edition
13–70
Be. 242 (Cont.)
Instructions
Compute the following ratios for 2014:
(a) Earnings per share.
(b) Price-earnings.
(c) Times interest earned.
Be. 243
Selected data taken from the 2014 financial statements of Phillips Card Company, Inc. are as
follows (in millions).
Net sales $295.9
Current liabilities, February 28, 2013 39.5
Current liabilities, February 28, 2014 47.5
Net cash provided by operating activities 17.0
Total liabilities, February 28, 2013 64.2
Total liabilities, February 28, 2014 71.2
Capital expenditures 2.6
Cash dividends 6.5
Instructions
Compute these ratios at February 20, 2014:
(a) Current cash debt coverage
(b) Cash debt coverage
(c) Free cash flow
Provide a brief interpretation of your results.
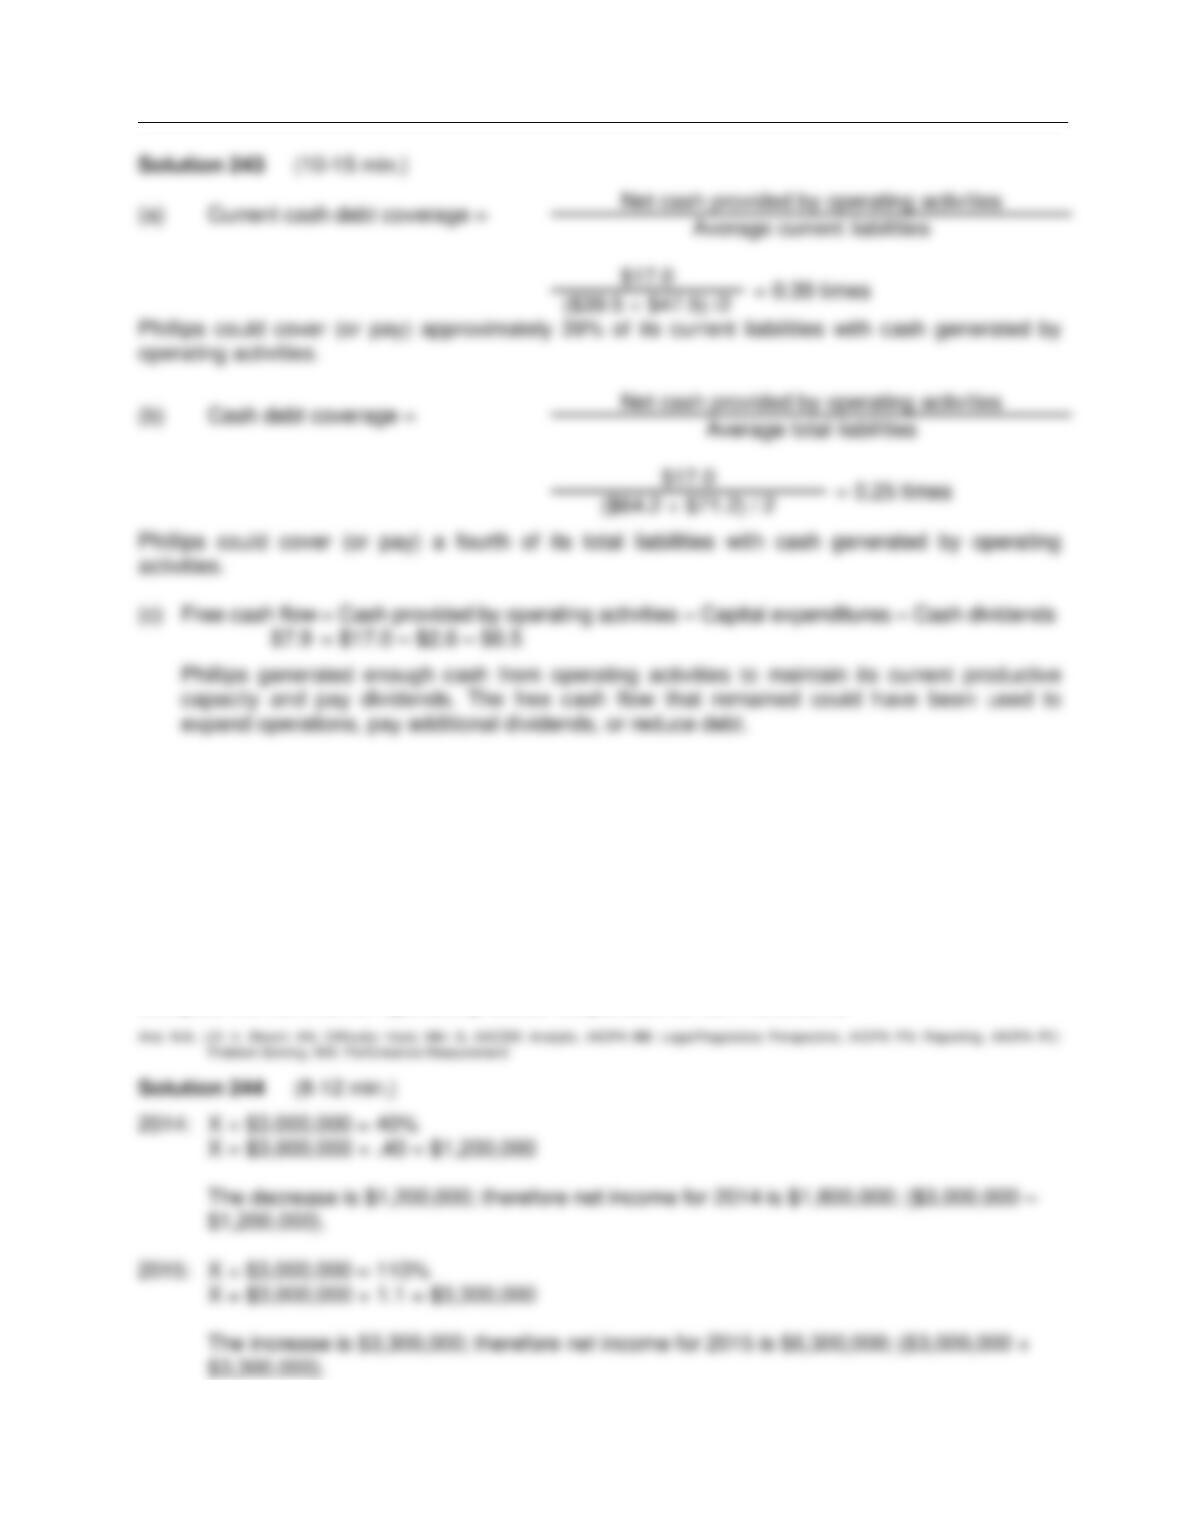
Financial Analysis: The Big Picture
FOR INSTRUCTOR USE ONLY
13–71
EXERCISES
Ex. 244
Exeter Corporation had net income of $3,000,000 in 2013. Using 2013 as the base year, net
income decreased by 40% in 2014 and increased by 110% in 2015.
Instructions
Compute the net income reported by Exeter Corporation for 2014 and 2015.
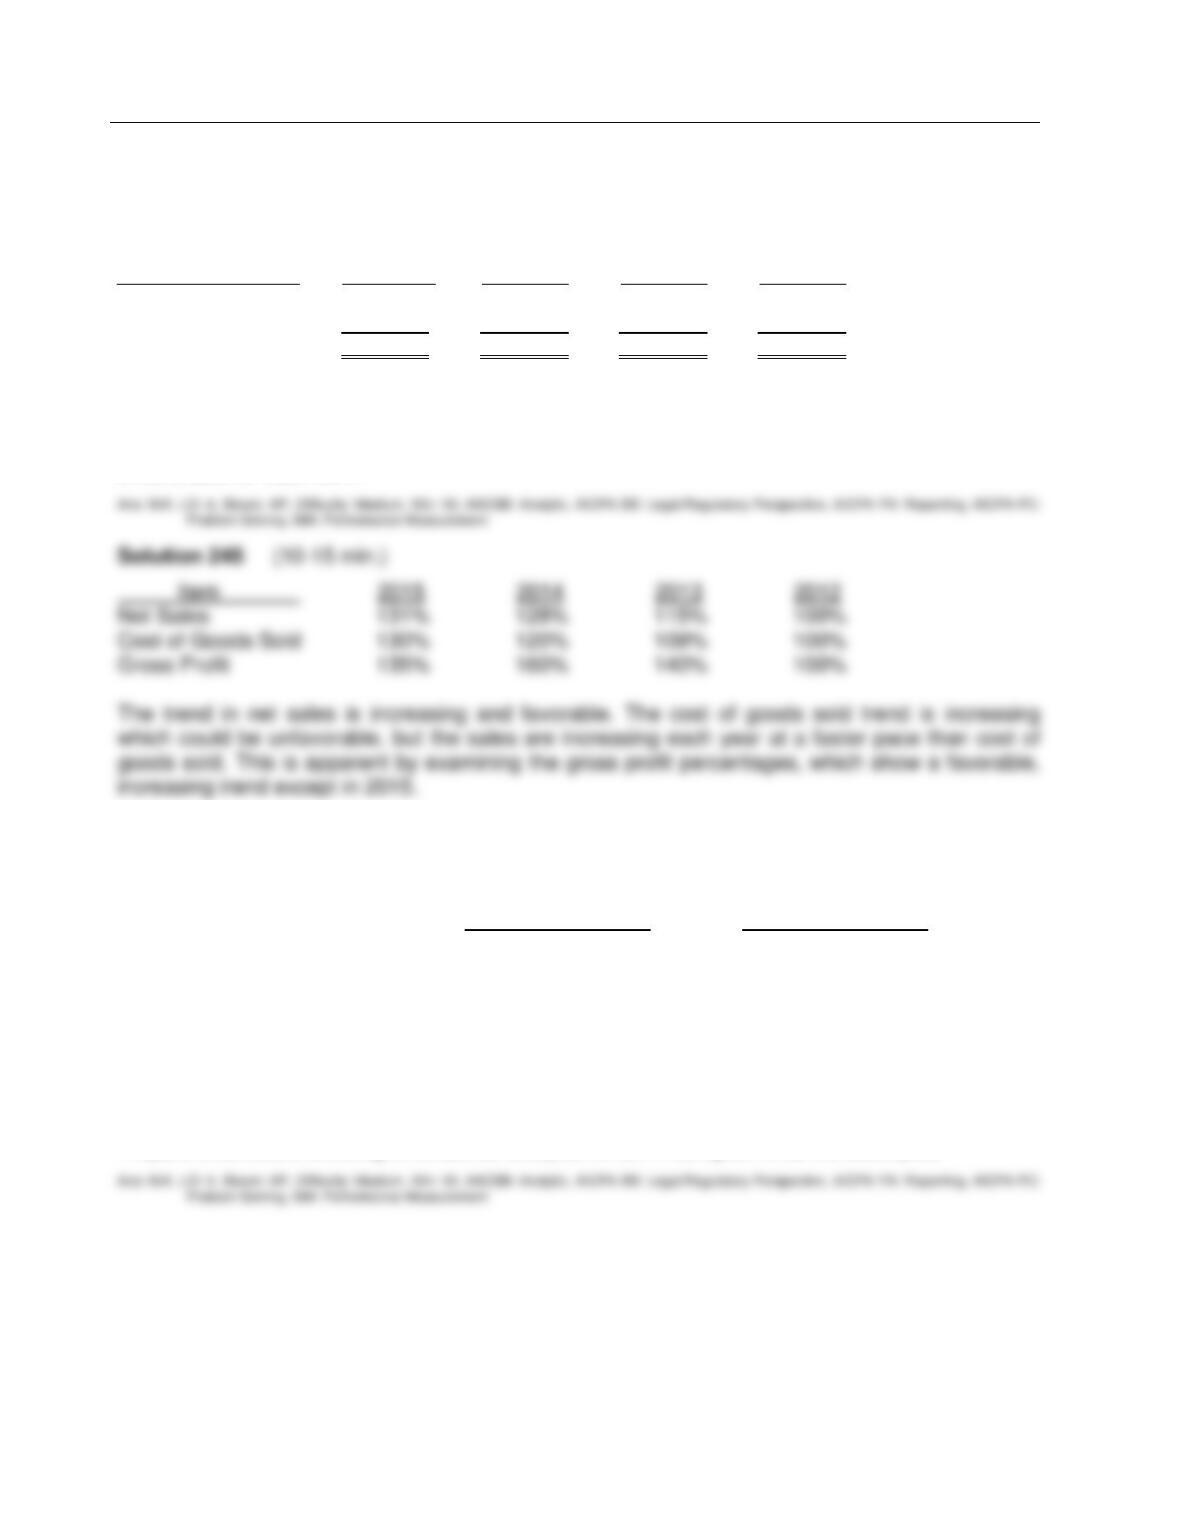
Test Bank for Accounting: Tools for Business Decision Making, Fifth Edition
FOR INSTRUCTOR USE ONLY
13–72
Ex. 245
The following items were taken from the financial statements of St. Johns, Inc., over a four–year
period:
Item 2015 2014 2013 2012
Net Sales $655,000 $640,000 $575,000 $500,000
Cost of Goods Sold 520,000 480,000 435,000 400,000
Gross Profit $135,000 $160,000 $140,000 $100,000
Instructions
Using horizontal analysis and 2012 as the base year, compute the trend percentages for net
sales, cost of goods sold, and gross profit. Explain whether the trends are favorable or
unfavorable for each item.
Ex. 246
Here is financial information for Valdez Express Inc.
December 31, 2014 December 31, 2013
Current assets $114,000 $80,000
Plant assets (net) 414,000 360,000
Current liabilities 91,000 65,000
Long-term liabilities 134,500 90,000
Common stock, $1 par 149,500 115,000
Retained earnings 153,000 170,000
Instructions
Prepare a schedule showing a horizontal analysis for 2014 using 2013 as the base year.
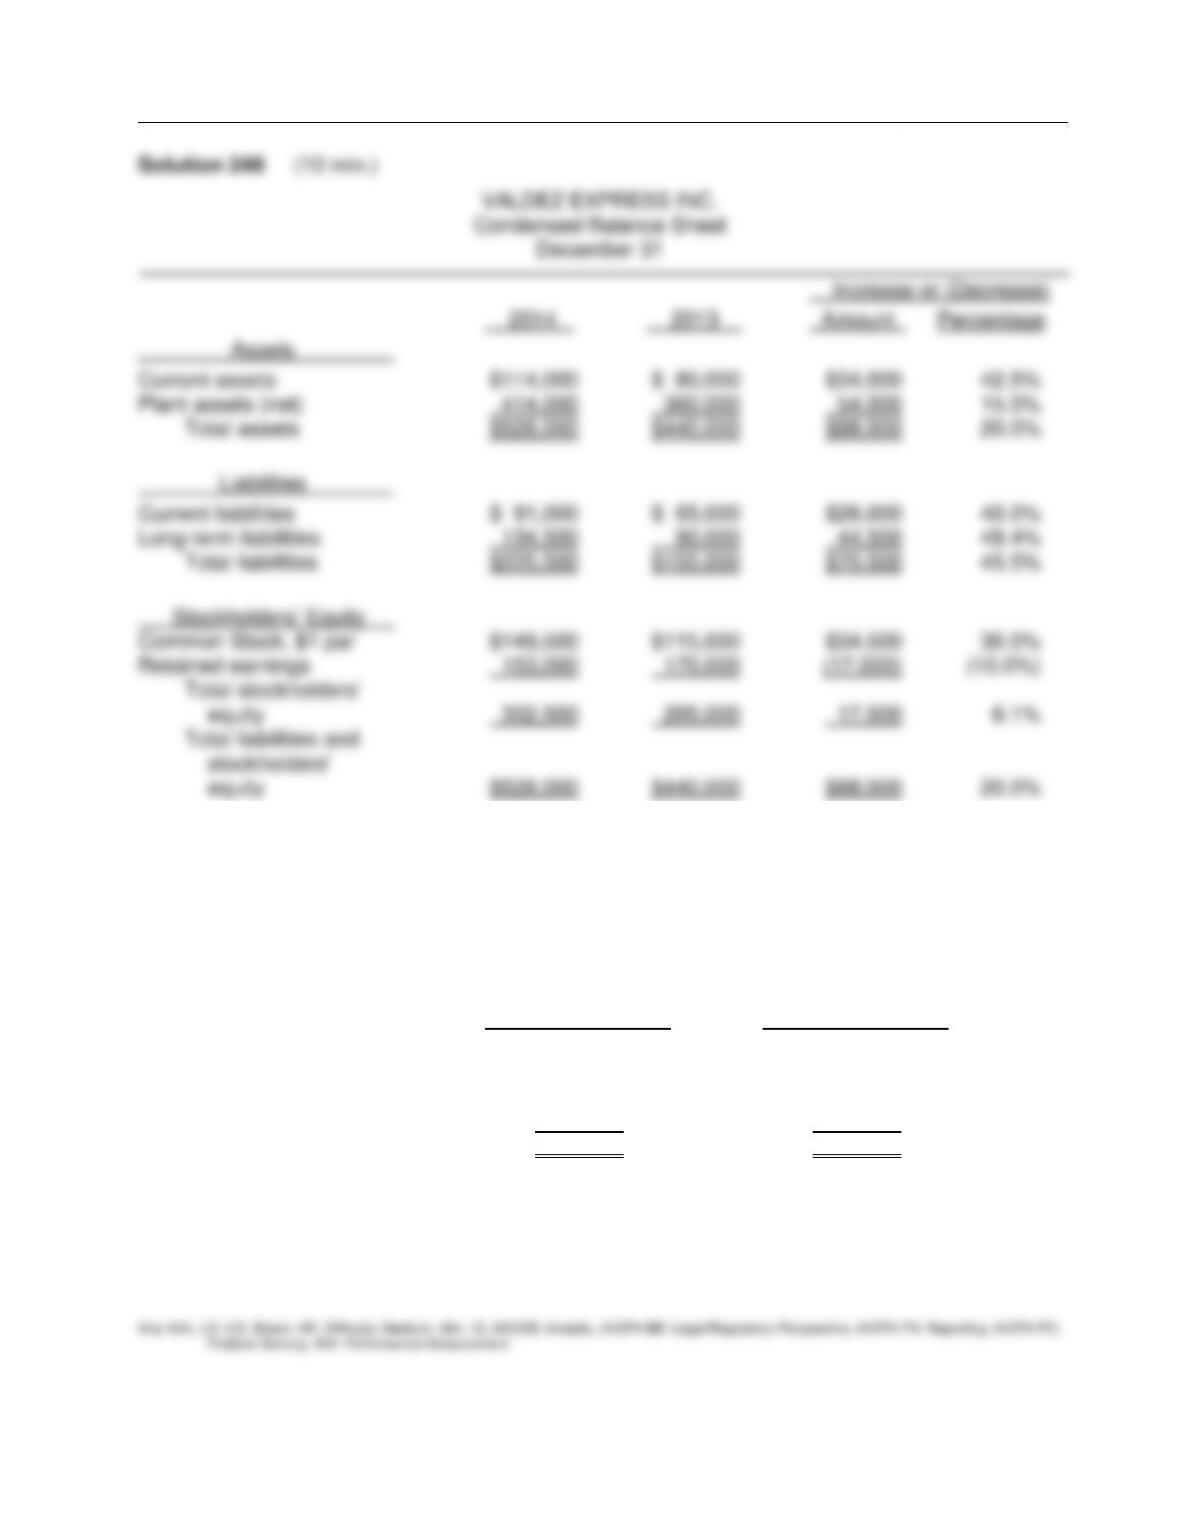
Financial Analysis: The Big Picture
FOR INSTRUCTOR USE ONLY
13–73
Ex. 247
Here are the comparative income statements of Georgia Development Corporation.
GEORGIA DEVELOPMENT CORPORATION
Comparative Income Statements
For the Years Ended December 31
December 31, 2014 December 31, 2013
Net sales $600,000 $500,000
Cost of goods sold 414,000 350,000
Gross profit 186,000 150,000
Operating expenses 150,000 120,000
Net income $36,000 $30,000
Instructions
(a) Prepare a horizontal analysis of the income statement data for Georgia Development
Corporation using 2013 as a base. (Show the amounts of increase of decrease.)
(b) Prepare a vertical analysis of the income statement data for Georgia Development Corporation
for both years.
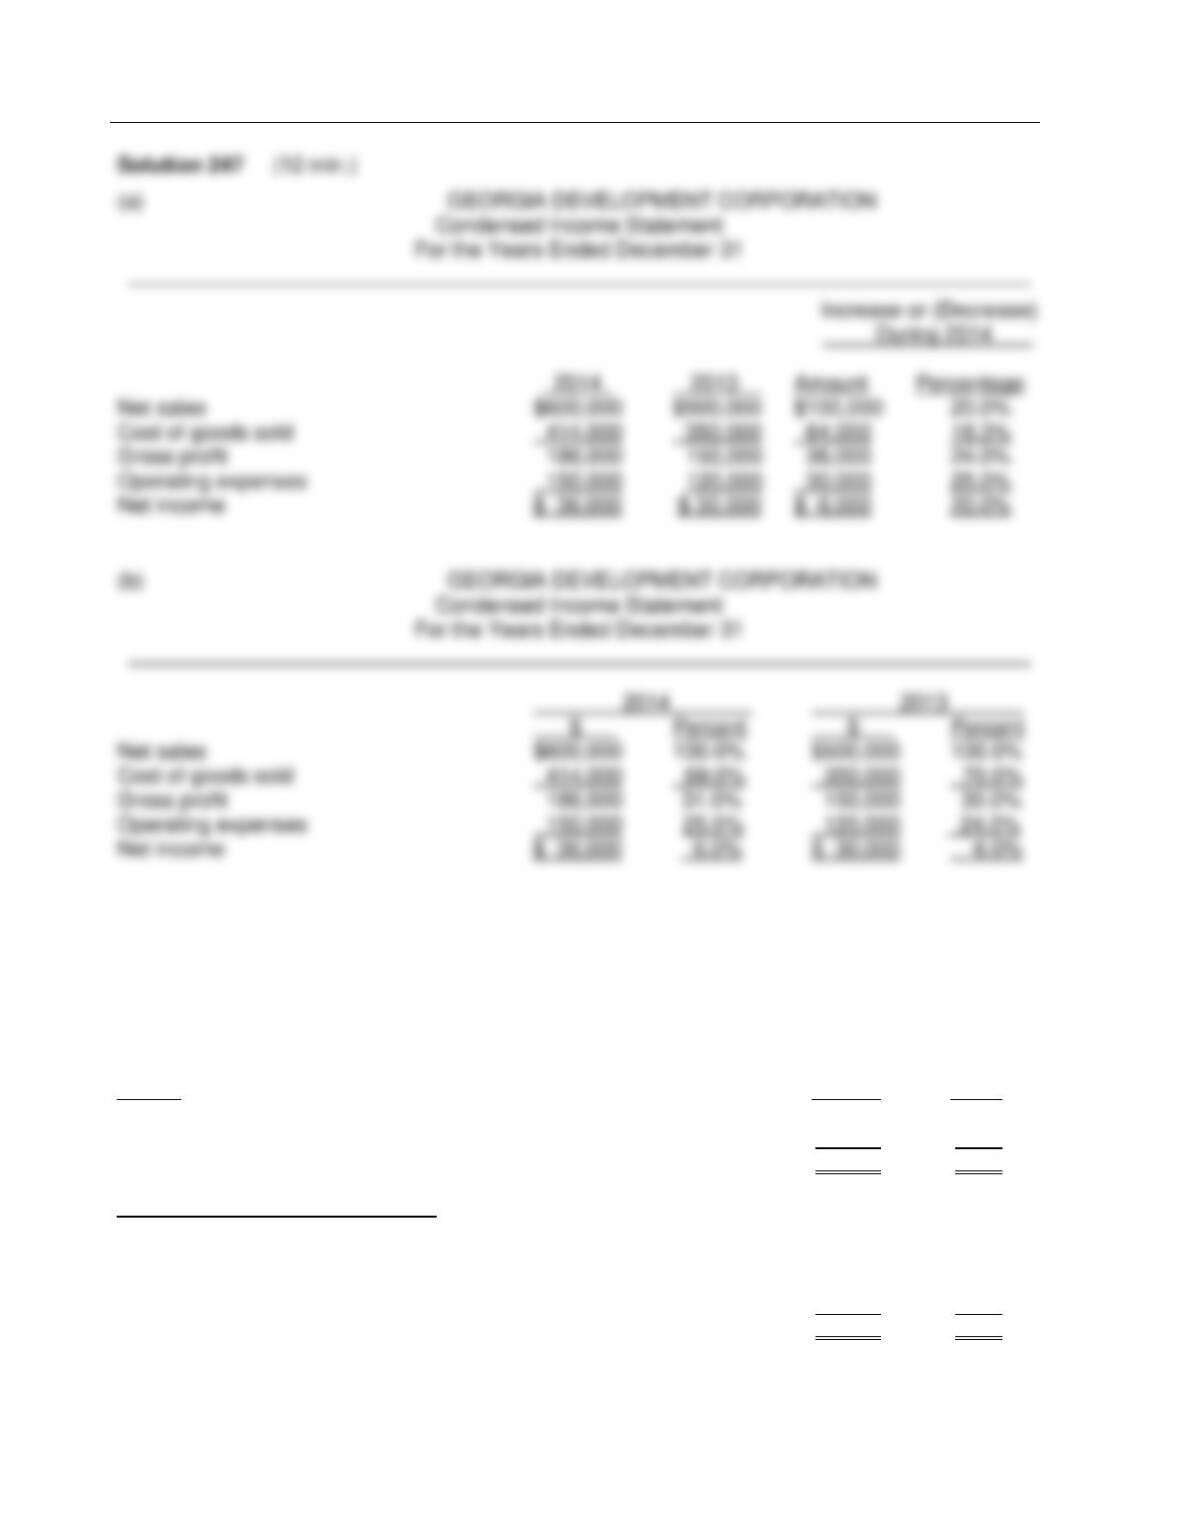
Test Bank for Accounting: Tools for Business Decision Making, Fifth Edition
FOR INSTRUCTOR USE ONLY
13–74
Ex. 248
The comparative balance sheet of Delta Company appears below:
Delta COMPANY
Comparative Balance Sheet
December 31,
___________________________________________________________________________
Assets 2014 2013
Current assets …………………………………………………………………………. $ 450 $280
Plant assets …………………………………………………………………………….. 550 520
Total assets ……………………………………………………………………….. $1,000 $800
Liabilities and stockholders’ equity
Current liabilities ………………………………………………………………………. $ 180 $120
Long-term debt ………………………………………………………………………… 250 160
Common stock ………………………………………………………………………… 310 320
Retained earnings ……………………………………………………………………. 260 200
Total liabilities and stockholders’ equity ………………………………….. $1,000 $800
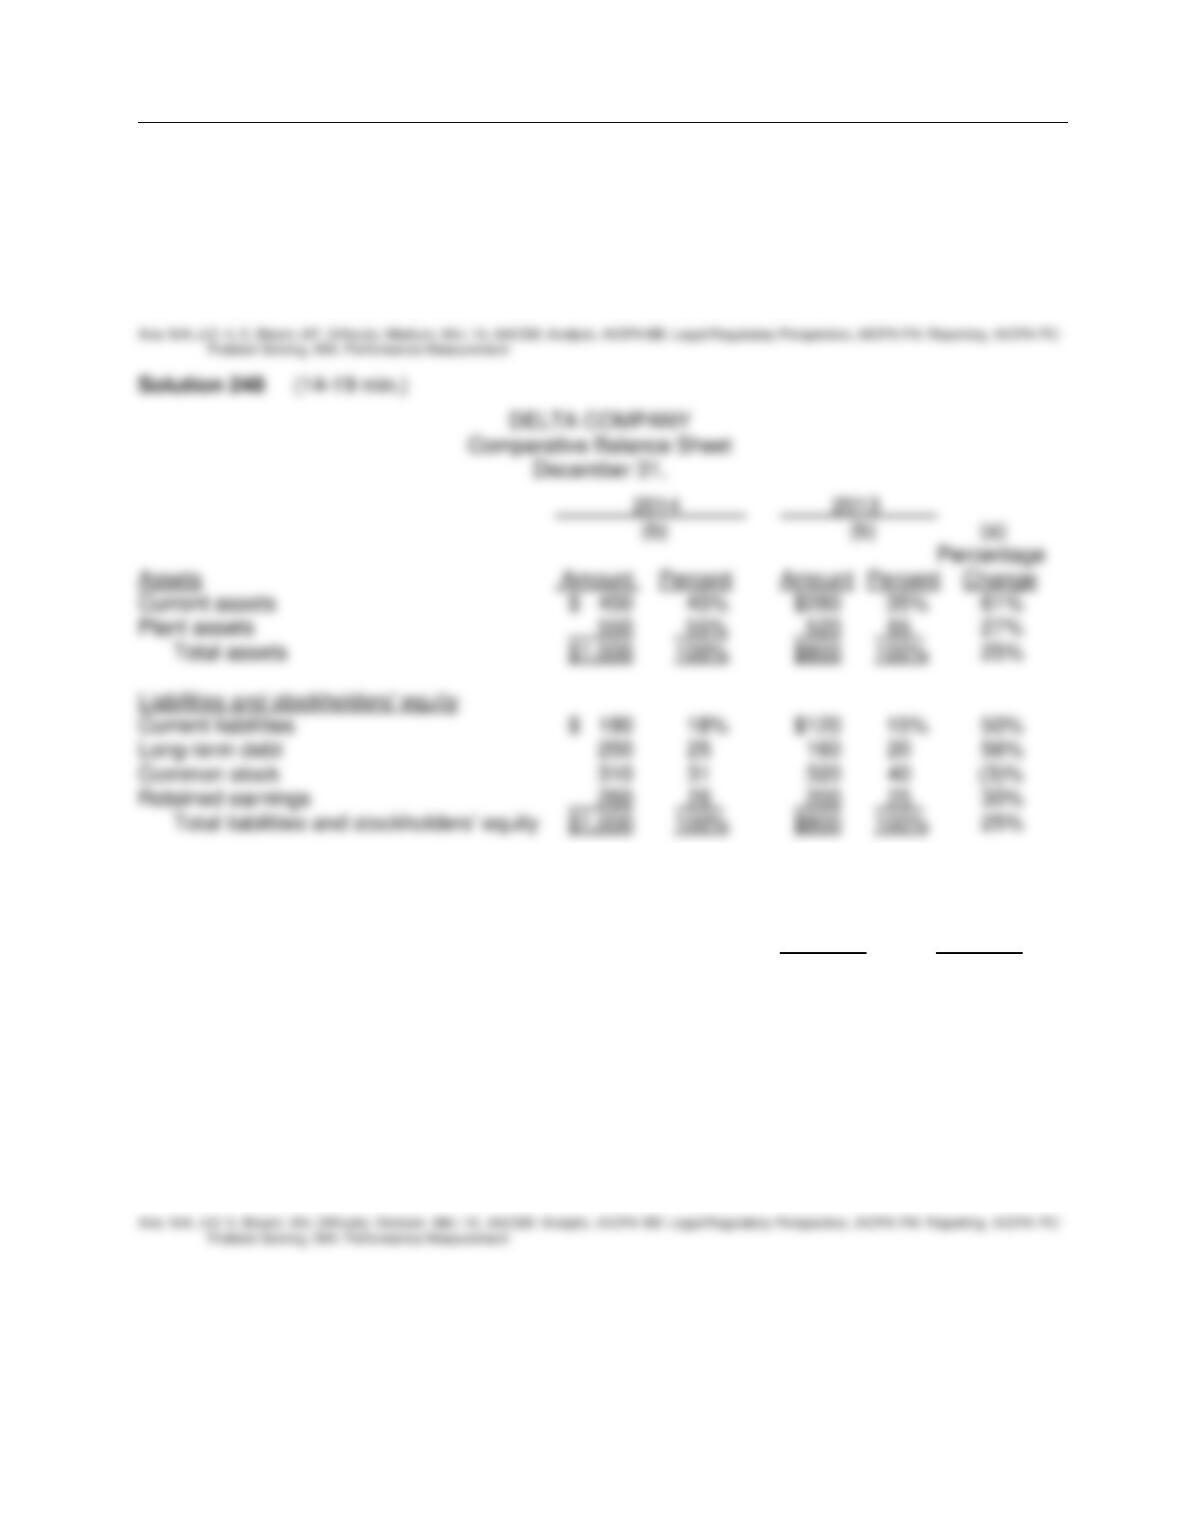
Financial Analysis: The Big Picture
FOR INSTRUCTOR USE ONLY
13–75
Ex. 248 (Cont.)
Instructions
(a) Using horizontal analysis, show the percentage change for each balance sheet item using
2013 as a base year.
(b) Using vertical analysis, prepare a common size comparative balance sheet.
Ex. 249
The following information was taken from the financial statements of Bjorg Company:
2014 2013
Gross profit on sales ………………………………………………………. $600,000 $680,000
Income before income taxes ……………………………………………. 230,000 221,000
Net income ……………………………………………………………………. 180,000 153,000
Net income as a percentage of net sales …………………………... 10% 9%
Instructions
(a) Compute the net sales for each year.
(b) Compute the cost of goods sold in dollars and as a percentage of net sales for each year.
(c) Compute operating expenses in dollars and as a percentage of net sales for each year.
(Income taxes are not operating expenses).
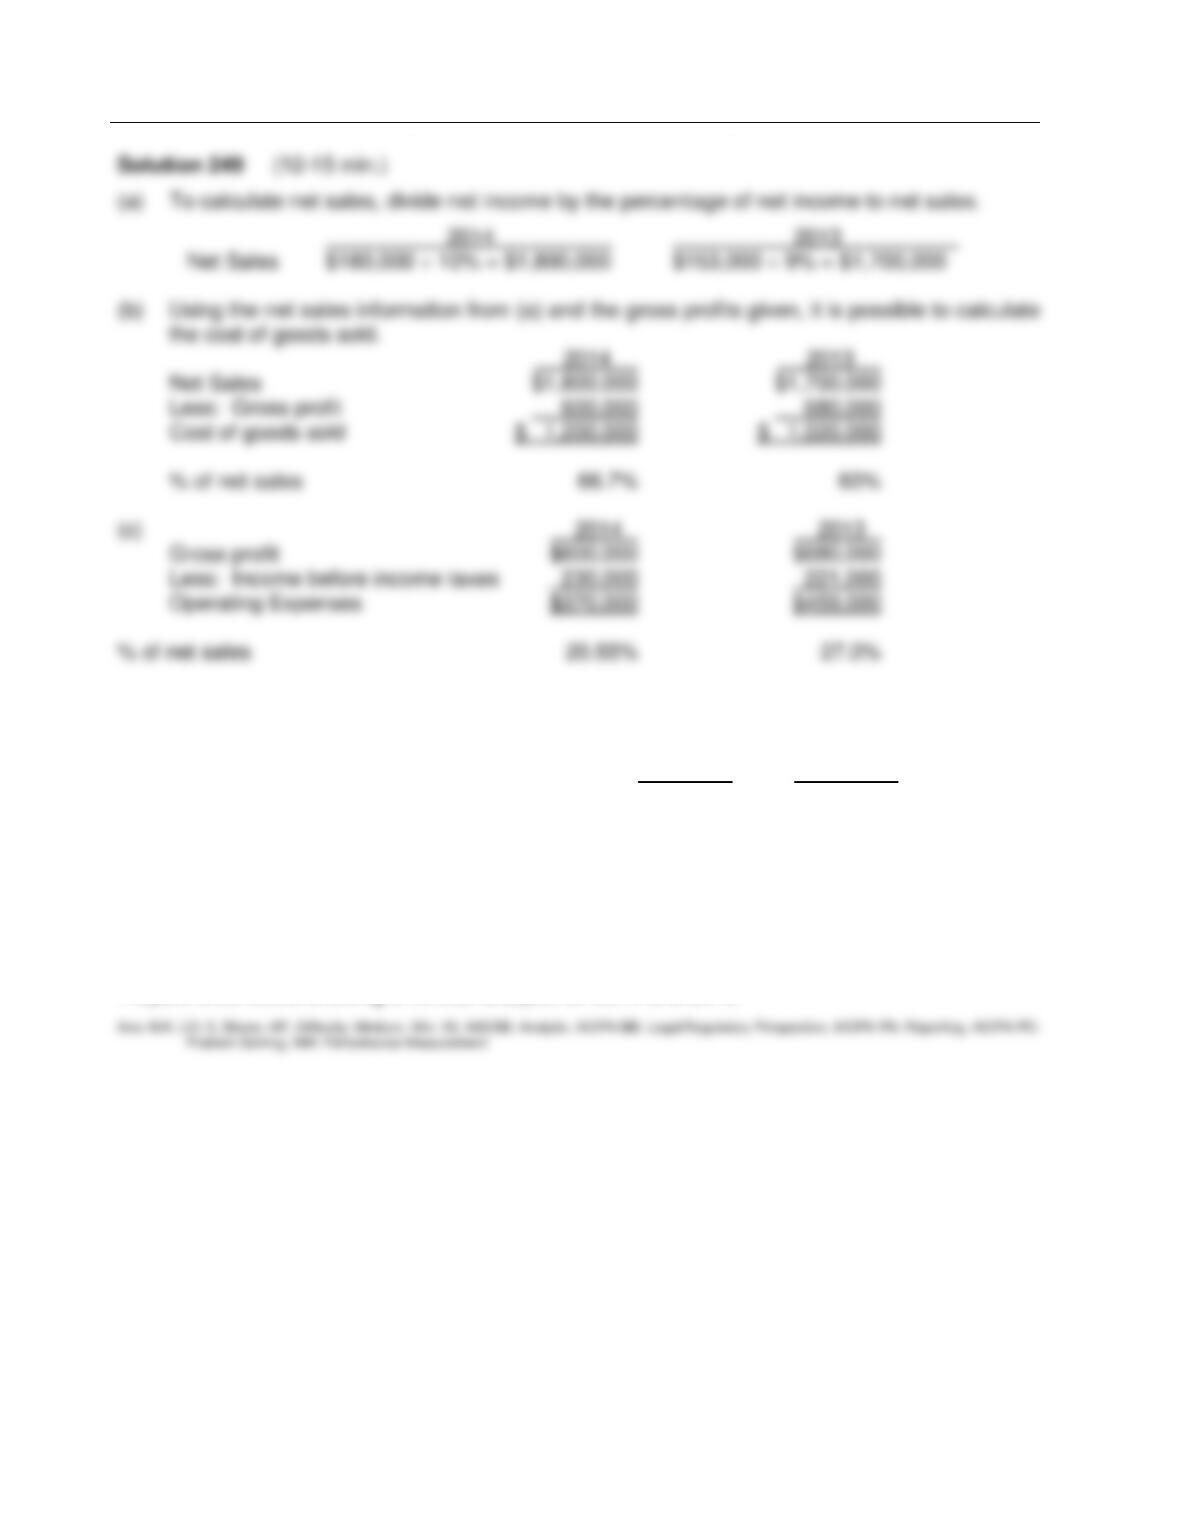
Test Bank for Accounting: Tools for Business Decision Making, Fifth Edition
FOR INSTRUCTOR USE ONLY
13–76
Ex. 250
Operating data for Panola Land Corporation are presented below
2014 2013
Sales revenue $800,000 $600,000
Cost of goods sold 480,000 390,000
Selling expenses 120,000 78,000
Administrative expenses 80,000 54,000
Income tax expense 24,000 25,000
Net income 96,000 53,000
Instructions
Prepare a schedule showing a vertical analysis for 2014 and 2013.
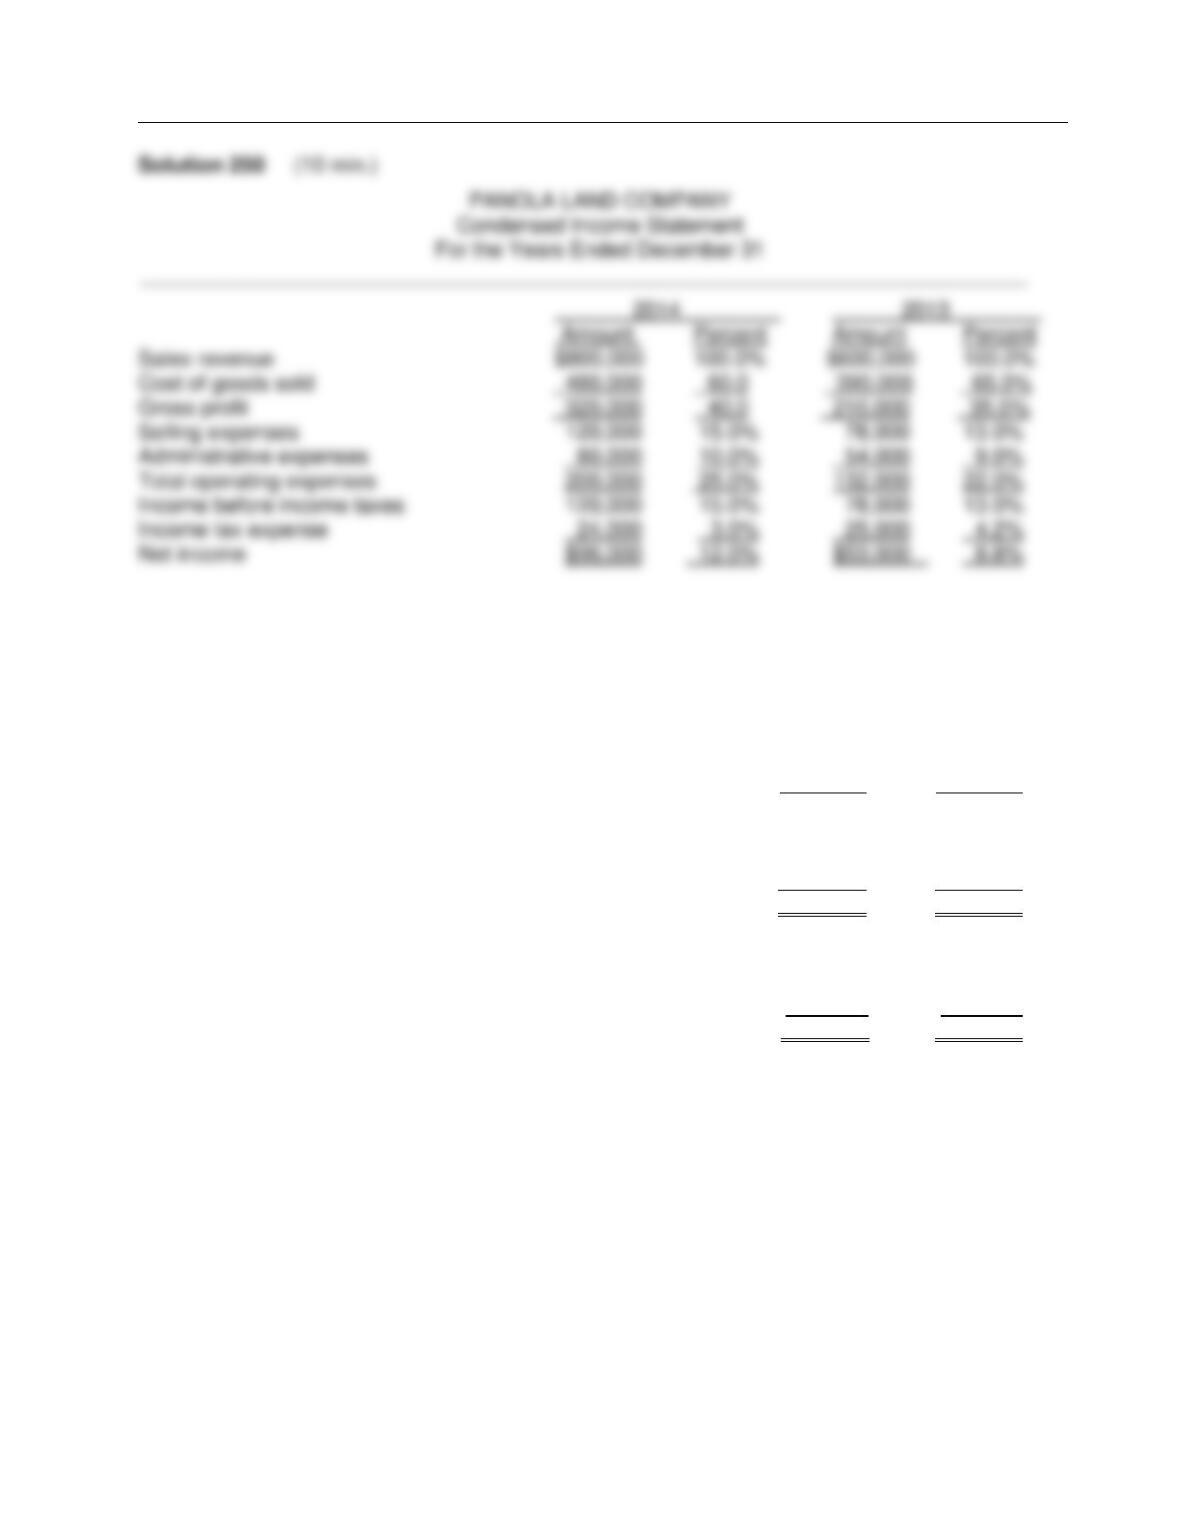
Financial Analysis: The Big Picture
FOR INSTRUCTOR USE ONLY
13–77
Ex. 251
Armada Company has these comparative balance sheet data:
ARMADA COMPANY
Balance Sheets
December 31,
2014 2013
Cash $ 40,000 $ 30,000
Accounts receivable (net) 65,000 60,000
Inventories 60,000 50,000
Plant assets (net) 185,000 180,000
$350,000 $320,000
Accounts payable $ 50,000 $ 60,000
Mortgage payable (15%, due in 15 years) 100,000 100,000
Common stock, $10 par 140,000 120,000
Retained earnings 60,000 40,000
$350,000 $320,000
Additional information for 2014:
1. Net income was $25,000.
2. Sales on account were $450,000. Sales returns and allowances amounted to $25,000.
3. Cost of goods sold was $275,000.
4. Net cash provided by operating activities was $49,000.
5. Capital expenditures were $23,000, and cash dividends were $18,000.
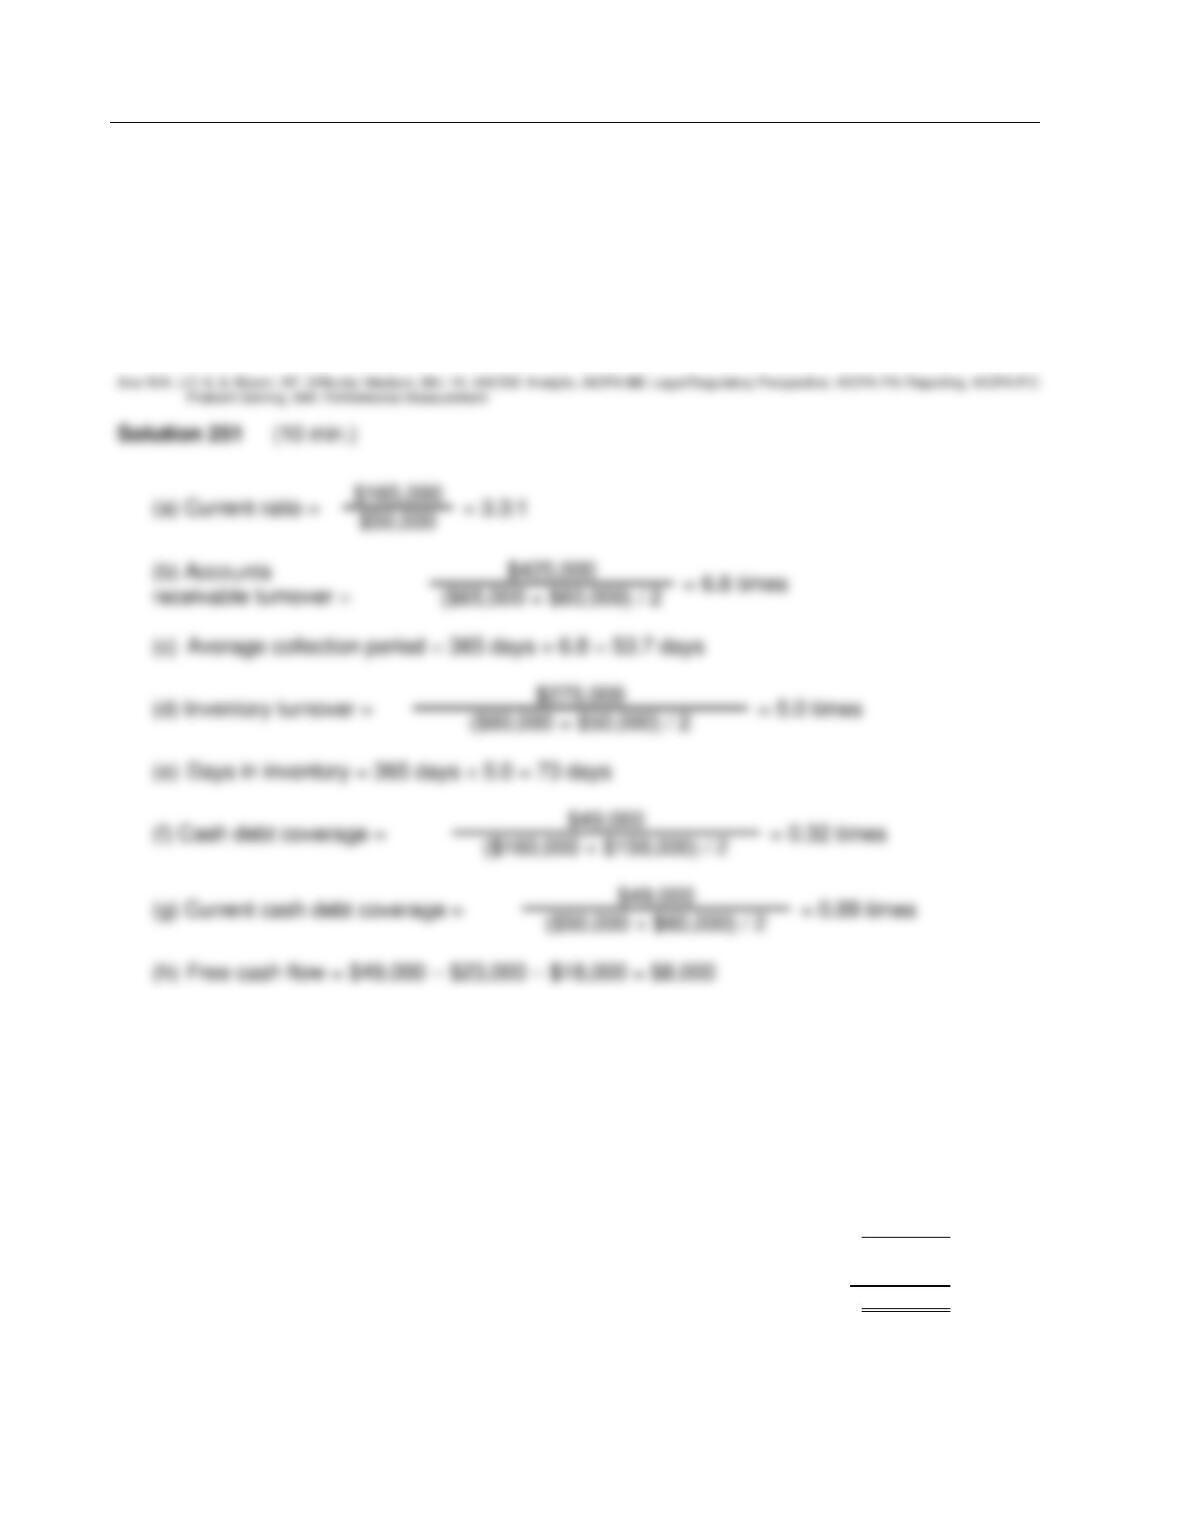
Test Bank for Accounting: Tools for Business Decision Making, Fifth Edition
FOR INSTRUCTOR USE ONLY
13–78
Ex. 251 (Cont.)
Instructions
Compute the following ratios at December 31, 2014.
(a) Current. (e) Days in inventory
(b) Accounts receivable turnover. (f) Cash debt coverage.
(c) Average collection period. (g) Current cash debt coverage.
(d) Inventory turnover. (h) Free cash flow.
Ex. 252
Here is the income statement for Ginsberg, Inc.
GINSBERG, INC.
Income Statement
For the Year Ended December 31, 2014
___________________________________________________________________________
Sales revenue $400,000
Cost of goods sold 250,000
Gross profit 150,000
Expenses (including $12,000 interest and $22,000 income taxes) 100,000
Net income $ 50,000
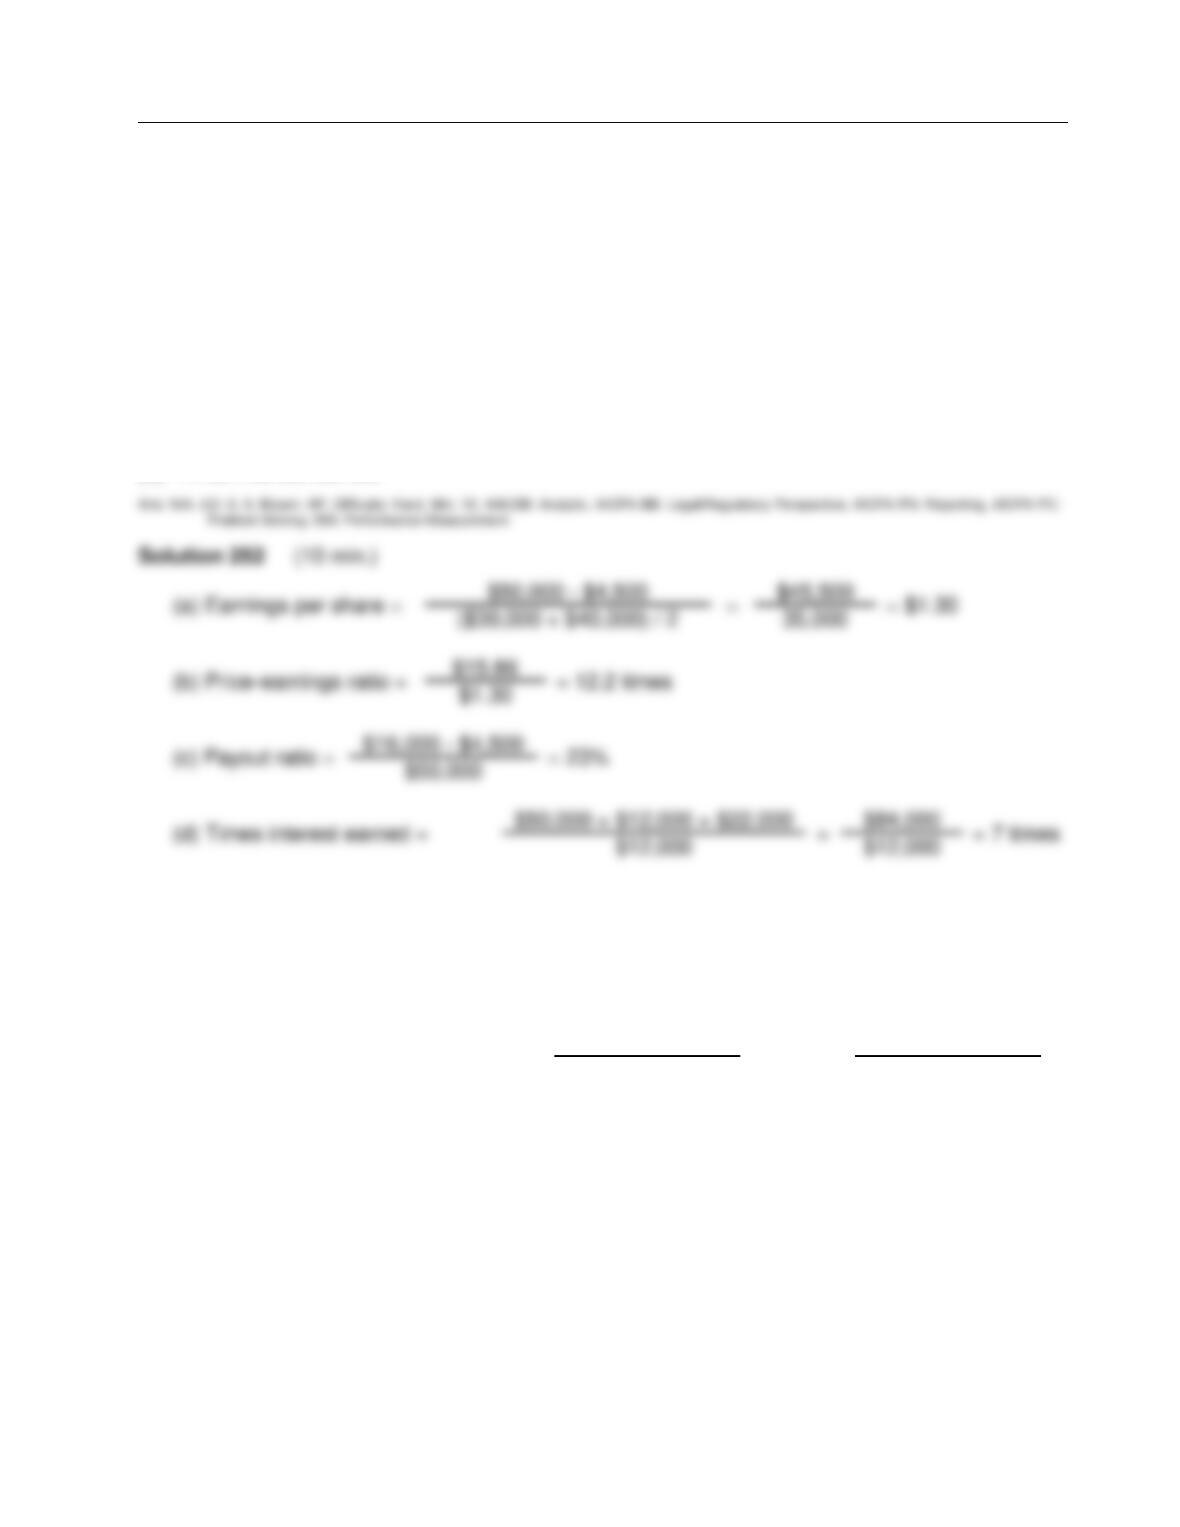
Financial Analysis: The Big Picture
FOR INSTRUCTOR USE ONLY
13–79
Ex. 252 (Cont.)
Additional information:
1. Common stock outstanding January 1, 2014, was 30,000 shares, and 40,000 shares were
outstanding at December 31, 2014.
2. The market price of Gillman, Inc., stock was $15.86 in 2014.
3. Cash dividends of $16,000 were paid, $4,500 of which were to preferred stockholders.
Instructions
Compute the following measures for 2014.
(a) Earnings per share.
(b) Price-earnings ratio.
(c) Payout ratio.
(d) Times interest earned.
Ex. 253
Belcanto Corporation experienced a fire on December 31, 2014, in which its financial records were
partially destroyed. It has been able to salvage some of the records and has ascertained the
following balances.
December 31, 2014 December 31, 2013
Cash $ 40,000 $ 15,000
Accounts receivable (net) 84,000 126,000
Inventory 200,000 180,000
Accounts payable 50,000 10,000
Notes payable 30,000 20,000
Common stock, $100 par 400,000 400,000
Retained earnings 170,000 101,000
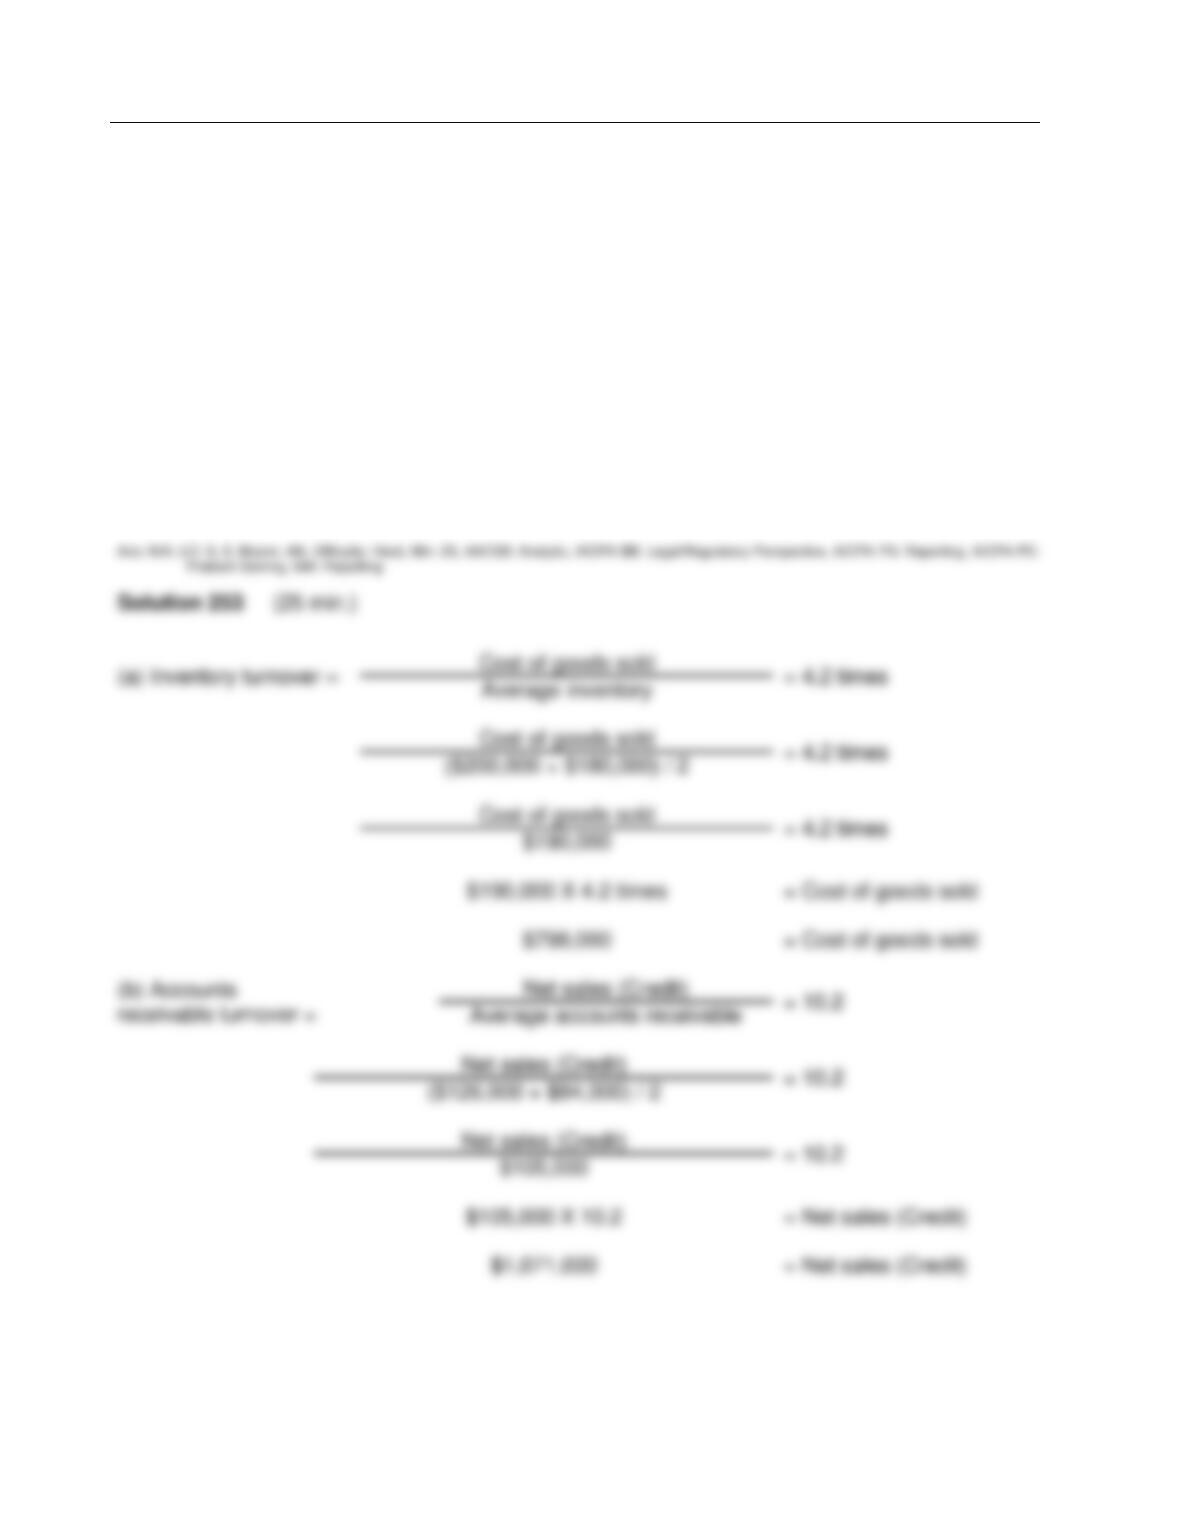
Test Bank for Accounting: Tools for Business Decision Making, Fifth Edition
FOR INSTRUCTOR USE ONLY
13–80
Ex. 253 (Cont.)
Additional information:
1. The inventory turnover is 4.2 times
2. The return on common stockholders‘ equity is 14%. The company had no additional paid-in–
capital.
3. The accounts receivable turnover is 10.2 times.
4. The return on assets is 12.5%.
5. Total assets, Dec. 31, 2013 = 604,750.
Instructions
Compute the following values for 2014.
(a) Cost of goods sold.
(b) Net credit sales.
(c) Net income.
(d) Total assets.
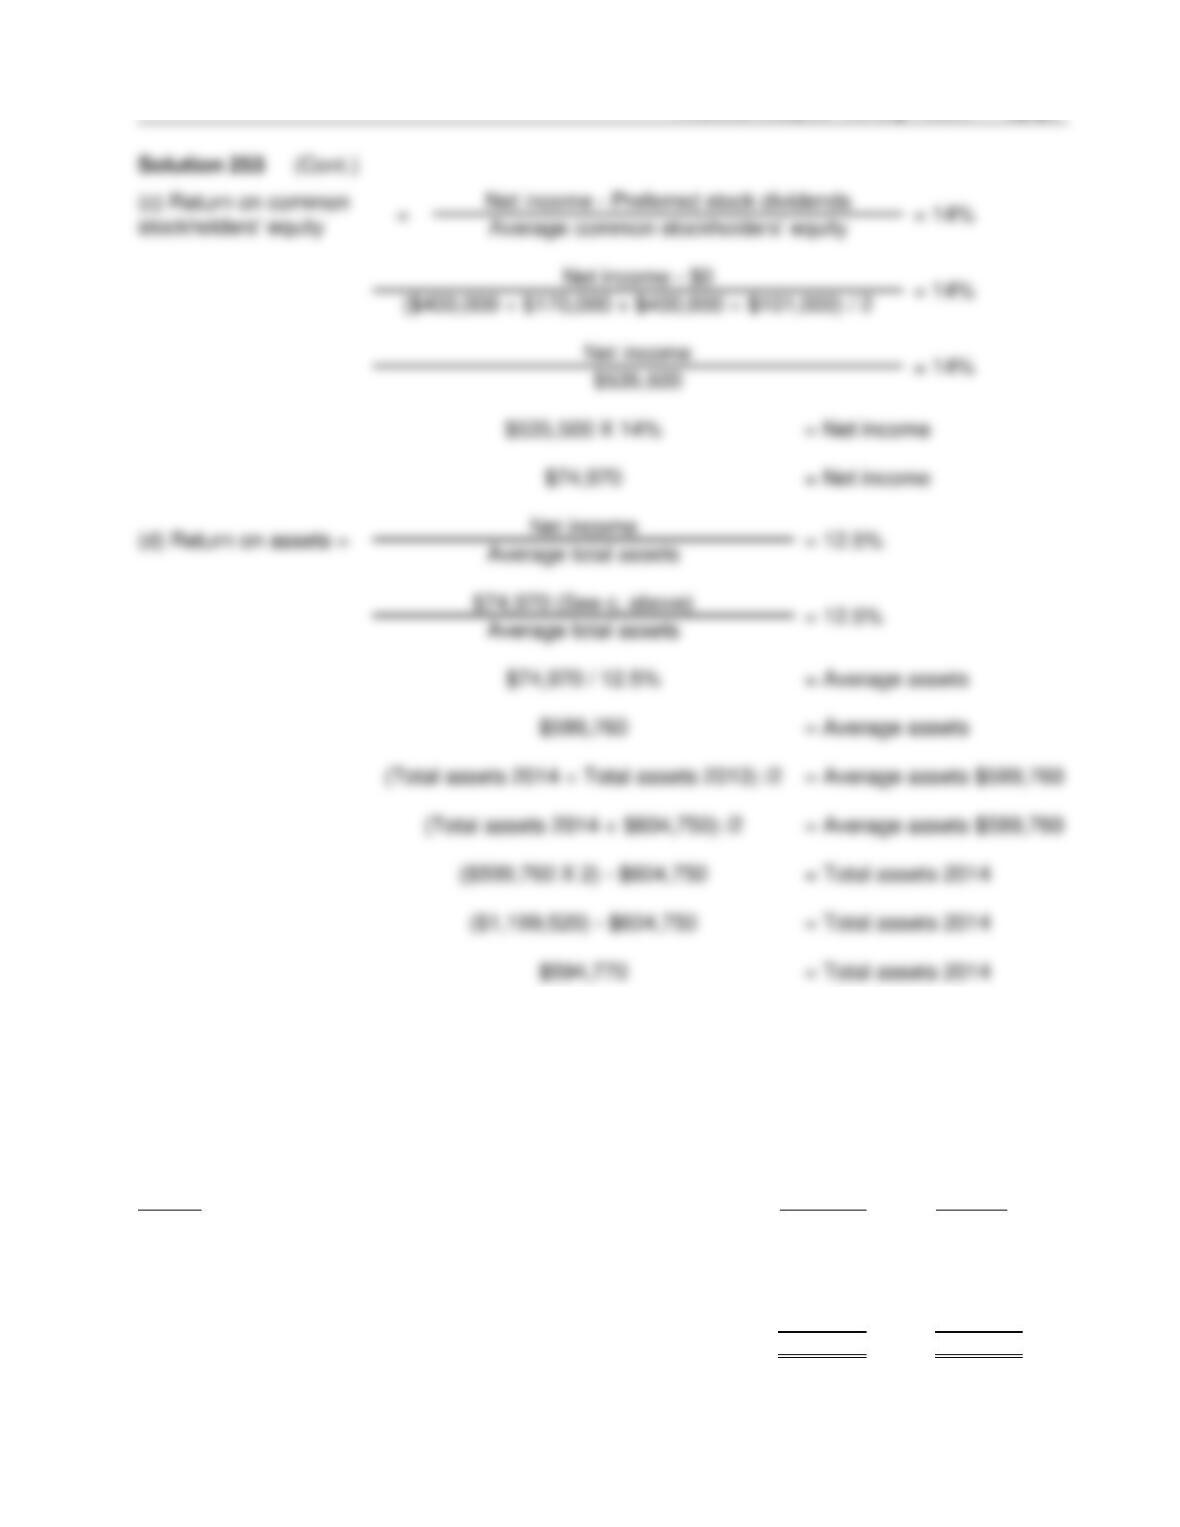
Financial Analysis: The Big Picture
FOR INSTRUCTOR USE ONLY
13–81
Ex. 254
The financial statements of Elcamino Company appear below:
ELCAMINO COMPANY
Comparative Balance Sheet
December 31,
___________________________________________________________________________
Assets 2014 2013
Cash …………………………..……………………………………………………. $ 25,000 $ 40,000
Debt investments ……………………………………………………………….. 20,000 60,000
Accounts receivable (net) …………………………………………………….. 50,000 30,000
Inventory …………………………………………………………………………… 140,000 170,000
Property, plant and equipment (net) ………………………………………. 170,000 200,000
Total assets …………………………..……………………………………… $405,000 $500,000

Test Bank for Accounting: Tools for Business Decision Making, Fifth Edition
FOR INSTRUCTOR USE ONLY
13–82
Ex. 254 (Cont.)
Liabilities and stockholders’ equity
Accounts payable ……………………………………………………………….. $ 25,000 $ 30,000
Short-term notes payable …………………………………………………….. 40,000 90,000
Bonds payable ……………………………………………………………………. 75,000 160,000
Common stock …………………………………………………………………… 160,000 145,000
Retained earnings ………………………………………………………………. 105,000 75,000
Total liabilities and stockholders’ equity ……………………………… $405,000 $500,000
ELCAMINO COMPANY
Income Statement
For the Year Ended December 31, 2014
Net sales (all on credit) ………………………………………………………… $360,000
Cost of goods sold ………………………………………………………………. 184,000
Gross profit ………………………………………………………………………… 176,000
Expenses
Interest expense ……………………………………………………………. $11,000
Selling expenses …………………………………………………………… 30,000
Administrative expenses …………………………………………………. 20,000
Total expenses ………………………………………………………… 61,000
Income before income taxes …………………………………………………. 115,000
Income tax expense ……………………………………………………………. 35,000
Net income ………………………………………………………………………… $ 80,000
Additional information:
a. Cash dividends of $50,000 were declared and paid on common stock in 2014.
b. Weighted-average number of shares of common stock outstanding during 2014 was 50,000
shares.
c. Market value of common stock on December 31, 2014, was $16 per share.
d. Net cash provided by operating activities for 2014 was $70,000.
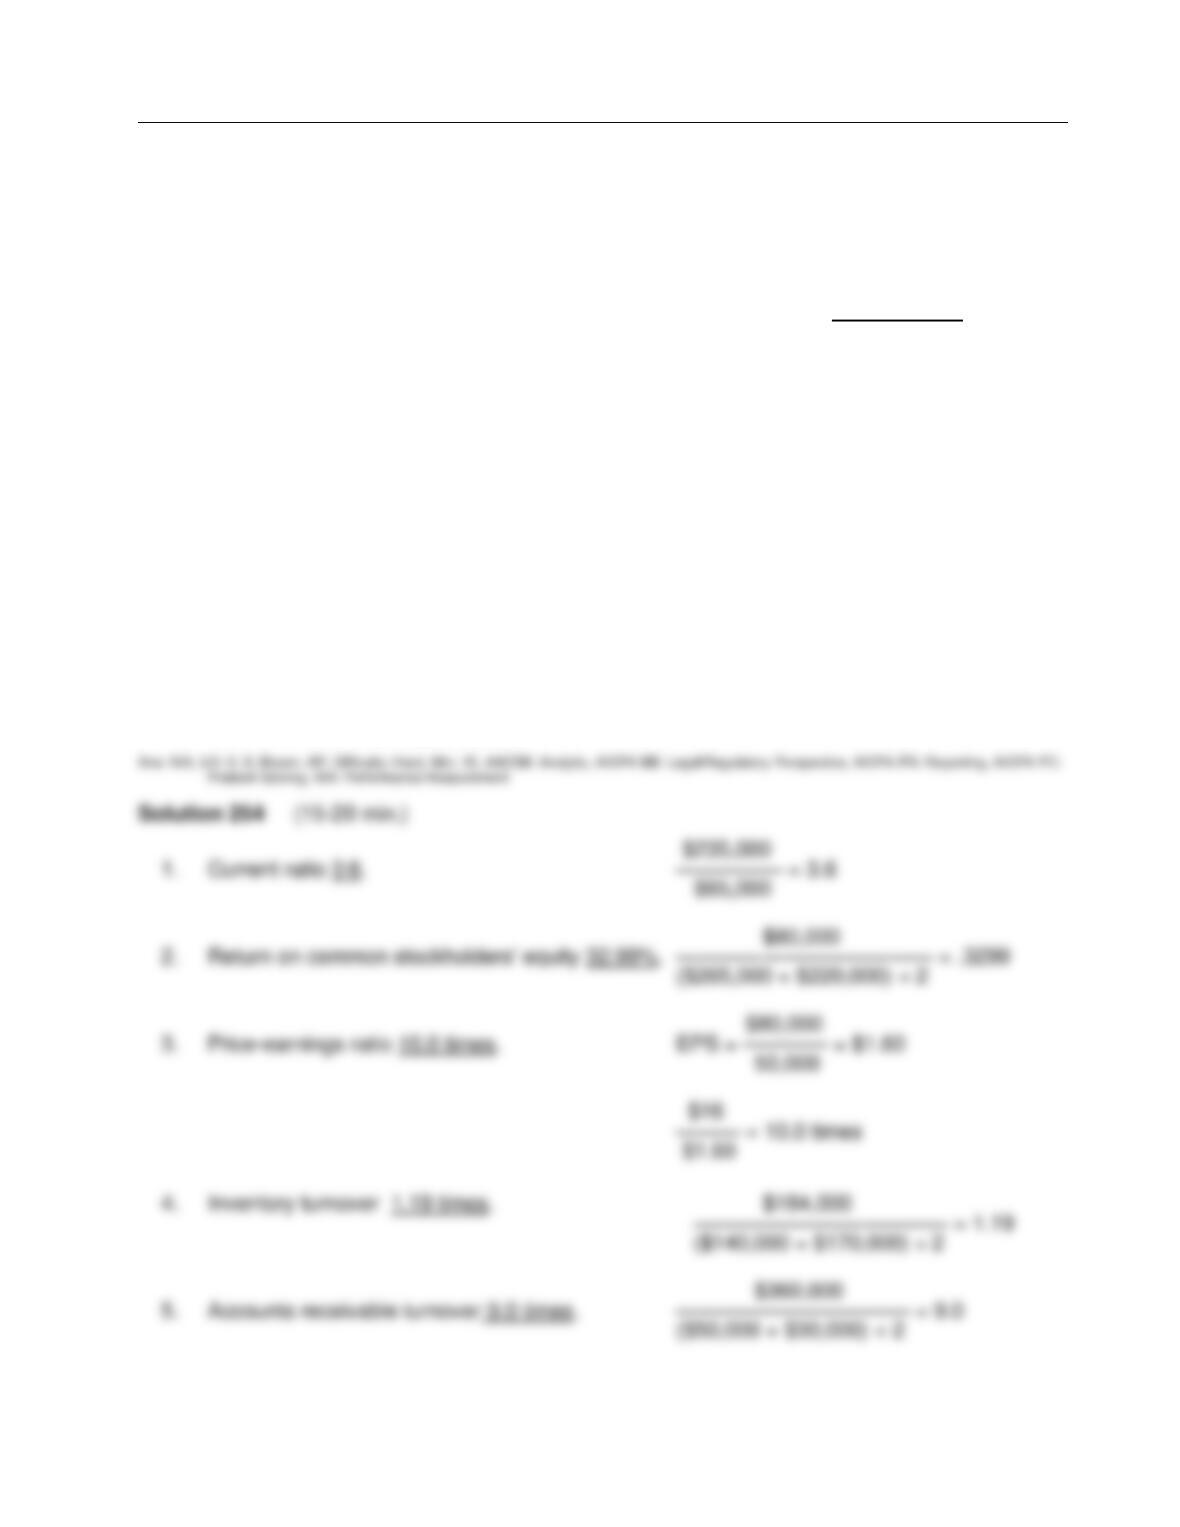
Financial Analysis: The Big Picture
FOR INSTRUCTOR USE ONLY
13–83
Ex. 254 (Cont.)
Instructions
Using the financial statements and additional information, compute the following ratios for the
Lewis Company for 2012. Show all computations.
Computations
1. Current ratio _________.
2. Return on common stockholders’ equity _________.
3. Price-earnings ratio _________.
4. Inventory turnover _________.
5. Accounts receivable turnover _________.
6. Times interest earned _________.
7. Profit margin _________.
8. Average days in inventory _________.
9. Payout ratio _________.
10. Return on assets _________.
11. Cash debt coverage _________.
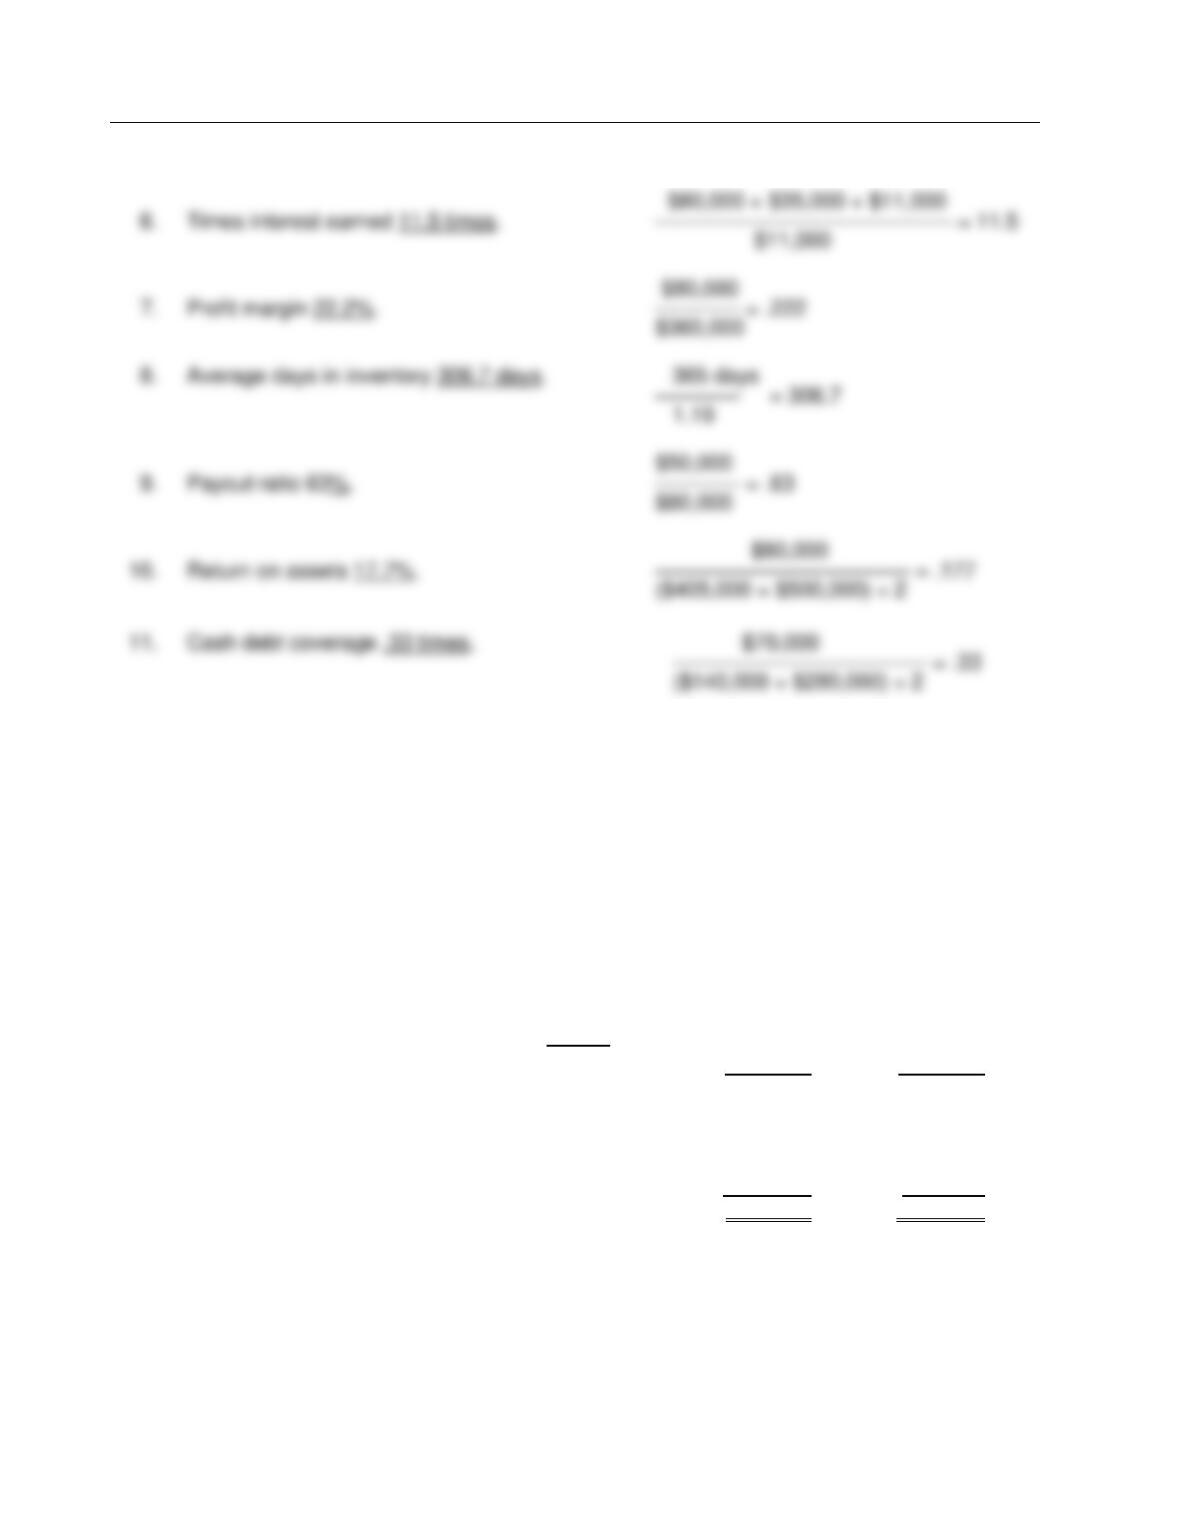
Test Bank for Accounting: Tools for Business Decision Making, Fifth Edition
FOR INSTRUCTOR USE ONLY
13–84
Solution 254 (Cont.)
Ex. 255
The following ratios have been computed for Southern Company for 2014.
Profit margin ratio 20%
Times interest earned 12 times Current ratio 2.5:1
Accounts receivable turnover 5 times Debt to assets ratio 24%
The 2014 financial statements for Southern Company with missing information follows:
SOUTHERN COMPANY
Comparative Balance Sheet
December 31,
——————————————————————————————————————————
Assets
2014 2013
Cash ……………………………………………………………………………. $ 25,000 $ 35,000
Debt Investments …………………………………………………………… 15,000 15,000
Accounts receivable (net) ……………………………………………….. ? (6) 50,000
Inventory ……………………………………………………………………… ? (7) 50,000
Property, plant, and equipment (net) ………………………………… 200,000 160,000
Total assets ……………………………………………………………. $ ? (8) $310,000
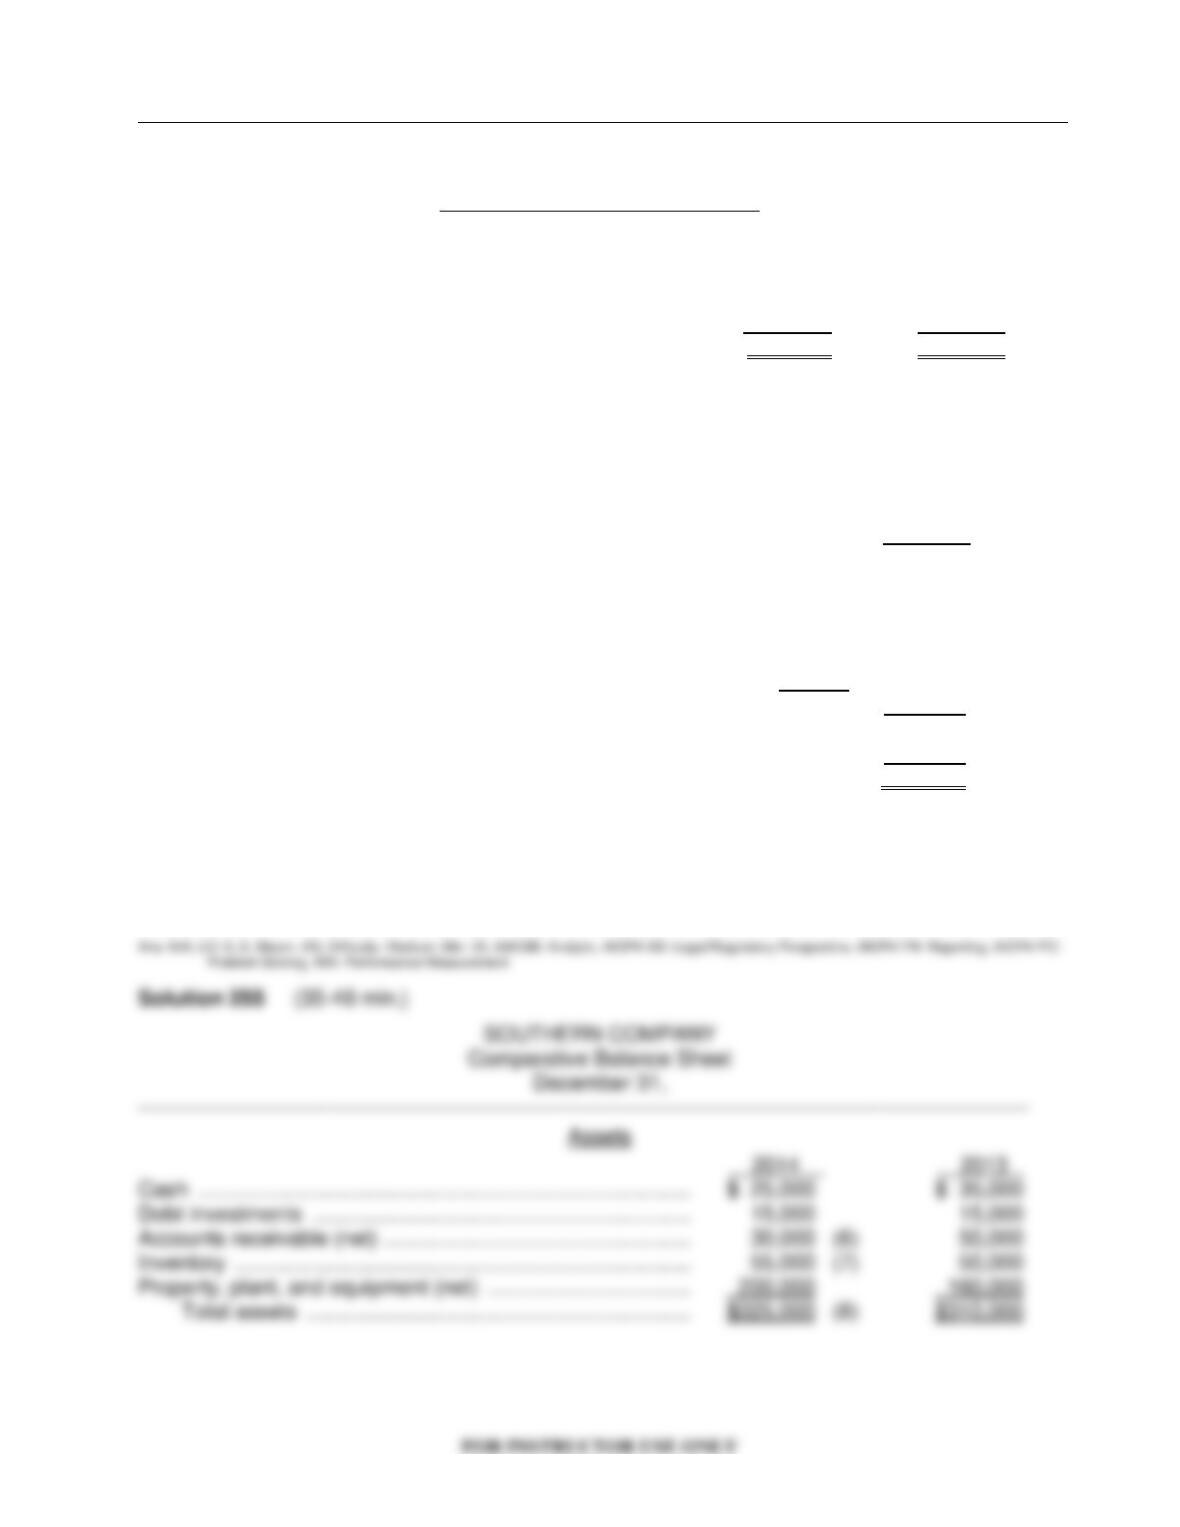
Financial Analysis: The Big Picture
13–85
Ex. 255 (Cont.)
Liabilities and stockholders’ equity
Accounts payable …………………………………………………………… $ 15,000 $ 25,000
Short-term notes payable ………………………………………………… 35,000 30,000
Bonds payable ………………………………………………………………. ? (9) 20,000
Common stock ……………………………………………………….……… 200,000 200,000
Retained earnings ………………………………………………………….. 47,000 35,000
Total liabilities and stockholders’ equity ……………………….. $ ? (10) $310,000
SOUTHERN COMPANY
Income Statement
For the Year Ended December 31, 2014
——————————————————————————————————————————
Net sales ………………………………………………………………………. $200,000
Cost of goods sold …………………………………………………………. 100,000
Gross profit ……………………………………………………………………. 100,000
Expenses:
Depreciation expense ………………………………………………… $ ? (5)
Interest expense ……………………………………………………….. 5,000
Selling expenses ………………………………………………………. 10,000
Administrative expenses ……………………………………………. 15,000
Total expenses ……………………………………………………. ? (4)
Income before income taxes ……………………………………………. ? (2)
Income tax expense ………………………………………………….. ? (3)
Net income ……………………………………………………………………. $ ? (1)
Instructions
Use the above ratios and information from the Southern Company financial statements to fill in the
missing information on the financial statements. Follow the sequence indicated. Show
computations that support your answers.
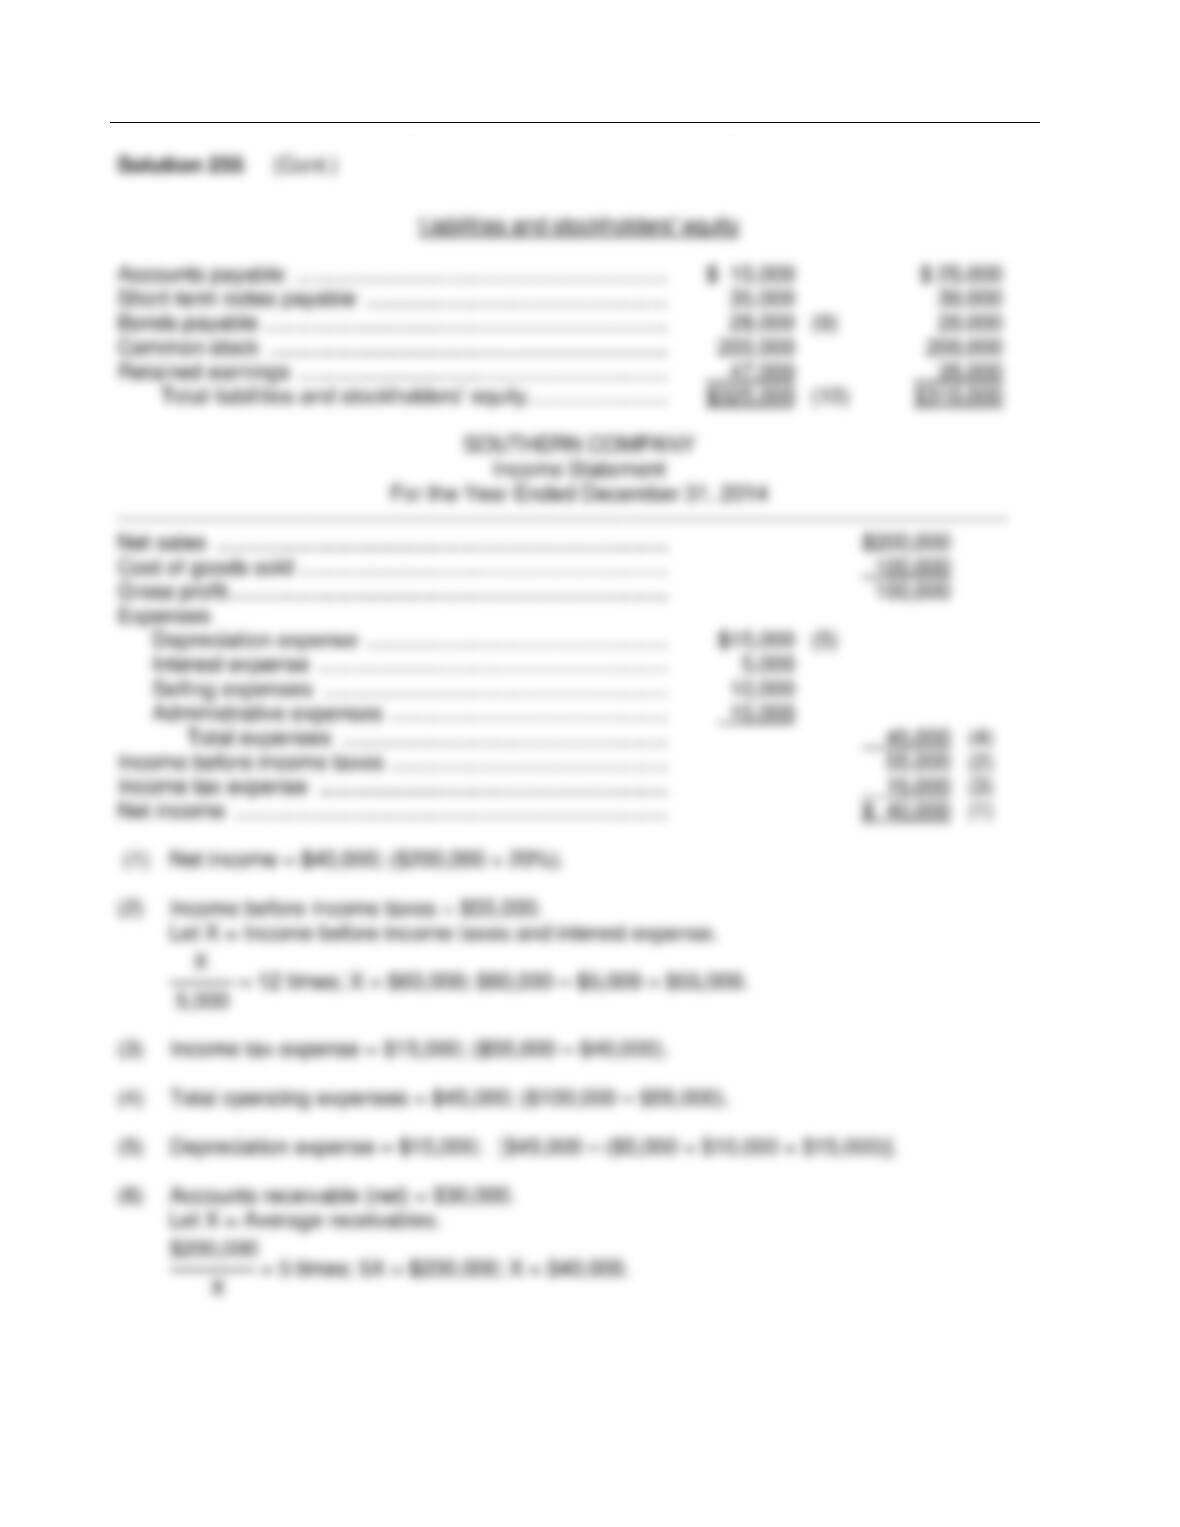
Test Bank for Accounting: Tools for Business Decision Making, Fifth Edition
FOR INSTRUCTOR USE ONLY
13–86
Financial Analysis: The Big Picture
FOR INSTRUCTOR USE ONLY
13–87
Ex. 256
B. Jones Corporation has issued common stock only. The company has been successful and has
a gross profit rate of 20%. The information shown below was taken from the company’s financial
statements.
Beginning inventory $ 482,000
Purchases 4,346,000
Ending inventory ?
Average accounts receivable 700,000
Average common stockholders’ equity 3,100,000
Sales revenue (all on credit) 5,600,000
Net income 341,000
Instructions
Compute the following:
(a) Accounts receivable turnover and the average number of days required to collect the
accounts receivable.
(b) The inventory turnover and the average days in inventory.
(c) Return on common stockholders’ equity.
Test Bank for Accounting: Tools for Business Decision Making, Fifth Edition
13–88
COMPLETION STATEMENTS
257. Discontinued operations refers to the disposal of a __________________ of a business.
258. The two criteria necessary for an item to be classified as an extraordinary item are that the
transaction or event must be (1) _______________ and (2) ________________.
259. A change in depreciation methods during the year would be classified as a change in
____________________.
Financial Analysis: The Big Picture
13–89
260. ______________ analysis, also called trend analysis, is a technique for evaluating a series
of financial statement data over a period of time.
261. Expressing each item in a financial statement as a percent of a base amount is called
______________ analysis.
262. For analysis of the financial statements, ratios can be classified into three types:
(1)_____________ ratios, (2)_____________ ratios, and (3)______________ ratios.
263. The times interest earned is calculated by dividing ___________________ before
__________________ and __________________ by interest expense.
264. The liquidity ratio, known as the _______________ ratio, has a disadvantage that it uses
year-end balances for current assets and current liabilities. The ___________ partially
corrects for this problem by using cash provided by operating activities and average
current liabilities rather than point in time numbers.
265. The accounts receivable turnover is calculated by dividing ________________ by average
___________________.
266. If the inventory turnover is 7.3 times, and the average inventory was $600,000, the cost of
goods sold during the year was $______________ and the average days to sell the
inventory was ______________ days.
267. Hobson Corporation had net sales for the year of $300,000 and average total assets of
$200,000. The asset turnover is ____________ times.
268. The ______________ ratio measures the percentage of earnings distributed in the form of
cash dividends.
269. The lower the _______________ to _______________ ratio, the more equity “buffer” is
available to the creditors if the company becomes insolvent.
Test Bank for Accounting: Tools for Business Decision Making, Fifth Edition
13–90
Answers to Completion Statements
MATCHING
SET A
270. For each of the ratios listed below, indicate by the appropriate code letter, whether it is a
liquidity ratio, a profitability ratio, or a solvency ratio.
Code:
L = Liquidity ratio
P = Profitability ratio
S = Solvency ratio
____ 1. Price-earnings ratio
____ 2. Return on assets
____ 3. Accounts receivable turnover ratio
____ 4. Earnings per share
____ 5. Payout ratio
____ 6. Current cash debt coverage
____ 7. Current ratio
____ 8. Debt to assets ratio
____ 9. Free cash flow
____ 10. Inventory turnover
Financial Analysis: The Big Picture
FOR INSTRUCTOR USE ONLY
13–91
SET B
271. Match the ratios with their formulas by entering the appropriate letter in the space provided.
A. Current ratio F. Times interest earned
B. Current cash debt coverage G. Inventory turnover
C. Profit margin H. Average collection period
D. Asset turnover I. Average days in inventory
E. Price-earnings ratio J. Payout ratio
____ 1.
Cost of goods sold
Average inventory
____ 2.
Net income
Net sales
____ 3.
Cash dividends declared on common stock
Net income
____ 4.
Net sales
Average total assets
____ 5.
Current assets
Current liabilities
____ 6.
365 days
Accounts receivable turnover
____ 7.
Market price per share of stock
Earnings per share
____ 8.
365 days
Inventory turnover
____ 9.
Income before income taxes and interest expense
Interest expense
____ 10.
Net cash provided by operating activities
Average current liabilities
Test Bank for Accounting: Tools for Business Decision Making, Fifth Edition
FOR INSTRUCTOR USE ONLY
13–92
SHORT-ANSWER ESSAY QUESTIONS
S-A E 272
Explain sustainable income. What relationship does this concept have to the treatment of irregular
items on the income statement?
S-A E 273
What issues must be considered when determining whether or not a loss from earthquake
destruction should be treated as an extraordinary item?
S-A E 274
Tim Forsyth, the CEO of Magical Products, is a successful entrepreneur and his focus is his
products, not his accounting system. He asks you to explain to him, in a memo, the bases of
comparison for ratio analysis.
There are three bases of comparison for ratio analysis. They include:
Intra-company: This basis compares a ratio for the current year to the same ratio for one or more
prior years.
Inter-company: This basis compares a ratio for one company with the same ratio for one or more
competing companies.
Industry averages: This basis compares a ratio for a company with the industry average for the
same ratio.
Financial Analysis: The Big Picture
FOR INSTRUCTOR USE ONLY
13–93
S-A E 275
Horizontal and vertical analyses are analytical tools frequently used to analyze financial
statements. What type of information or insights can be obtained by using these two techniques?
Explain how the output of horizontal analysis and vertical analysis can be compared to industry
averages and/or competitive companies.
S-A E 276
What does each type of ratio measure?
(a) Liquidity ratios.
(b) Solvency ratios.
(c) Profitability ratios.
S-A E 277
Identify and explain factors that affect quality of earnings.
Test Bank for Accounting: Tools for Business Decision Making, Fifth Edition
FOR INSTRUCTOR USE ONLY
13–94
S-A E 278 (Communication)
Zip Delivery specializes in the overnight transportation of medical equipment and laboratory
specimens. The company has selected the following information from its most recent annual
report to be the subject of an immediate press release.
• The financial statements are being released.
• Net income this year was $3.1 million. Last year’s net income had been $2.8 million.
• The current ratio has changed to 2:1 from last year’s 1.6:1.
• The debt to assets ratio has changed to 4:6 from last year’s 3:6.
• The company expanded its truck fleet substantially by purchasing ten new delivery vans.
• The company already had twelve delivery vans. The company is now the largest medical
courier in the mid-Atlantic region.
Required:
Prepare a brief press release incorporating the above information. Include all information. Think
carefully which information (if any) is good news for the company, and which (if any) is bad news.
Financial Analysis: The Big Picture
13–95
IFRS QUESTIONS
1. Under IFRS, there is no classification for
a. changes in accounting estimates.
b. changes in accounting principles.
c. discontinued operations.
d. extraordinary items.
2. The accounting for each of the following is the same under IFRS and GAAP except for
a. extraordinary items.
b. discontinued operations.
c. changes in accounting principles.
d. changes in accounting estimates.
3. Distinguishing normal levels of income from irregular items is of interest for the
FASB IASB
a. no no
b. no yes
c. yes no
d. yes yes
4. All revenue and expense items are considered ordinary in nature under
a. both IFRS and GAAP.
b. GAAP.
c. IFRS.
d. neither IFRS or GAAP.
5. Under IFRS, the statement of comprehensive income can be prepared under
a. the one-statement approach only.
b. the two-statement approach only.
c. either the one-statement approach or the two-statement approach.
d. either the two-statement approach or the stockholders’ equity statement approach.
6. Under IFRS, the components of other comprehensive income can be reported in each of the
following ways except
a. the one-statement approach.
b. the two-statement approach.
c. the statement of stockholders’ equity approach.
d. All of the above are acceptable.
Test Bank for Accounting: Tools for Business Decision Making, Fifth Edition
13–96
7. Which of the following is not an acceptable way of displaying the components of other
comprehensive income?
a. Combined statement of retained earnings
b. Second income statement
c. Combined statement of comprehensive income
d. All of these answer choices are acceptable.
8. Under IFRS, other comprehensive income must be displayed(reported) in
a. the equity section of the statement of financial position.
b. a second income income statement.
c. the income statement.
d. the retained earnings statement.