Chapter 13: Financial Statement Analysis
191. Kim Chen Corporation is a wholesaler of scuba gear. During 2016, Chen expanded its retail business by adding
over 50 dive shops. The following information is obtained from the comparative financial statements included in the
company‘s 2016 annual report (all amounts are in thousands of dollars):
Total liabilities
Dec. 31, 2016
$26,000
Dec. 31,2015
$18,000
Total stockholders‘ equity
34,000
38,000
FOR THE FISCAL YEARS ENDED
Depreciation expense
Dec. 31, 2016
$2,000
Dec. 31, 2015
$6,000
Interest expense
3,400
3,200
Income tax expense
12,600
18,100
Net income
6,000
15,000
Net cash provided by (used by) operations
41,000
(400)
Total dividends paid
2,000
12,000
Cash used to purchase plant assets
32,000
18,000
Payments on long-term debt
1,600
1,800
1) Using the information provided above, compute the
following for 2016 and 2015:
A. Debt-to-equity ratio (at each year-end)
B. Times interest earned ratio
2) Comment briefly on the company’s solvency.
3) What other ratios will help you assess the solvency? What information will they provide that you do not already
have concerning the company’s solvency?
Chapter 13: Financial Statement Analysis
192. The following information is available from the balance sheets at the end of 2016 and 2015 for Riverside Company:
2016
2015
Accounts payable
$ 80,000
$ 40,000
Accrued liabilities
65,000
25,000
Taxes payable
10,000
20,000
Short-term notes payable
-0-
60,000
Bonds payable due within next year
200,000
200,000
Total current liabilities
$ 355,000
$ 345,000
Bonds payable
$ 800,000
$ 300,000
Common stock, $5 par
$1,000,000
$1,000,000
Retained earnings
695,000
55,000
Total stockholders’ equity
$1,695,000
$1,055,000
Total liabilities and stockholders’ equity
$2,850,000
$1,700,000
Net income for 2016 and 2015 was $340,000 and $300,000, respectively. Answer the following:
A) Calculate the return on common stockholders’ equity ratio for 2016.
B) What information is provided to users with the calculation in part A? Explain.
C) What is the difference between the return on stockholders’ equity ratio and the return on assets ratio?
Chapter 13: Financial Statement Analysis
193. The following information is available from the balance sheets at the end of 2016 and 2015 for Kitchen Equipment
Company.
2016
2015
Accounts payable
$ 120,000
$ 100,000
Accrued liabilities
35,000
30,000
Taxes payable
40,000
10,000
Short-term notes payable
-0–
80,000
Bonds payable due within next year
300,000
100,000
Total current liabilities
$ 495,000
$ 320,000
Bonds payable
$ 600,000
$ 500,000
Common stock, $5 par
$ 800,000
$ 800,000
Retained earnings
200,000
100,000
Total stockholders‘ equity
$1,000,000
$ 900,000
Total liabilities and stockholders‘ equity
$2,095,000
$1,720,000
Net income for 2016 and 2015 was $120,000 and $460,000, respectively. No stock was issued during either year.
Answer the following:
A) How many shares of stock are outstanding at the end of 2016?
B) If a company has preferred stock, why are preferred dividends subtracted when computing earnings per
share?
C) What is the amount of earnings per share for the year ended December 31, 2016?
D) Explain what information is provided with earnings per share.
Chapter 13: Financial Statement Analysis
Knife Corp.
Use the selected data presented below from the financial statements of Knife Corp. for 2016 and 2015 to answer
the questions that follow.
2016
2015
Net income
$110,000
$123,000
Cash dividends paid on preferred stock
$12,000
$15,000
Cash dividends paid on common stock
$42,000
$38,000
Weighted average number of common shares outstanding
105,000
95,000
Market price per share of common stock at the end of the year
$16.00
$13.00
194. Refer to the data for Knife Corp.
EQUIRED:
(A) Calculate earnings per share for 2016 for Knife. Why is this considered one of the most quoted ratios for public
companies? Which investors, common or preferred or both, desire this information?
(B) Calculate the price/earnings ratio for 2016 for Knife. Why is this ratio important to investors? Explain.
195. Refer to the data for Knife Corp.
REQUIRED:
(A) Calculate the dividend yield ratio for 2016 for Knife. Explain.
(B) What factors could have caused the change in the market value of Knife’s stock from 2015 to 2016? Explain.
Chapter 13: Financial Statement Analysis
St. Petersburg Corporation
Use the information obtained from the comparative financial statements included in the St. Petersburg Corporation’s
2016 annual report that is presented below to answer the questions that follow. All amounts are in thousands of
dollars.
Dec. 31, 2015
Dec. 31, 2015
Total assets
$800,000
$975,000
Total common stockholders‘ equity
405,000
578,000
Total stockholders’ equity
504,000
702,000
December 31
FOR THE FISCAL YEARS ENDED
2016
2015
Interest expense, net of tax
$ 5,000
$ 4,700
Interest expense
6,100
5,800
Income tax expense
22,600
32,600
Net income
110,000
27,000
Common dividends
12,600
7,200
Net sales
2,667,600
1,971,000
Preferred dividends
9,000
14,400
196. Refer to the financial information for St. Petersburg Corporation.
REQUIRED:
(A) Calculate the return on assets ratio for St. Petersburg for 2016. What is the reason for the adjustment of
interest?
(B) Calculate the return on common stockholders’ equity ratio for 2016 for St. Petersburg. What is the reason for
the adjustment of preferred dividends?
Chapter 13: Financial Statement Analysis
197. Refer to the financial information for St. Petersburg Corporation.
REQUIRED:
(A) Identify the two components of the return on assets ratio for St. Petersburg. Explain the change in the return on
assets ratio during 2016 as it relates to these components.
(B) During 2016, how much is St. Petersburg’s average cost of borrowed capital as compared to the cost of the
money provided by the preferred stockholders? Which is the more profitable? Explain.
198. Refer to the financial information for St. Petersburg Corporation.
REQUIRED:
During 2016, has St. Petersburg successfully employed favorable leverage based on the average cost of capital?
What action should the company take?
Chapter 13: Financial Statement Analysis
199. Refer to the financial information for St. Petersburg Corporation.
REQUIRED:
Calculate the earnings per share for St. Petersburg for 2016 and 2015 assuming an average of 100,000 common
shares were outstanding during 2016 and an average of 80,000 common shares were outstanding during 2015.
Explain the change as it probably relates to the market value of the stock.
200. Starlight Cruises reported net income of $2,880 million for the year ended December 31, 2016. Total stockholders’
equity for the year ended December 31, 2016 was $20,100 million and on December 31, 2015, it was $20,900
million. No preferred stock was outstanding in either year.
REQUIRED:
1. Compute Starlight’s return on common stockholders’ equity for the year ended December 31, 2016.
2. What other ratio would you want to compute to decide whether Starlight is successfully employing leverage?
Explain your answer.

Chapter 13: Financial Statement Analysis
201. The following selected data are taken from the financial statements of Ulysses Company:
REQUIRED:
1. Compute the following ratios for Ulysses Company:
a. Return on sales
b. Asset turnover (Assume that total assets at the beginning of the year were $1,600,000.) Round final answers
to 3 decimals.
c. Return on assets
d. Return on common stockholders’ equity (Assume that the only changes in stockholders’ equity during the
year were from the net income for the year and dividends on the preferred stock.)
2. Comment on Ulysses’ use of leverage. Has it successfully employed leverage?
Explain.
Sales revenue
$650,000
Cost of goods sold
300,000
Gross profit
$350,000
Selling and administrative expense
150,000
Operating income
$200,000
Interest expense
75,000
Income before tax
$125,000
Income tax expense (40%)
50,000
Net income
$75,000
Accounts payable
$55,000
Accrued liabilities
70,000
Income taxes payable
10,000
Interest payable
25,000
Short-term loans payable
200,000
Total current liabilities
$360,000
Long-term bonds payable
$600,000
Preferred stock, 10%, $100 par
$250,000
Common stock, no par
600,000
Retained earnings
550,000
Total stockholders’ equity
$1,400,000
Total liabilities and stockholders’ equity
$2,360,000
Chapter 13: Financial Statement Analysis
Chapter 13: Financial Statement Analysis
202. The Stockholders’ Equity section of the balance sheet for Grant Corp. at the end of 2016 appears as follows:
7%, $100 par, cumulative preferred stock, 200,000 shares
authorized, 55,000 shares issued and outstanding $5,500,000
Additional paid-in capital on preferred 2,500,000
Common stock, $5 par, 500,000 shares authorized,
420,000 shares issued and outstanding 2,100,000
Additional paid-in capital on common 18,000,000
Retained earnings 32,500,000
Total stockholders’ equity $60,600,000
Net income for the year was $1,250,000. Dividends were declared and paid on the preferred shares during the year,
and a quarterly dividend of $0.30 per share was declared and paid each quarter on the common shares. The closing
market price for the common shares on December 31, 2016, was $24.72 per share.
REQUIRED:
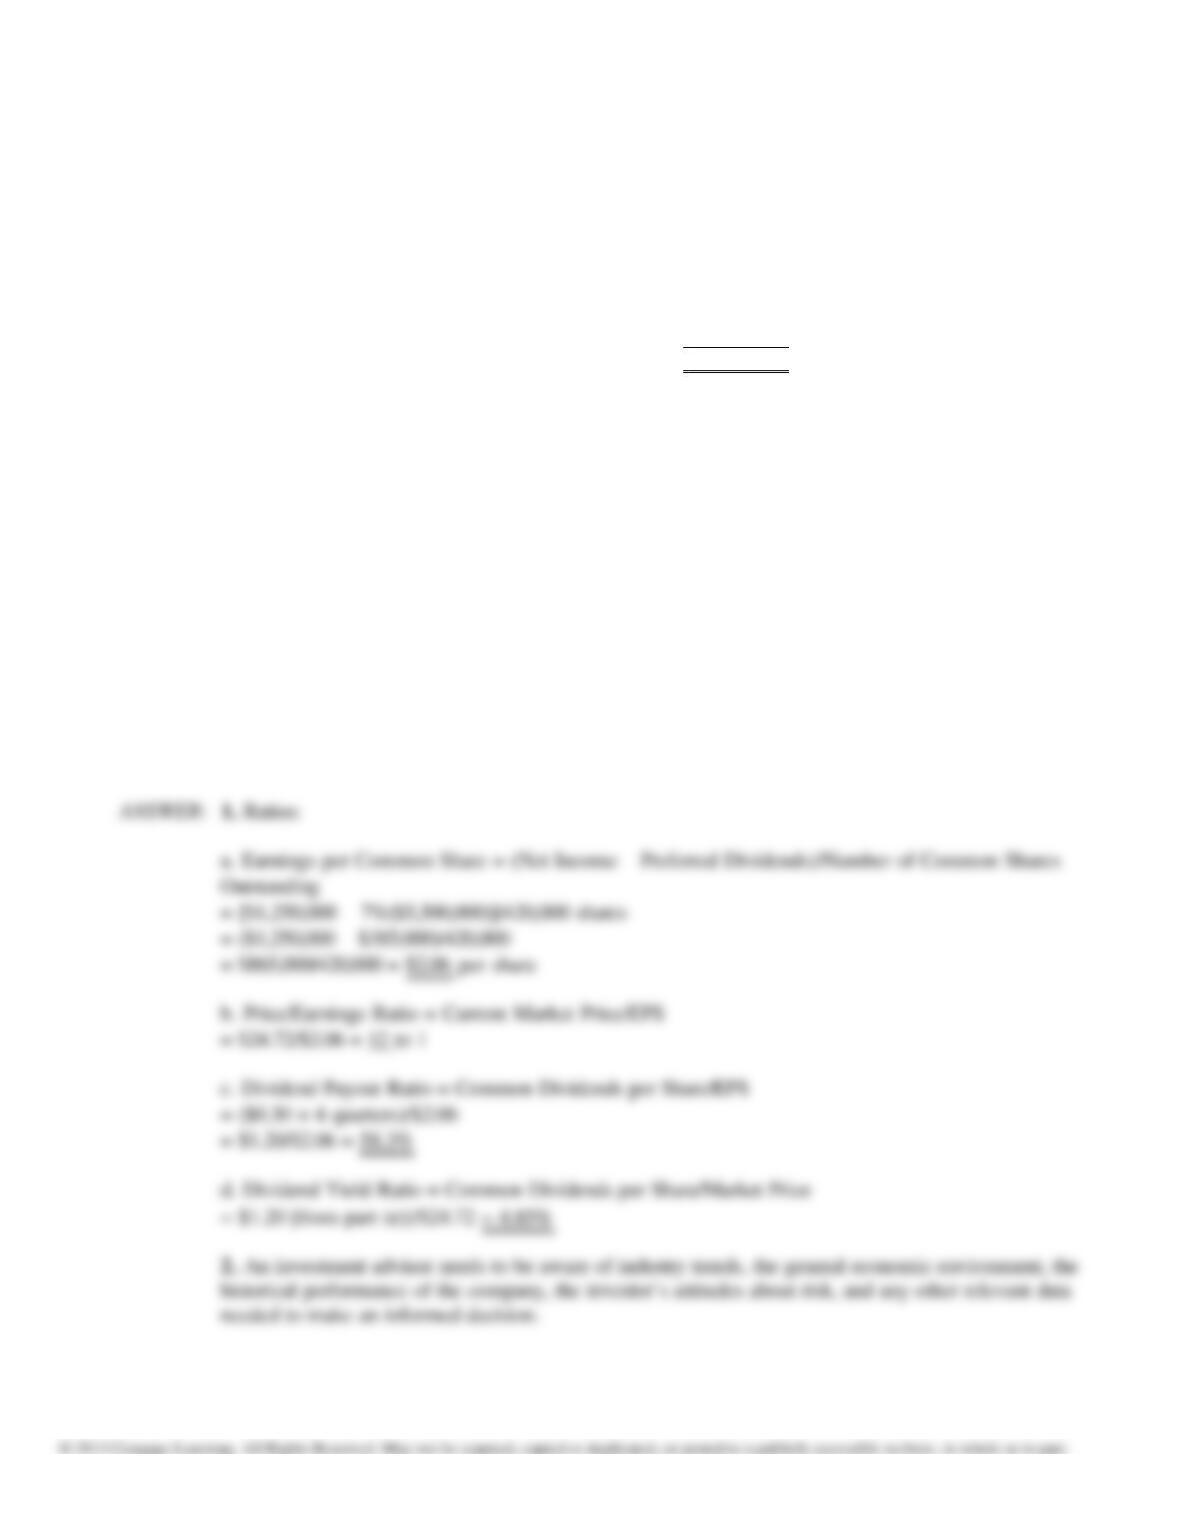
1. Compute the following ratios for the common stock:
a. Earnings per share
b. Price/earnings ratio
c. Dividend payout ratio
d. Dividend yield ratio
2. Assume that you are an investment adviser. What other information would you want to have before advising a
client regarding the purchase of Grant stock?
Chapter 13: Financial Statement Analysis
203. The Stockholders’ Equity section of the balance sheet for Brompton Construction Company at the end of 2016 is as
follows:
10%, $10 par, cumulative preferred stock, 500,000 shares authorized, 200,000 shares issued
and outstanding
$2,000,000
Additional paid–in capital on preferred
7,500,000
Common stock, $1 par, 2,500,000 shares authorized, 2,000,000 shares issued and outstanding
2,000,000
Additional paid–in capital on common
21,000,000
Retained earnings
25,500,000
Total stockholders’ equity
$58,000,000
The lower portion of the 2016 income statement indicates the following:
Net income before tax
$9,900,000
Income tax expense (40%)
(3,960,000)
Income before extraordinary items
$ 5,940,000
Extraordinary loss from hurricane
$(6,000,000)
Less related tax effect (40%)
2,400,000
(3,600,000)
Net income
$2,340,000
Assume that the number of shares outstanding did not change during the year.
REQUIRED:
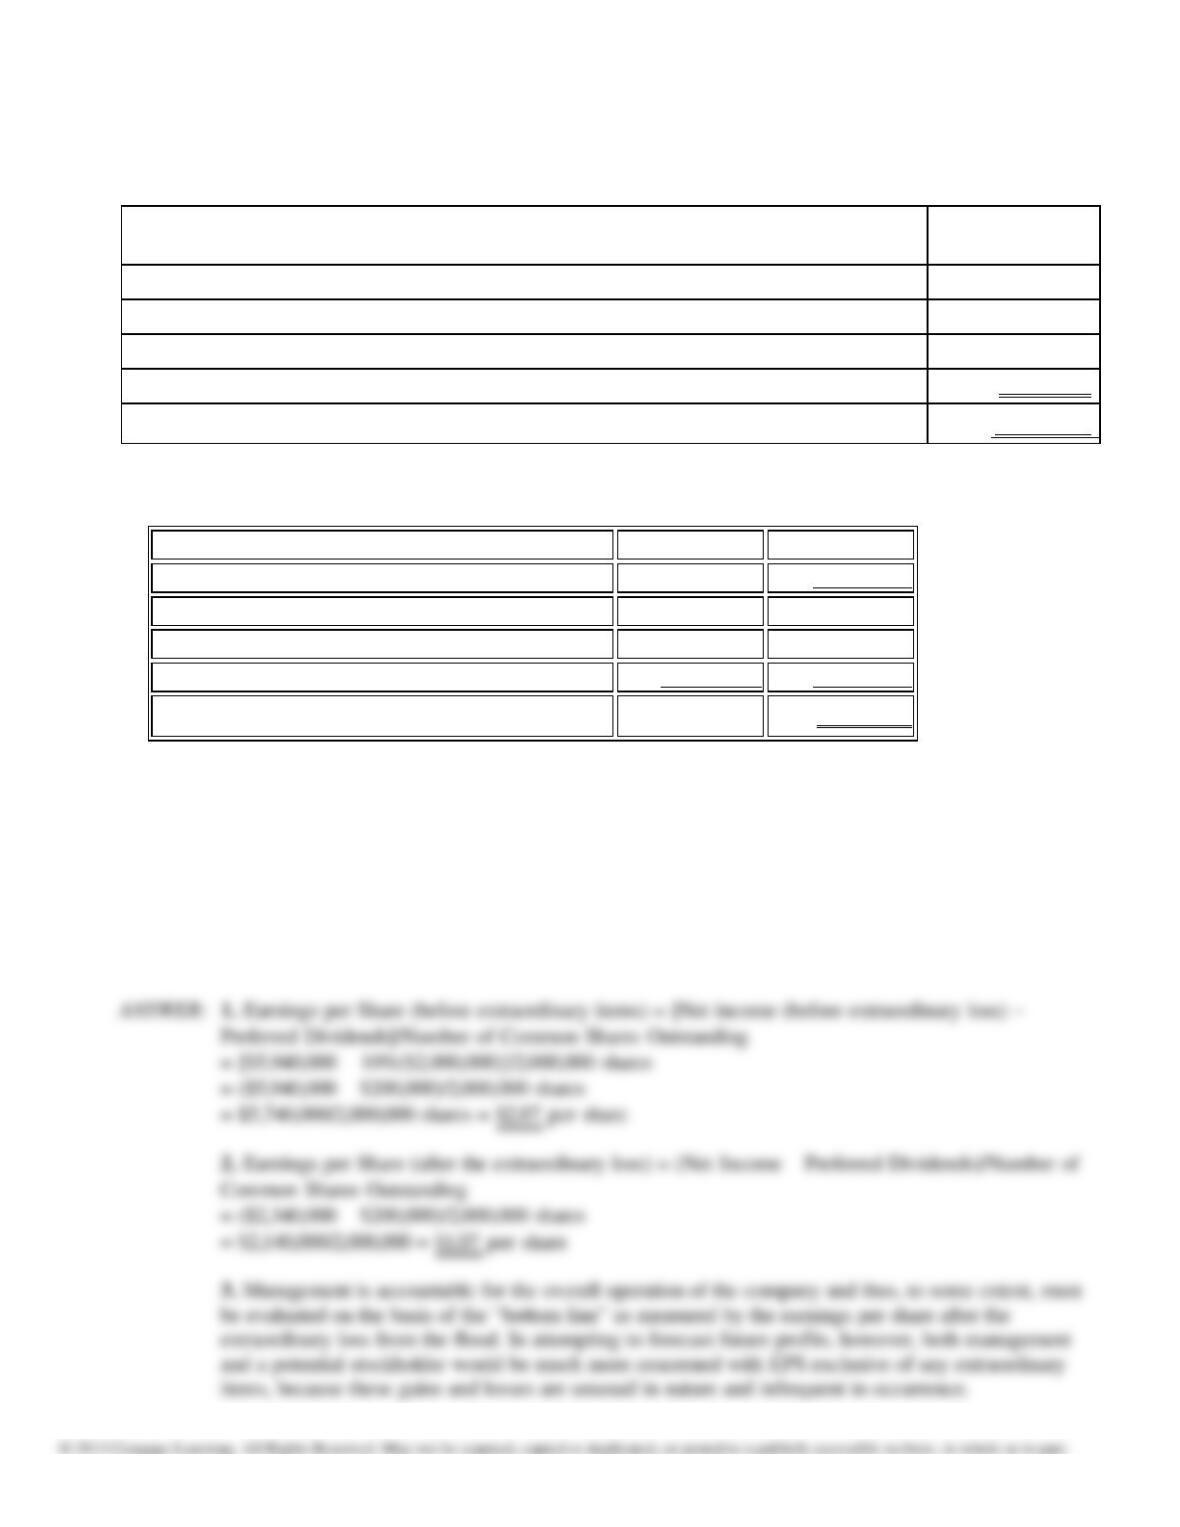
1. Compute earnings per share before extraordinary items.
2. Compute earnings per share after the extraordinary loss.
3. Which of the two EPS ratios is more useful to management? Explain your answer. Would your answer be
different if the ratios were to be used by an outsider, like a potential stockholder? Why or why not?