232
Chapter 13 Inferential statistics
Suggested Activities
1. In addition to capabilities in EXCEL and SPSS. There are online free data analysis programs
2. Use the dataset from Chapter 12, Activity 1 to have your students answer the following questions.
1. What is the correlation between hours of game playing and exercise?
2. Is there a significant difference between boys and girls in amount of video time playing?
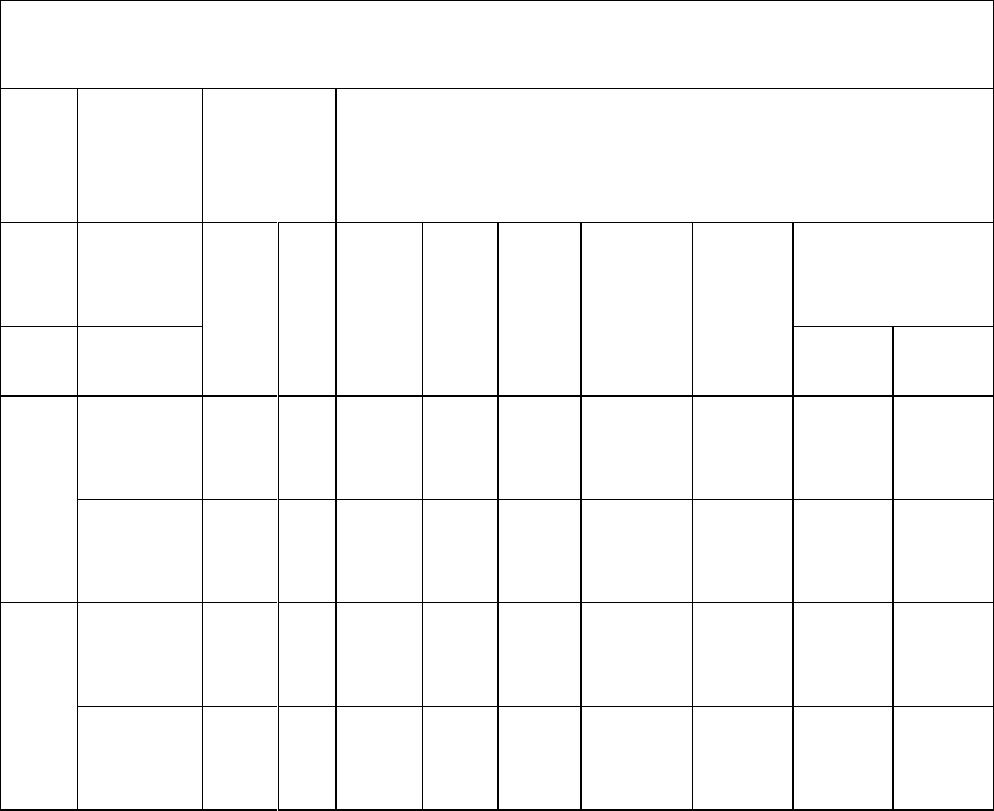
3. Is there a significant difference between boys and girls in amount of exercise time?
4. At what age in the sample do boys report the most video use?
3. Use the dataset from the Chapter 12, Activity 2 to have your students answer the following
questions. Again, depending on how they entered the data there might be slight differences in
their responses.
1. What is the correlation between high school GPA and college GPA?
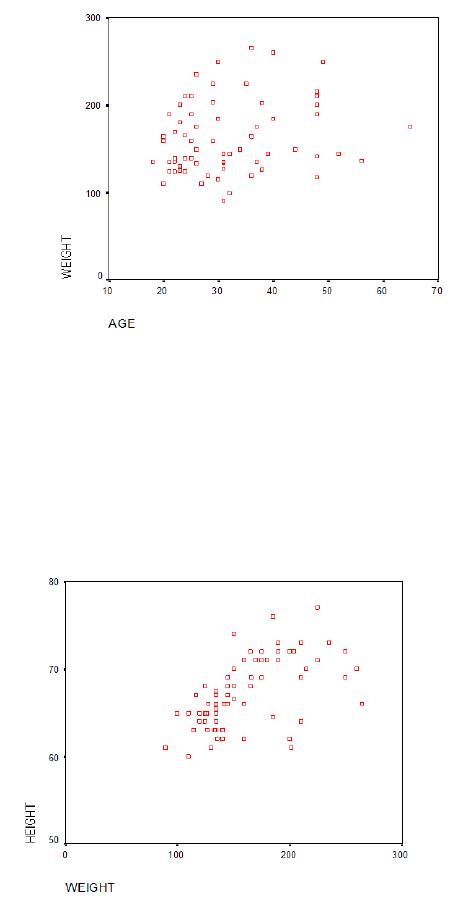
2. What is the correlation between age and weight? Graph this correlation with a scatterplot.
3. What is the relationship between height and weight?
4. Do males or females exercise more? Significantly more?
5. Was there a significant difference between high school GPA and college GPA?
4. Use the dataset that corresponds to James Sloan’s test anxiety instrument, as found in Appendix B
and as referenced in Chapter 12, Activity 3, to answer the following questions.
1. Are there differences in GPA between men and women?
2. Are there differences in overall anxiety between men and women?
3. Is class standing or current grade a significant predictor of test anxiety?
233
Chapter 13 Suggested Activity #3 Answers
1. Use the dataset from Chapter 12, Activity 1 to have your students answer the following questions.
1. What is the correlation between hours of game playing and exercise?
Correlations
Hours
Exercise
Hours
Pearson Correlation
1.000
-.646**
Sig. (2-tailed)
.000
N
40.000
40
Exercise
Pearson Correlation
-.646**
1.000
Sig. (2-tailed)
.000
N
40
40.000
**. Correlation is significant at the 0.01 level (2-tailed).
2. Is there a significant difference between boys and girls in amount of video time playing?
3. Is there a significant difference between boys and girls in amount of exercise time?
Group Statistics
f=1;
m=2
N
Mean
Std. Deviation
Std. Error Mean
Exercise
1
22
8.7159
3.65661
.77959
2
18
7.5556
3.95429
.93204
Hours
1
22
7.6591
3.82780
.81609
2
18
11.1389
4.90290
1.15562
234
Independent Samples Test
Levene’s Test
for Equality
of Variances
t-test for Equality of Means
F
Sig.
t
df
Sig. (2-
tailed)
Mean
Difference
Std. Error
Difference
95% Confidence
Interval of the
Difference
Lower
Upper
Exercis
e
Equal
variances
assumed
.288
.594
.963
38
.342
1.16035
1.20539
-1.27983
3.60054
Equal
variances not
assumed
.955
35.172
.346
1.16035
1.21509
-1.30599
3.62670
Hours
Equal
variances
assumed
.950
.336
-2.522
38
.016
-3.47980
1.37991
-6.27329
-.68631
Equal
variances not
assumed
-2.460
31.785
.020
-3.47980
1.41473
-6.36228
-.59732
235
4. At what age in the sample do youth report the most video use?
Independent Samples Test
Levene’s Test
for Equality
of Variances
t-test for Equality of Means
F
Sig.
T
df
Sig. (2-
tailed)
Mean
Difference
Std. Error
Difference
95% Confidence
Interval of the
Difference
Lower
Upper
Exercis
e
Equal
variances
assumed
.288
.594
.963
38
.342
1.16035
1.20539
-1.27983
3.60054
Equal
variances not
assumed
.955
35.172
.346
1.16035
1.21509
-1.30599
3.62670
Hours
Equal
variances
assumed
.950
.336
-2.522
38
.016
-3.47980
1.37991
-6.27329
-.68631
Equal
variances not
assumed
-2.460
31.785
.020
-3.47980
1.41473
-6.36228
-.59732
236
Case Processing Summary
Cases
Included
Excluded
Total
N
Percent
N
Percent
N
Percent
Hours * AGE
40
100.0%
0
.0%
40
100.0%
Exercise * AGE
40
100.0%
0
.0%
40
100.0%
Report
AGE
Hours
Exercise
11
Mean
7.2083
7.2500
N
6
6
Std. Deviation
2.96402
2.29674
12
Mean
9.6250
8.1875
N
20
20
Std. Deviation
5.24812
3.97515
13
Mean
10.7222
7.4444
N
9
9
Std. Deviation
4.12205
4.25327
14
Mean
7.3500
10.7000
N
5
5
Std. Deviation
4.11400
3.42053
Total
Mean
9.2250
8.1938
N
40
40
Std. Deviation
4.63051
3.78911
Chapter 13 Suggested Activity #4 Answers
Please note that the answers found for the Chapter 13 questions will differ slightly depending
upon data entry decisions made by the student. While the answers to the questions included in
the suggested activities are provided, this dataset also allows for several other analysis, and can
also be used to familiarize students with the functions of SPSS. As the instructor you might want
237
to pose additional questions and allow for some time for the students to experiment or play a
little.
1. What is the correlation between HS GPA and College GPA?
2. What is the correlation between age and weight? Graph this correlation with a
scatterplot.
3. What is the relationship between height and weight?
4. Do males or females exercise more? Significantly more?
Correlations
HS_GPA
C_GPA
HS_GPA
Pearson
Correlation
1.000
.534
Sig. (2-tailed)
.
.000
N
66
64
C_GPA
Pearson
Correlation
.534
1.000
Sig. (2-tailed)
.000
.
N
64
66
** Correlation is significant at the 0.01 level (2-tailed).
238
Correlations
GENDER
MARITAL
Spearman’s
rho
GENDER
Correlation
Coefficient
1.000
-.013
Sig. (2-
tailed)
.
.919
N
68
66
MARITAL
Correlation
Coefficient
-.013
1.000
Sig. (2-
tailed)
.919
.
N
66
66
Correlations
AGE
WEIGHT
AGE
Pearson
Correlation
1.000
.200
Sig. (2-tailed)
.
.104
N
67
67
WEIGHT
Pearson
Correlation
.200
1.000
Sig. (2-tailed)
.104
.
N
67
68
239
240
Correlations
WEIGHT
HEIGHT
WEIGHT
Pearson
Correlation
1.000
.559
Sig. (2-tailed)
.
.000
N
68
68
HEIGHT
Pearson
Correlation
.559
1.000
Sig. (2-tailed)
.000
.
N
68
68
** Correlation is significant at the 0.01 level (2-tailed).
Group Statistics
GENDER
N
Mean
Std.
Deviation
Std. Error
Mean
EXERCISE
1.00
41
2.3293
2.2181
.3464
2.00
26
6.7500
5.4282
1.0646
Independent Samples Test
Levene’s
Test for
Equality of
Variances
t-test for
Equality of
Means
F
Sig.
t
df
Sig. (2-
tailed)
Mean
Differenc
e
Std.
Error
Differenc
e
95%
Confidence
Interval of
the
Difference
Lower
Upper
EXERCI
SE
Equal
variances
assumed
22.856
.000
-4.653
65
.000
-4.4207
.9500
-6.3181
-2.5234
Equal
variances
not
assumed
-3.949
30.362
.000
-4.4207
1.1195
-6.7059
-2.1356
241
Chapter 13 Activity 5 Answers
1. Are there differences in GPA between men and women? The t-test below indicates that there
2. Are there differences in overall anxiety between men and women? Using the total scale as
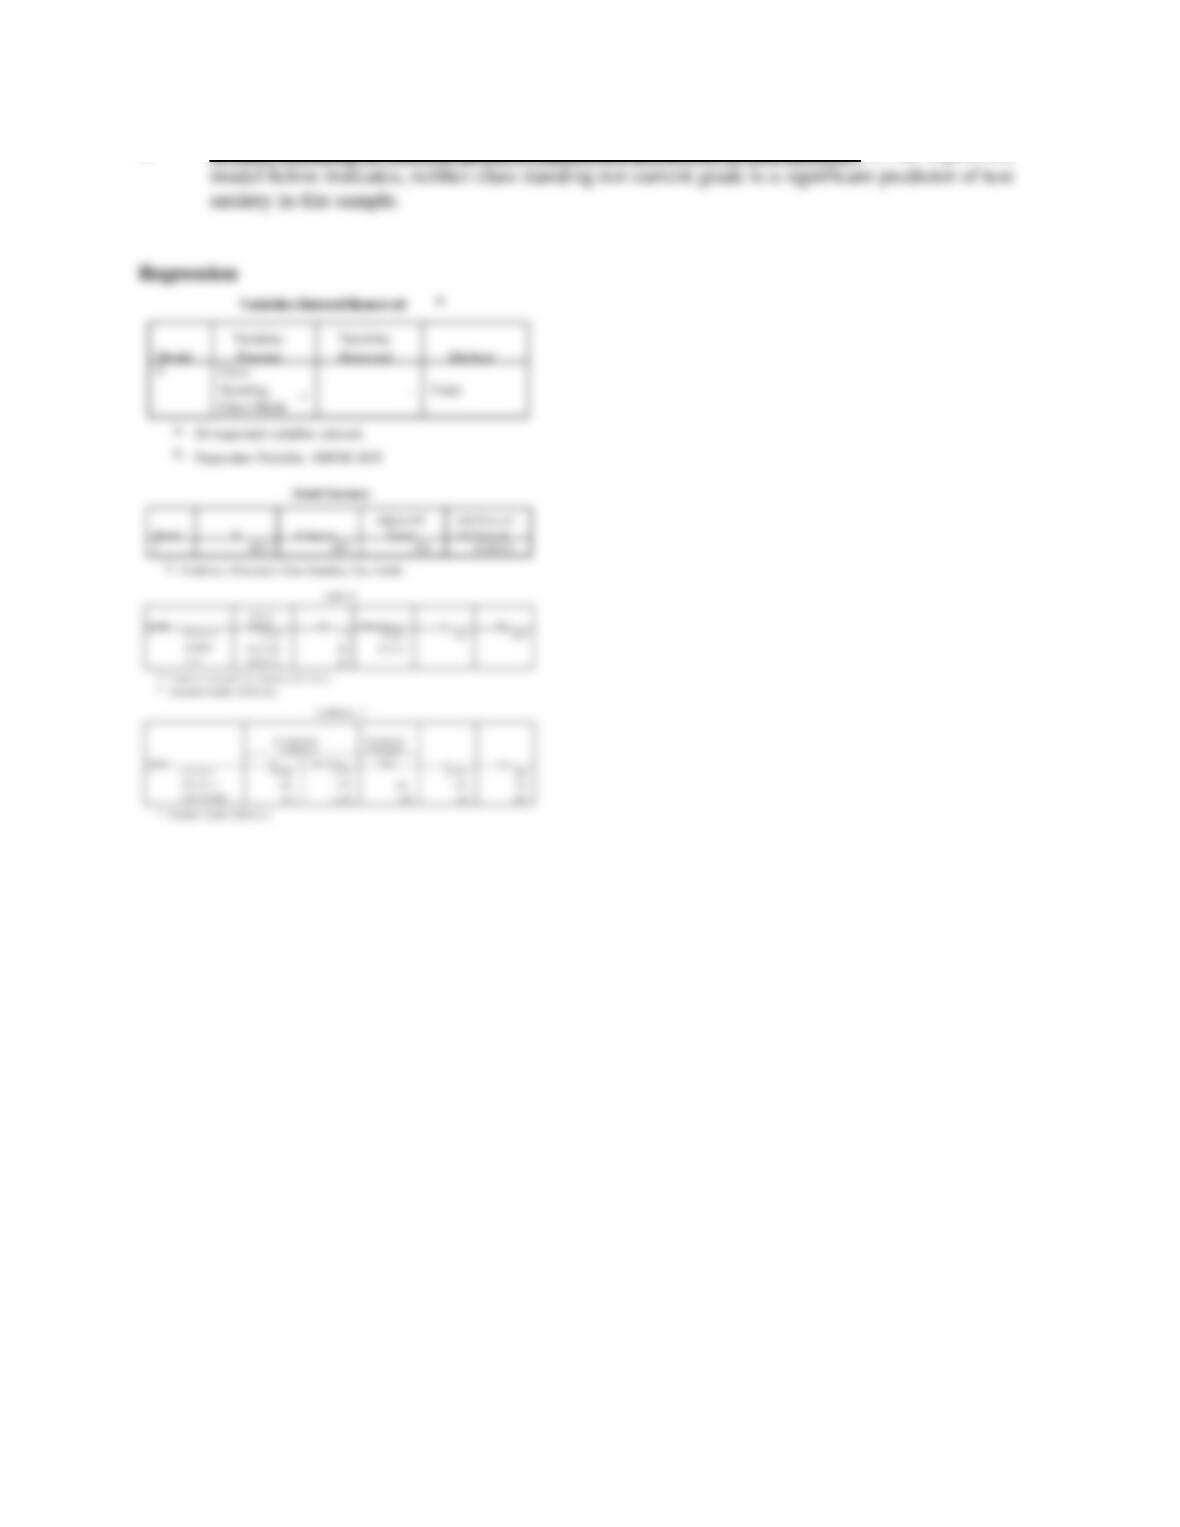
242
3. Is class standing or current grade a significant predictor of test anxiety? As the regression

243
Chapter 13 Test Items
1. The percentage of sample means that fall between +/- 1 standard deviation is
a. 36.
b. 68.
c. 84
d. 99.
2. The smaller the standard error the
a. more accurate the sample means are as an estimate of the population mean.
b. more likely differences between groups are due to chance.
c. less likely that the statistic represents the parameter.
d. less accurate the subject’s response is on a dependent measure.
3. Both the mean and the standard deviation are examples of which of the following?
a. Statistics.
b. Parameters.
c. Data.
d. Assessment.
4. Which of the following does one need to know to calculate the standard error of the
mean?
a. Mean and sample size.
b. Mean and standard deviation.
c. Standard deviation and sample size.
d. Mean, standard deviation, and sample size.
5. As standard error of the mean increases
a. population mean decreases.
b. sample mean increases.
c. sampling error increases.
d. sample mean decreases.
6. As the population standard deviation increases
a. sampling error decreases.
b. sample mean decreases.
c. sampling error increases.
d. population mean increases.
• 7. Given a set of scores with a mean of 25, standard deviation of 4 and a sample
size of 50, calculate the standard error of the mean.
a. .36
b. .57
c. 1.75
d. 2.42
• 8. Given a set of scores with a mean of 80, a standard deviation of 3, and a sample
size of 82, calculate the standard error of the mean.
a. .27
b. .33
c. .68
244
d. .80
9. Inferential statistics are generally concerned with
a. how well the sample represents the population.
b. if the correct statistical test is used for analysis.
c. the internal validity of the research design.
d. the consequential validity of the dependent measure.
• 10. Which of the following represents a null hypothesis regarding the differences
between two groups learning biology content?
a. There are differences in a practicum exam between those who learn dissection in the
actual lab and those who learn dissection by computer simulation.
b. There are no differences in a practicum exam between those who learn dissection in
the actual lab and those who learn dissection by computer simulation.
c. Those students who learn dissection in the lab will perform better on the practicum
exam than those who learn dissection via the computer simulation.
d. Those students who learn dissection via the computer simulation will perform better
on the practicum exam than those who learn dissection in the lab.
• 11. Which of the following represents a null hypothesis regarding differences in SAT
score by identity status?
a. There are no differences in SAT scores among students of different race and
ethnicities.
b. Hispanic students score lower than any other students on the SAT.
c. Hispanic students score higher than any other students on the SAT.
d. There are significant differences in SAT among students of different race and
ethnicities.
• 12. When a researcher is concerned about committing a Type I error which of the
following significance levels should she use to reject or retain the null hypothesis?
a. .001
b. .01
c. .05
d. .10
• 13. Mike concluded that there were no differences in self-confidence between those
who had received his intervention and those in the control group. However, there were
differences. Mike’s intervention did work! Mike’s conclusion represents
a. a Type I error.
b. a Type II error
c. both a Type I and Type II error.
d. neither a Type I or Type II error.
245
• 14. Darlene concludes in her thesis that there are significant differences in reading
motivation between those children whose parents read to them daily and those who did
not. There were, however, no actual differences between these groups. Darlene’s
conclusion represents
a. a Type I error.
b. a Type II error
c. both a Type I and Type II error.
d. neither a Type I or Type II error.
• 15. In her treatment group, Kenesha had students with developmental disabilities
swim daily for 20 minutes. In her findings she reported that at the conclusion of the
study, those in the treatment condition had greater self-confidence than those in the no-
swimming control group. There were actual differences between groups. Kenesha’s
conclusion represents
a. a Type I error.
b. a Type II error.
c. both a Type I and Type II error.
d. neither a Type I or Type II error.
• 16. Anan conducted an experimental study in which students were randomly
assigned to either 10 minutes of read aloud, 10 minutes of silent reading, 10 minutes of
writing, or 10 minutes of free time. She concluded that there were significant differences
among groups with the read aloud group outperforming others on a standardized reading
assessment. However, there were not actual differences among groups. Anan conclusion
represents
a. a Type I error
b. a Type II error
c. both a Type I and a Type II error
d. neither a Type I or Type II error
• 17. In a recent study that tested differences in metacognition between those with high
ability and those with low ability, Teo concluded that there were not differences between
these groups. In fact, however, the low ability students were actually significantly better at
monitoring their learning. Teo’s conclusion represents
a. a Type I error
b. a Type II error
c. both a Type I and a Type II error
d. neither a Type I or Type II error
18. When a researcher concludes that there are no differences between the treatment and
control groups in a study, and in fact, there were no differences between the conditions.
The researcher is illustrating
a. Type I error.
b. Type II error.
c. both Type I and Type II error.
d. neither Type I and Type II error.
246
19. If a null hypothesis is rejected it means
a. the treatment causes significant differences.
b. there are no differences between treatments.
c. any differences between groups are due to sampling error.
d. the differences found between groups are not due to chance.
20. If a null hypothesis is retained one can conclude which of the following?
a. Any differences between groups are due to sampling error.
b. Differences between conditions are due to the treatment.
c. The treatment is successful.
d. There are no significant differences between groups.
21. If a researcher rejects the null hypothesis she is concluding that
a. there are real differences between groups.
b. there are no real differences between groups.
c. differences between groups are due to chance.
d. differences between groups are due to measurement error.
22. As the probability of committing a Type I error increases
a. the probability of committing a Type II error decreases.
b. the probability of committing a Type II error generally increases.
c. the probability of committing a Type II error may increase or decrease.
d. the probability of committing a Type II error will remain constant.
23. Researchers determine the probability level
a. prior to the execution of the study and any data collection.
b. after the data are collected by prior to analysis
c. after analysis but prior to interpretation
d. after the data are analyzed and interpreted but before writing it up.
24. One benefit of conducting a two-tailed test is that
a. it allows for a greater region of rejection than a one tailed test.
b. it allows for differences in groups be in either direction.
c. it is easier to obtain significant differences between groups.
d. it is easier to reject the null hypothesis than for a one tailed test.
25. Degrees of freedom are dependent upon
a. the number of participants.
b. the number of participants and groups.
c. the number of groups and their means.
d. the number of participants and their performance.
• 26. Moya would like to increase the degrees of freedom in her study that explores
students’ test performance in Chemistry. How might she do this?
a. She could make an easier test so students perform better.
b. She could increase her sample size.
c. She could divide her sample into subgroups.
d. She could add a covariate to her analysis.

247
27. The selection of an inappropriate test of significance
a. will cause one to make a Type I error.
b. will cause one to make a Type II error.
c. may cause either a Type I or Type II error.
d. is independent of Type of error.
28. The first decision in selection of an appropriate test of significance is
a. to examine sample size.
b. to determine if a parametric or nonparametric test must be selected.
c. to consider the effect size you need.
d. to decide if your level of significance is appropriate.
• 29. Cristos has collected data to explore differences in opinions about diversity
training in the workplace based upon geographic location in the county. The first step he
should take in selecting the appropriate test of significance is to
a. conduct a power analysis.
b. consider the effect size he needs.
c. decide his level of significance.
d. decide if a parametric or nonparametric test will be used.
30. Parametric tests require all EXCEPT the following assumptions
a. that there are an equal number of participants per group.
b. that data are interval or ratio scale of measurement.
c. that the selection of participants is independent.
d. that the variable measured is normally distributed.
31. A non-parametric test should be used if
a. the sample size is small.
b. the level of measurement is nominal.
c. the scores are normally distributed.
d. the concern for a Type II error is great.
32. The test of significance that determines if two group means differ more than would be
expected by chance is the
a. t- test.
b. chi square.
c. ANOVA.
d. analysis of gain scores.
33. In determining the test of significance to select, one must consider all EXCEPT which of
the following?
a. Number of groups.
b. Sample sizes.
c. Needed effect size.
d. Level of measurement of data.
34. Independent samples refer to samples
a. selected from different populations.
b. selected from the same population.
c. known to be different on extraneous variables.
248
d. selected based upon a stratified sample.
35. The level of probability selected determines the
a. probability of committing a Type I error.
b. probability of committing a Type II error.
c. probability of committing both a Type I and Type II error.
d. neither Type I or Type II error is related to selected probability.
• 36. Rose is sure that any significant differences in her reading intervention study will
favor those children who were in her treatment condition. She therefore will not consider
rejecting the null hypothesis that the groups are different in favor of her control
condition. Rose will then
a. use a non-parametric test of significance.
b. apply a two-tailed test of significance.
c. apply a one-tailed test of significance.
d. use descriptive findings only to examine her data.
37. Nonindependent t-tests are used when
a. the two groups tested are randomly formed samples.
b. the two groups tested are initially the same on the dependent variable.
c. the two groups are formed by preexisting samples.
d. Matching has been done or in a pre-post design.
38. In both a t-test and an ANOVA the differences between groups is represented as the
a. numerator in the equation.
b. denominator in the equation.
c. error in the equation.
d. treatment variance in the equation.
• 39. Misha is comparing different Types of typing instruction. In one group he used a
classroom-based instructional method, while for the other group he used a computer-
based training program. After a six-week treatment, he assessed differences in their
typing ability. Of the following, which is the appropriate test of significance for Misha to
use assuming random assignment and no pretreatment differences?
a. Independent t test
b. Dependent t test
c. Difference scores
d. ANOVA
• 40. Hal administers a self-esteem measure to his sample before the sessions begin
and after a semester of the Saturday Esteem Program, he measures their esteem again.
Which type of analysis is Hal likely to use to test for significant differences in his group?
a. Independent t test
b. Dependent t test
c. Difference scores
d. ANCOVA
249
• 41. Shani is testing whether her intervention designed to increase self-reported
tolerance for others in aggressive youth is effective. She administers her scale before and
after the intervention and concludes that her intervention is effective. Which analysis did
Shani use?
a. Independent t test
b. Dependent t test
c. ANCOVA
d. ANOVA
• 42. Vincente intends to examine differences between three groups of district
curriculum coordinators that received either no formal training, a web-based training, or a
cooperative group experience as instruction for the core standards. He tested participants’
knowledge of the standards both before treatment and then after treatment. Given his
design, which of the following analysis should Vincente conduct?
a. Independent t test
b. Dependent t test
c. ANCOVA
d. ANOVA
43. The statistical test that allows us to determine the degree to which variables are related is
the
a. ANCOVA.
b. MANOVA.
c. Multiple Regression.
d. Chi Square.
44. When one does follow-up tests to determine significant differences between groups in a
comparison between means test, one test to use is the
a. nonindependent t.
b. Scheffe test.
c. Chi Square.
d. Pearson r.
• 45. Andy compared students’ ability to transfer learning from three different Types
of instructional materials. He found that there were pre-existing group differences
between his conditions. Which of the following is the appropriate analysis technique for
Andy to use?
a. Nonindependent t test
b. Independent t test
c. MANOVA
d. ANCOVA
• 46. Nelson’s recent study tested differences in problem-solving ability based upon
science ability, treatment (instruction, no instruction), and gender. Of the following,
which test should Nelson employ?
a. Chi Square
b. t-test
c. ANOVA
d. Multiple Regression
250
47. If an observed F value with 1 degree of freedom within and 12 degrees of freedom
between and a significance level of p=.05 is 4.80 and the table value is 4.75 what can the
researcher conclude?
a. He has proven there are differences between groups.
b. There are no differences between groups.
c. Differences between groups are due to chance.
d. Differences between groups are greater than those expected by chance.
48. Given equal F and equal degrees of freedom, and a change from p=.01 to p=.05, the
needed F ratio to indicate significant differences between groups will
a. remain constant.
b. decrease.
c. increase.
d. may either increase or decrease.
• 49. Given a set of scores with a mean of 80, standard deviation of 8 and a sample
size of 200, calculate the standard error of the mean.
a. .57
b. .85
c. 1.18
d. 1.62
• 50-52. Given the following data for two groups, answer questions 50-52.
Group 1 Group 2
9 6
7 6
5 4
8 3
6 6
• 50. To test for differences between these two groups the researcher will employ an
independent groups t-test. To calculate the independent groups t-test, one must calculate
the X1
The X1=
a. 5
b. 7
c. 25
d. 35
• 51. To test for significance one must also calculate the (X1)2. The (X1)2=
a. 25
b. 35
c. 133
d. 255
251
• 52. The formula for degrees of freedom for independent t tests is (n1+n2-2).
Therefore, the degrees of freedom for this dataset equals
a. 4
b. 5
c. 8
d. 10
• 53.-54. Given a group of 100 individuals queried at random from a busy urban street, 75
stated they preferred Indian food and 25 stated that they prefer Thai food. The expected
frequency would be 50 and 50. A Chi Square test would be used to calculate the
differences between the observed and the expected frequencies.
• 53. In order to calculate the Chi Square, the degrees of freedom are calculated as C-
1. How many degrees of freedom are there in this example?
a. 0
b. 1
c. 2
d. 4
• 54. Given the following formula, calculate Chi Sq
Chi Sq= (observed1-expected1)2 (observed2-expected2)2
__________________ + __________________
expected expected
a. 25
b. 50
c. 75
d. 125
• 55-58. Given the following pre and post data set for students completing number of push-ups in
30 seconds, if we were to determine if there are differences between pre and post we
would calculate a non independent t test. The formula follows:
Pre pushups Post pushups
4 5
2 4
3 6
4 7
5 6
t = D
D2-(D)2
N
N(N–1)
•

252
55. D=
a. 5
b. 8
c. 10
d. 24
• 56. mean D=
a. 1
b. 2
c. 5
d. 10
• 57. If degrees of freedom equal N-1 where N is the number of pairs, the degrees of freedom
are
a. 1
b. 4
c. 9
d. 14
• 58. t=
a. .44
b. 2
c. 4.27
d. 4.54
• 59.-62. Given the following groups of scores, to test for differences between means it is
most likely that an ANOVA would be calculated.
Group 1 Group 2 Group 3
3 6 5
2 6 2
4 5 4
5 4 3
4 6 2
In order to conduct an ANOVA the Sum of squares between can first be computed.
SS between = (X1)2 + (X2)2 + (X3)2 -(X)2
n1 n2 n3 N
• 59. Given the above formula N =
a. 1
b. 3
c. 5
d. 15

253
• 60. Given the above formula, X2 =
a. 61
b. 70
c. 248
d. 277
• 61. Given the above formula, (X1)2 =
a. 18
b. 248
c. 324
d. 729
• 62 Given the above formula, Ss between =
a. 2
b. 13.8
c. 15.2
d. 24
• 63.-66. Given the following groups of scores, to test for differences between
means it is most likely that an ANOVA would be calculated.
Group 1 Group 2 Group 3
5 9 5
4 8 4
8 6 4
6 7 6
5 6 6
5 7 5
In order to conduct an ANOVA the Sum of squares between can first be computed.
SS between = (X1)2 + (X2)2 + (X3)2 -(X)2
n1 n2 n3 N
• 63. Given the above formula N =
a. 3
b. 30
c. 43
d. 106
• 64. Given the above formula, (X1)2 =
a. 33
b. 191
c. 696
d. 1089
254
• 65. Given the above formula, X3 =
a. 18
b. 30
c. 33
d. 43
• 66. Given the above data, if significant differences are found between conditions.
Which of the following tests might a researcher use to determine where these differences
are found?
a. Spearman rho
b. dependent t-test
c. ANOVA
d. Scheffe test
• 67. Given a set of scores with a mean of 80 and a standard deviation of 10 and a
sample size of 100, calculate the standard error of the mean.
a. .48
b. .76
c. 1.00
d. 2.24
• 68. Which of the following represents a null hypothesis regarding the differences between
two treatment groups of students exposed to behavior management strategies for social
behavior?
a. There are differences in observed prosocial behavior between those exposed to a
graphing strategy and those exposed to a cognitive self-reflection strategy.
b. Those students who are given a graphing strategy will display more prosocial behavior
than those given a cognitive self-reflection strategy.
c. There are no differences in prosocial behavior between those exposed to a graphing
strategy and those exposed to a cognitive self-reflection strategy.
d. Those students who are given a cognitive self-reflection strategy will display more
prosocial behavior than those given a graphing strategy.
• 69.-70. Saud concluded that there were no differences in reading ability between those
who were exposed to parent read aloud and those who were exposed to sibling read
aloud. There were, in fact, no actual differences in reading ability.
• 69. In this scenario, Saud’s conclusion represents
a. a Type I error.
b. a Type II error.
c. both a Type I and a Type II error.
d. neither a Type I nor a Type II error.
255
• 70. To calculate his t-test to compare groups, Saud needed to determine his degrees
of freedom. To do so he will need to know not only that he has two groups but also he
will need to know which of the following pieces of information?
a. The number of children in the study.
b. The number of parents in the study.
c. The mean group performance.
d. The mean number of treatment sessions.
• 71-72. In a study that tested the effects of three groups of after school homework club
participation in end of year mathematics performance. In the first group, students worked
independently, in the second group students worked with peer–tutors, and in the third group
students worked independently with a tutor. Jasmine concluded that there were differences
between the three groups, however there were not actual differences between these conditions.
• 71. In this scenario, Jasmine’s conclusion represents
a. a Type I error
b. a Type II error
c. both a Type I and a Type II error
d. neither a Type I or a Type II error
• 72. Which test did Jasmine use to analyze her data?
a. A dependent t test
b. A independent t test
c. An ANOVA
d. An ANCOVA
• 73. Molly has conducted a study that examines whether exposure to computers increases
eyestrain in children. She randomly assigns children to one of four treatment conditions
dependent upon computer exposure levels. The children’s eyestrain is then tested.
Which of the following tests of significance is Molly likely to use?
a. T-test
b. Chi square
c. ANOVA
d. Analysis of gain scores
• 74. Garrett wants to see if there are gender differences in the restaurant preferences
of high school students in his town. His data is nominal in nature. Which of the
following tests is he likely to employ?
a. Dependent t-test
b. Independent t-test
c. Chi-square
d. ANOVA
256
• 75.-76. Given a set of scores in a normal distribution with a mean of 80, standard
deviation of 4, and sample size of 100.
• 75. What is the standard error of the mean of this distribution?
1. .05
2. .20
3. .40
4. .80
• 76. If the sample were increased to 200 participants would we expect to happen to
the standard error?
a. The standard error would be unaffected
b. The standard error would decrease
c. The standard error would increase
d. The standard error would double
• 77.-78. Chloe concluded that there were differences in achievement goals between those who
had completed a ropes course and those who did not complete the course. However,
there were no true differences between groups. The ropes course had no significant
effect on achievement goals?
• 77. In this scenario, Chloe’s conclusion represents a
1. Type I error.
2. Type II error.
3. Type III error.
4. Type IV error.
• 78. To determine if there were significant differences between groups, Chole would
have conducted which of the following analyses?
a. Chi-Square
b. Pearson r
c. T-Test
d. ANOVA
• 79.-82. In her study of student athlete’s achievement motivation, Katie administers a
self-report achievement motivation scale before she starts a new motivation enhancement
intervention. After the intervention, Katie again assesses students’ achievement
motivation. She set her alpha at p=.05, and reported that there were no significant
findings in her study.
• 79. Which of the following best represents the design of Katie’s study?
a. Experimental
b. Cross–sectional
c. Correlational
d. Pre–experimental
257
• 80. Which statistical analysis was appropriate for Katie to use to determine if there
were treatment differences in her study?
a. Pearson r
b. ANOVA
c. Spearman rho
d. T-Test
• 81. Katie questions whether there are significant differences in her study but her
significance level is unable to detect these differences. What Type of error is Katie most
concerned that she is committing?
a. Type I
b. Type II
c. Type III
d. Type IV
• 82. From the following options, how would you advise Katie regarding her analyses?
a. Change your probability level to p=.001
b. Evaluate and conduct the study with a new sample
c. Reanalyze with a two-tailed analyses
d. Use a non-parametric significance test
• 83.-85. In his study of effectiveness of driver’s education programs, Cameron
administers a practice items from a drivers’ test. Participants are randomly assigned to
one of two treatments, either a tutorial that narrates content, or an equivalent amount of
time to practice items with feedback. After the treatment, Cameron again assesses
students’ knowledge with a drivers’ test. He set his alpha at p=.05, and reported that
significant differences indicated that those in the practice with feedback condition
outperformed those in the tutorial condition.
• 83. Which of the following best represents the type of research Cameron conducted?
a. Correlational
b. Experimental
c. Descriptive
d. Narrative
• 84. Which of the following were appropriate for Cameron to use to analyze his data?
T-test
a. ANCOVA
b. Chi Square
c. Pearson r
d. HLM
• 85. Which of the following is the dependent variable in Cameron’s study?
a. Type of instruction
b. Tutorial
c. Drivers’ test
d. Effectiveness
258
• 86. How many levels of does he have of his independent variable?
a. 0
b. 1
c. 2
d. 3
• 87. Suggest how Cameron could like to increase the power of his study.
a. He could run a different analysis.
b. He could add more participants.
c. He could increase the number of conditions
d. He could increase the number of items on the test.
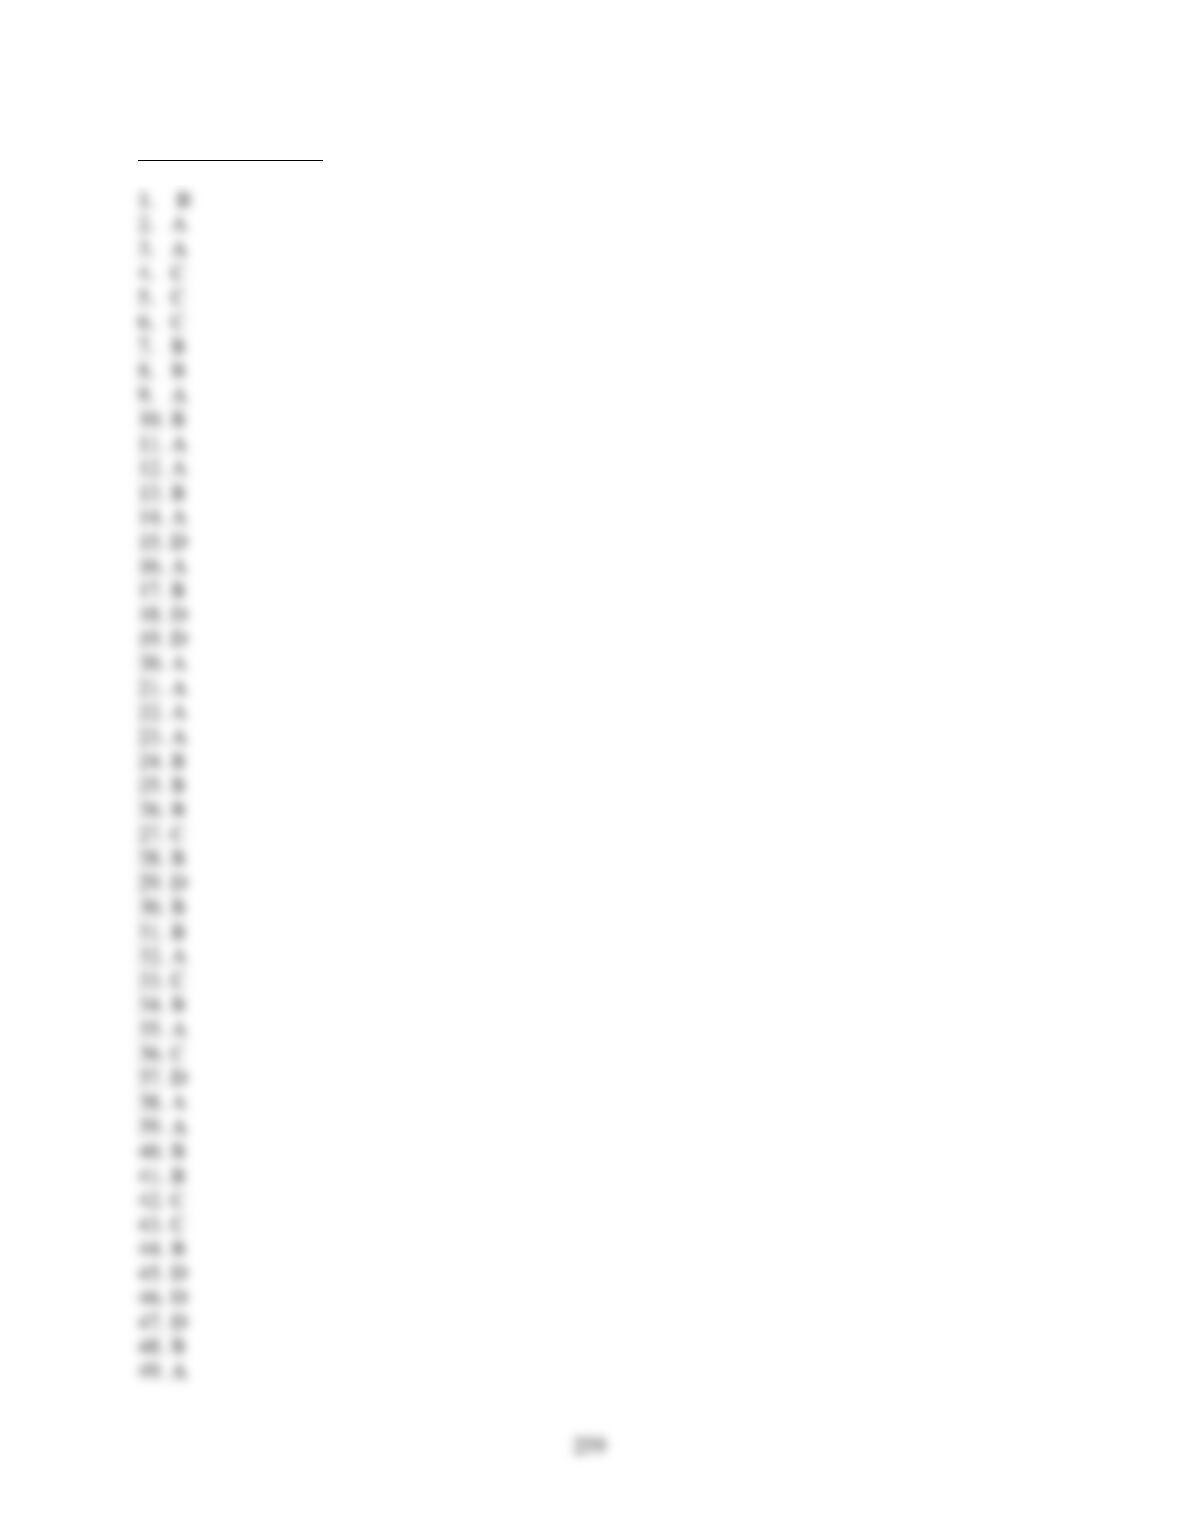
Chapter 13 Answers
260