Chapter 13: Financial Statement Analysis
173. Presented below are selected data from the financial statements of Hospital Supply Company for 2016, 2015, and
2014.
2016
2015
2014
Total assets
$650,000
$821,000
$800,000
Net credit sales
800,000
650,000
720,000
Accounts receivable
85,000
79,000
74,000
Accounts receivable turnover ratio
9.8 times
8.5 times
8.0 times
A) Calculate Hospital Supply’s number of days’ sales in receivables for 2016 and 2015.
Assume 360 days in a year.
B) What is the meaning of your answer in part A?
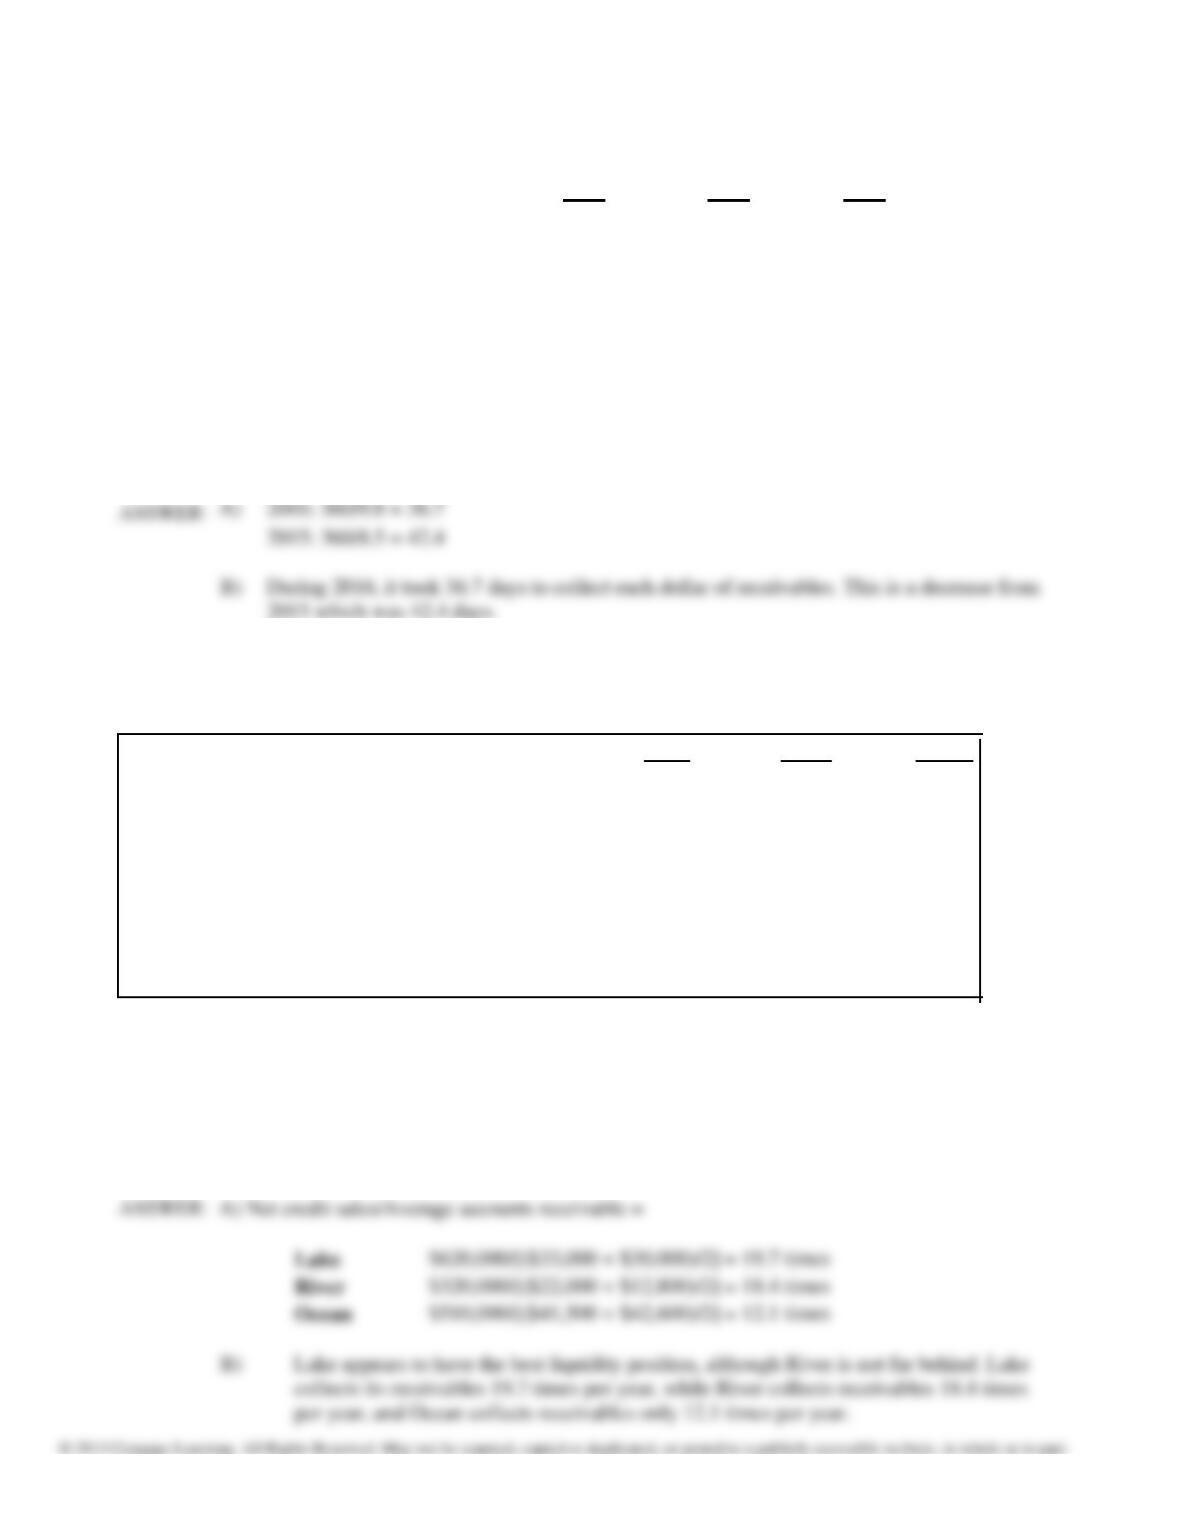
174. Use the following information that was obtained from the 2016 and 2015 financial statements of Lake Company,
River Corporation, and Ocean Company to answer the questions that follow.
(In millions)
Lake
River
Ocean
Accounts receivable
December 31, 2016
$ 33,000
$ 22,000
$ 41,500
December 31, 2015
30,000
12,800
42,600
Inventory
December 31, 2016
22,600
12,600
54,200
December 31, 2015
23,900
32,800
44,000
Net sales (Credit)
2016
620,000
320,000
510,000
2015
610,000
310,000
760,000
Cost of goods sold
2016
211,000
406,000
311,000
2015
156,000
200,000
310,000
REQUIRED: Compare the three companies and answer the following:
A) Compute the accounts receivable turnover ratio for each company for 2016.
B) Which company appears to have the best liquidity position based solely on the accounts receivable
turnover? Explain.
Chapter 13: Financial Statement Analysis
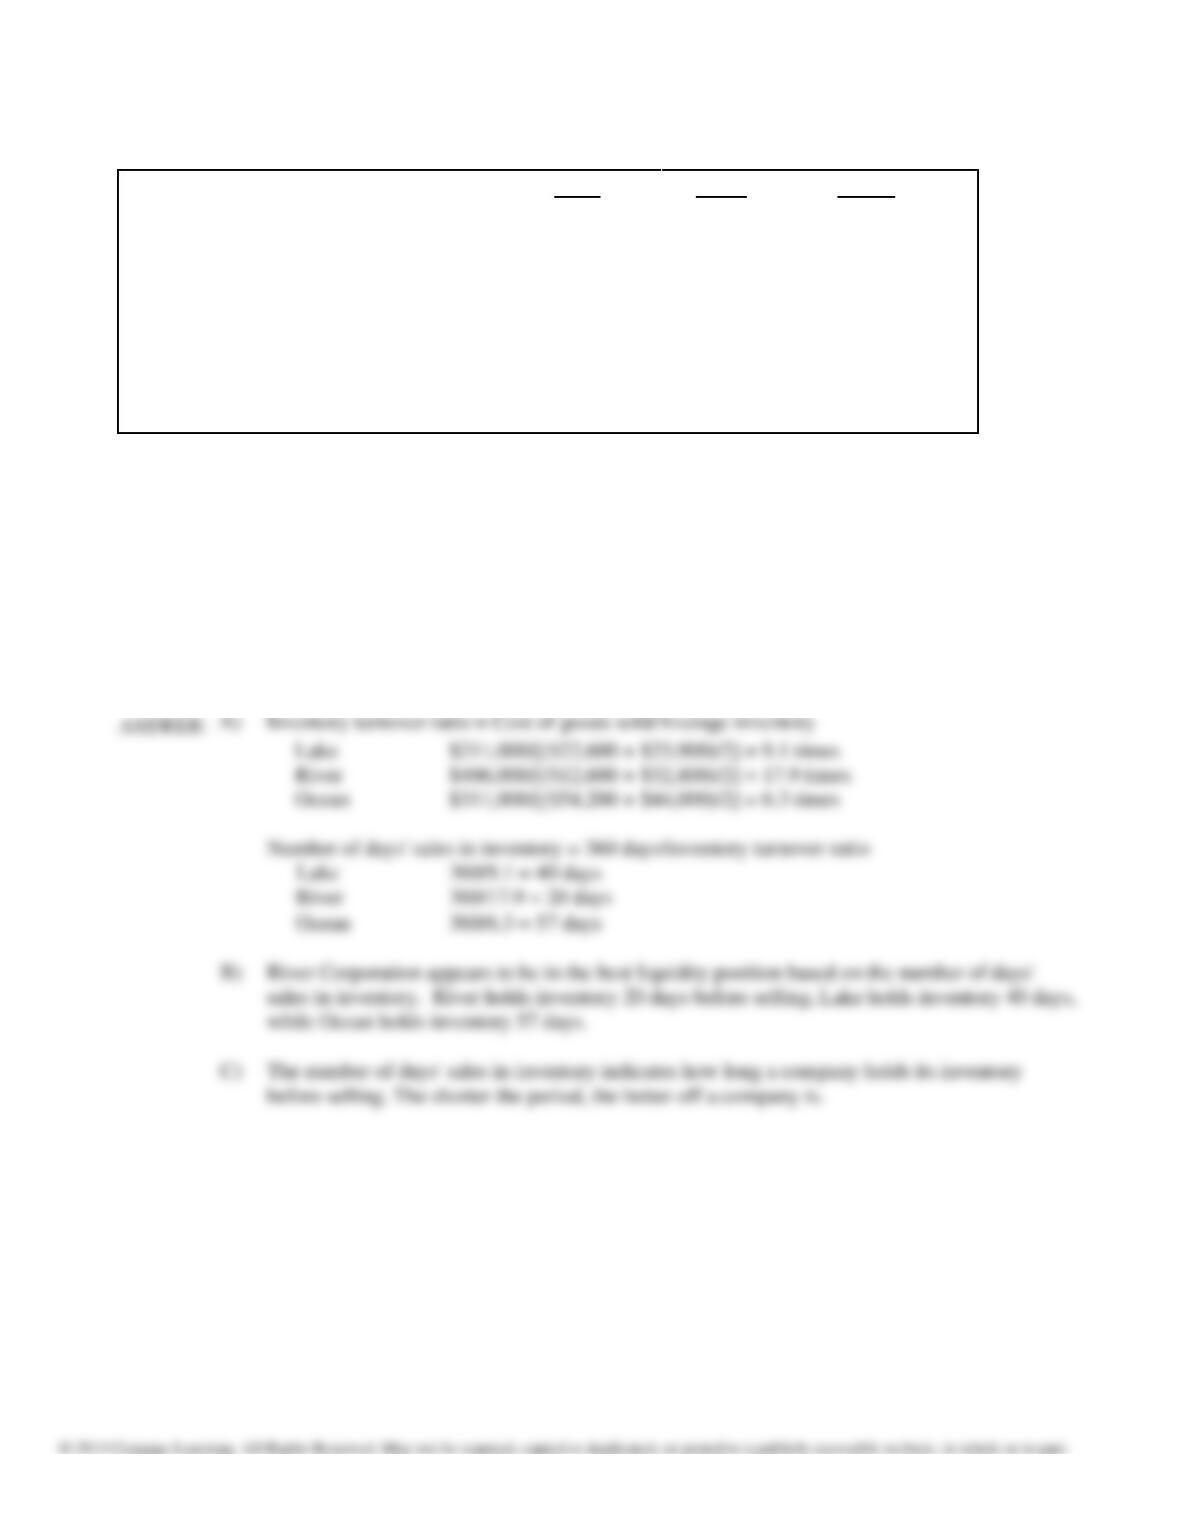
175. Use the following information that was obtained from the 2016 and 2015 financial statements of Lake Company,
River Corporation, and Ocean Company to answer the questions that follow.
(In millions)
Lake
River
Ocean
Accounts receivable
December 31, 2016
$ 33,000
$ 22,000
$ 41,500
December 31, 2015
30,000
12,800
42,600
Inventory
December 31, 2016
22,600
12,600
54,200
December 31, 2015
23,900
32,800
44,000
Net sales (Credit)
2016
620,000
320,000
510,000
2015
610,000
310,000
760,000
Cost of goods sold
2016
211,000
406,000
311,000
2015
156,000
200,000
310,000
REQUIRED:
Compare the three companies and answer the following:
A) Compute the number of days’ sales in inventory for each company for 2016.
B) Which company appears to have the best liquidity position based solely on the inventory analysis?
Explain.
C) What information is provided to users with your calculations in part A?
Chapter 13: Financial Statement Analysis
176. The following analysis is based on information obtained from 2016 financial statements of Lake Company, River
Corporation, and Ocean Company.
(In Millions)
Lake
River
Ocean
Accounts receivable turnover ratio
10.7
18.9
12.1
Inventory turnover ratio
9.1
18.4
6.4
A) Compute the cash to cash operating cycle for each company for 2016.
B) What does this ratio measure? Which company has the better cash to cash operating cycle?
177. Given below are three ratios calculated for Lantana, Tera, and Bake Companies for 2016 and 2015.
(In millions)
Lantana
Tera
Bake
Current ratio
December 31, 2016
December 31, 2015
2.8 to 1
2.8 to 1
3.3 to 1
2.5 to 1
1.8 to 1
3.2 to 1
Inventory turnover ratio
December 31, 2016
December 31, 2015
6.8 times
7.6 times
5.4 times
5.5 times
6.0 times
12.6 times
Acid-test ratio
December 31, 2016
December 31, 2015
1.5 to 1
1.3 to 1
2.1 to 1
2.0 to 1
.54 to 1
1.2 to 1
A) Which company has the best inventory management? Explain.
B) Which company has the best short-term financial health? Explain.
Chapter 13: Financial Statement Analysis
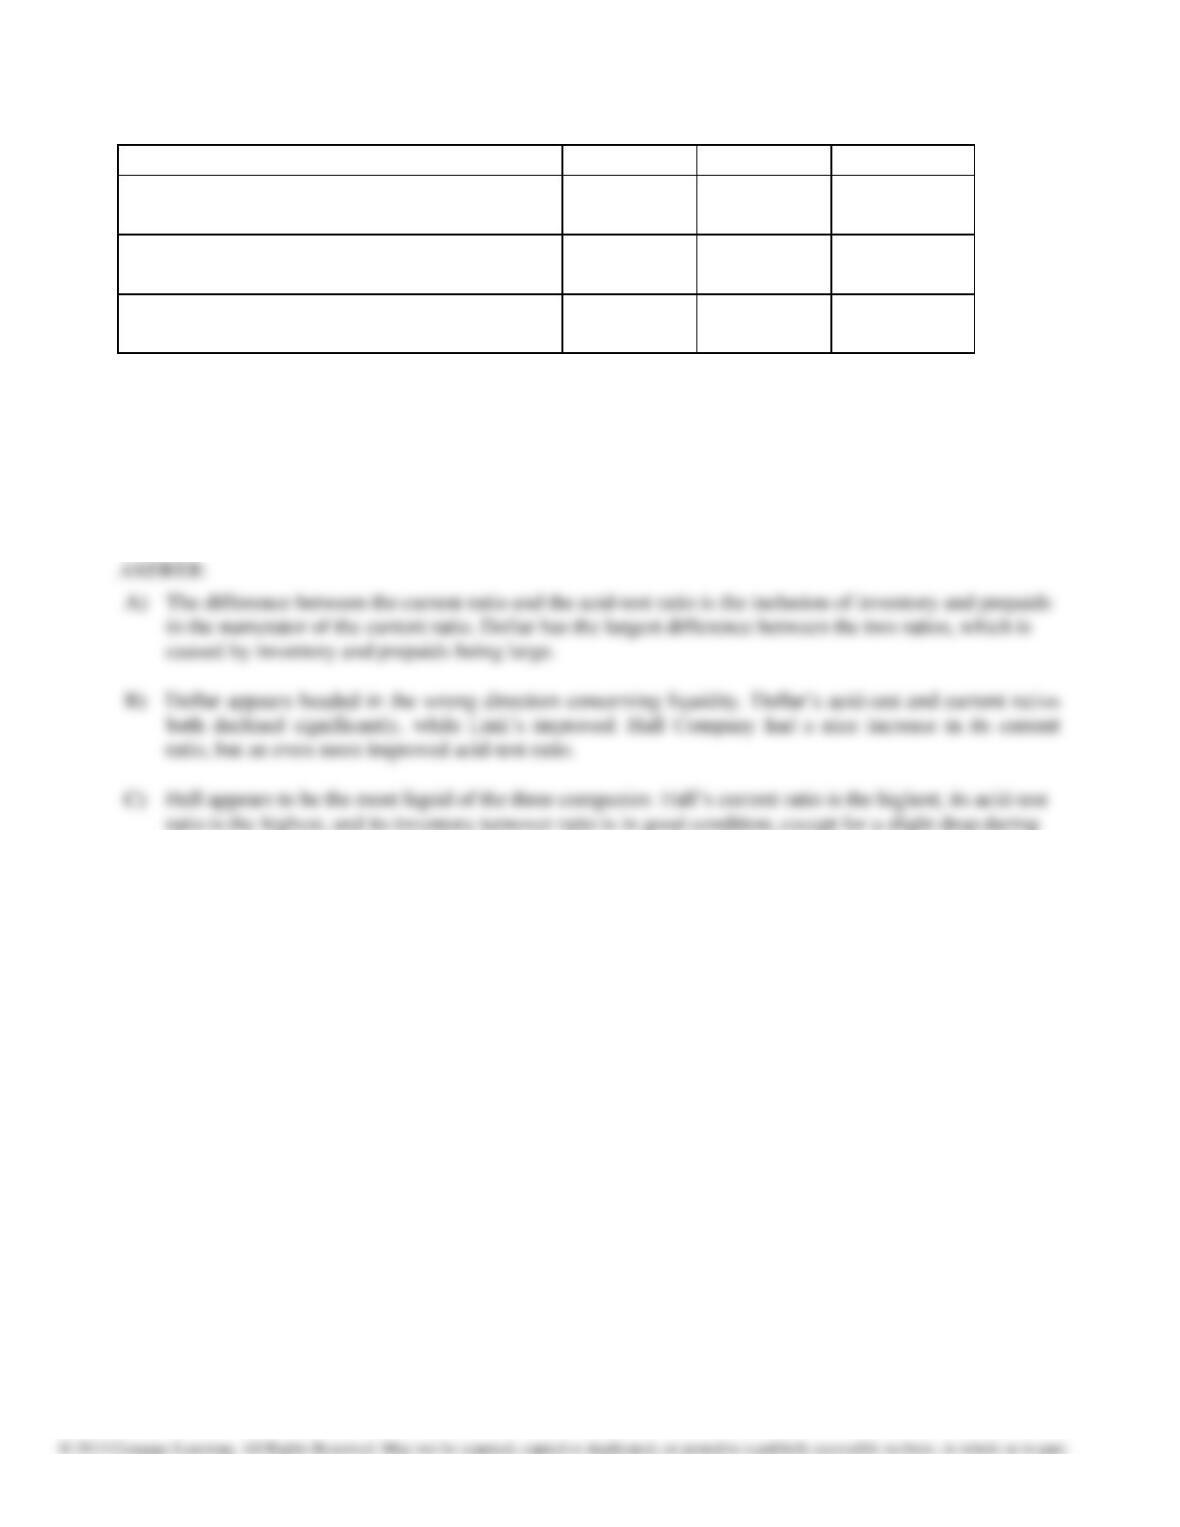
178. Given below are three ratios calculated for Hall, Link, and Dollar Companies for 2016 and 2015.
(In millions)
Hall
Link
Dollar
Current ratio
Dec 31, 2016
Dec 31, 2015
2.8 to 1
2.0 to 1
2.3 to 1
1.5 to 1
1.8 to 1
2.2 to 1
Inventory turnover ratio
Dec 31, 2016
Dec 31, 2015
6.9 times
7.6 times
5.8 times
5.8 times
8.0 times
9.6 times
Acid-test ratio
Dec 31, 2016
Dec 31, 2015
2.5 to 1
1.0 to 1
2.1 to 1
1.4 to 1
0.5 to 1
1.2 to 1
A) Which company has the greatest percentage of inventory and prepaids? How can you tell?
B) Which company appears to be heading in the wrong direction concerning its ability to pay its bills in a
very short-run situation? Explain.
C) Which company appears to be the most liquid? Explain.
2016.
Chapter 13: Financial Statement Analysis
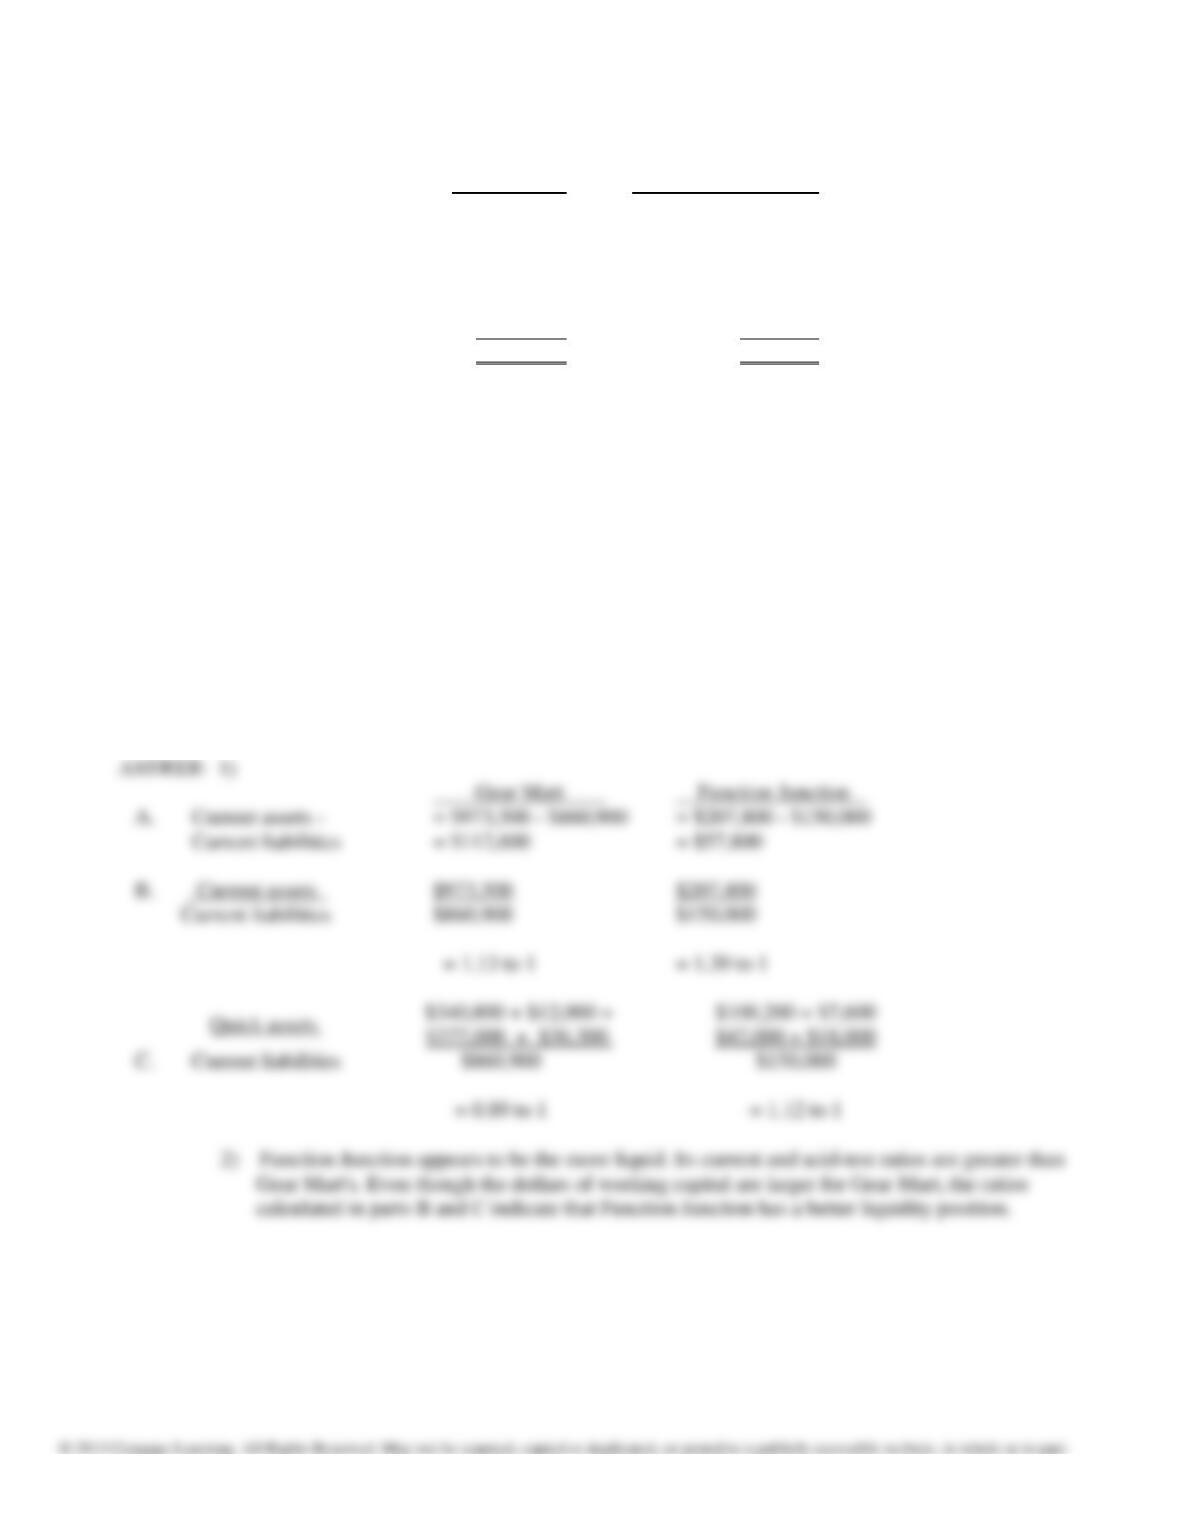
179. The following information is summarized from the balance sheets of Gear Mart Corporation and Function
Junction, Inc. at December 31, 2016:
Gear Mart
Function Junction
Current Assets:
Cash and cash equivalents
$ 340,800
$100,200
Short-term investments
12,000
7,600
Accounts receivable, net
377,000
42,000
Notes receivable, net
36,300
18,000
Other current assets
207,400
40,000
Total current assets
$ 973,500
$207,800
Current liabilities
$ 860,900
$150,000
Other liabilities
5,000,400
300,500
Stockholders’ equity
2,400,300
800,700
1) Using the information provided above, compute the following for each company at December 31,
2016:
A. Working capital
B. Current ratio
C. Acid-test ratio
2) Comment briefly on the liquidity of each of these two companies. Which company appears to be
the most liquid?
Gear Mart
Function Junction
A.
Current assets –
= $973,500 – $860,900
= $207,800 – $150,000
Current liabilities
= $112,600
= $57,800
B.
Current assets
$973,500
$207,800
Current liabilities
$860,900
$150,000
= 1.13 to 1
= 1.39 to 1
C.
Chapter 13: Financial Statement Analysis
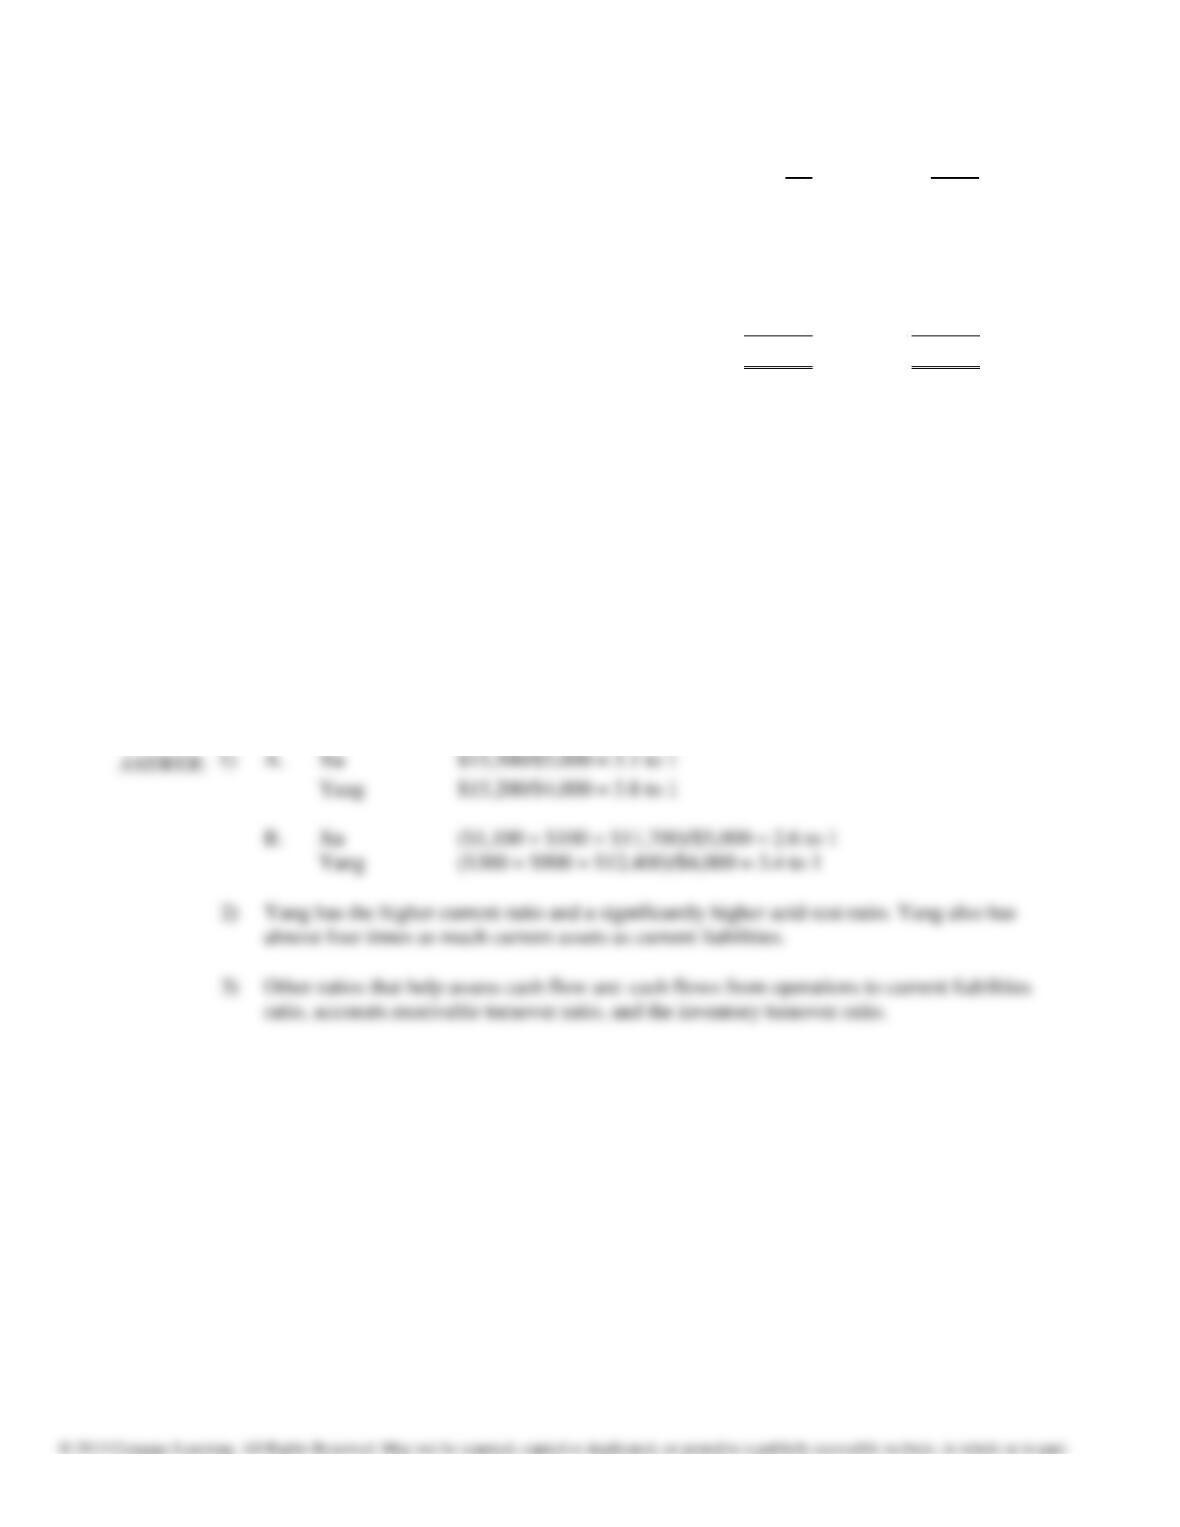
180. Given below is information for Xu Corporation and Yang Computers, Inc. at the end of 2016.
(In millions)
Cash and cash equivalents
Xu
$ 1,100
Yang
$ 300
Short-term investments/marketable securities
100
900
Accounts, notes, and other receivables, net
11,700
12,400
Inventories
1,200
1,000
Prepaid expenses
1,400
600
Total current assets
$15,500
$15,200
Current liabilities
$ 5,000
$ 4,000
Other liabilities
$ 2,300
$12,000
Stockholders’ equity
$ 5,300
$ 7,300
1) Using the information provided above, compute the following for each company at December 31,
2016:
A. Current ratio
B. Acid-test ratio
2) Comment briefly on the liquidity of each of these two companies. Which appears to be more
liquid?
3) What other ratios would help you to more fully assess the liquidity of these companies?
Chapter 13: Financial Statement Analysis
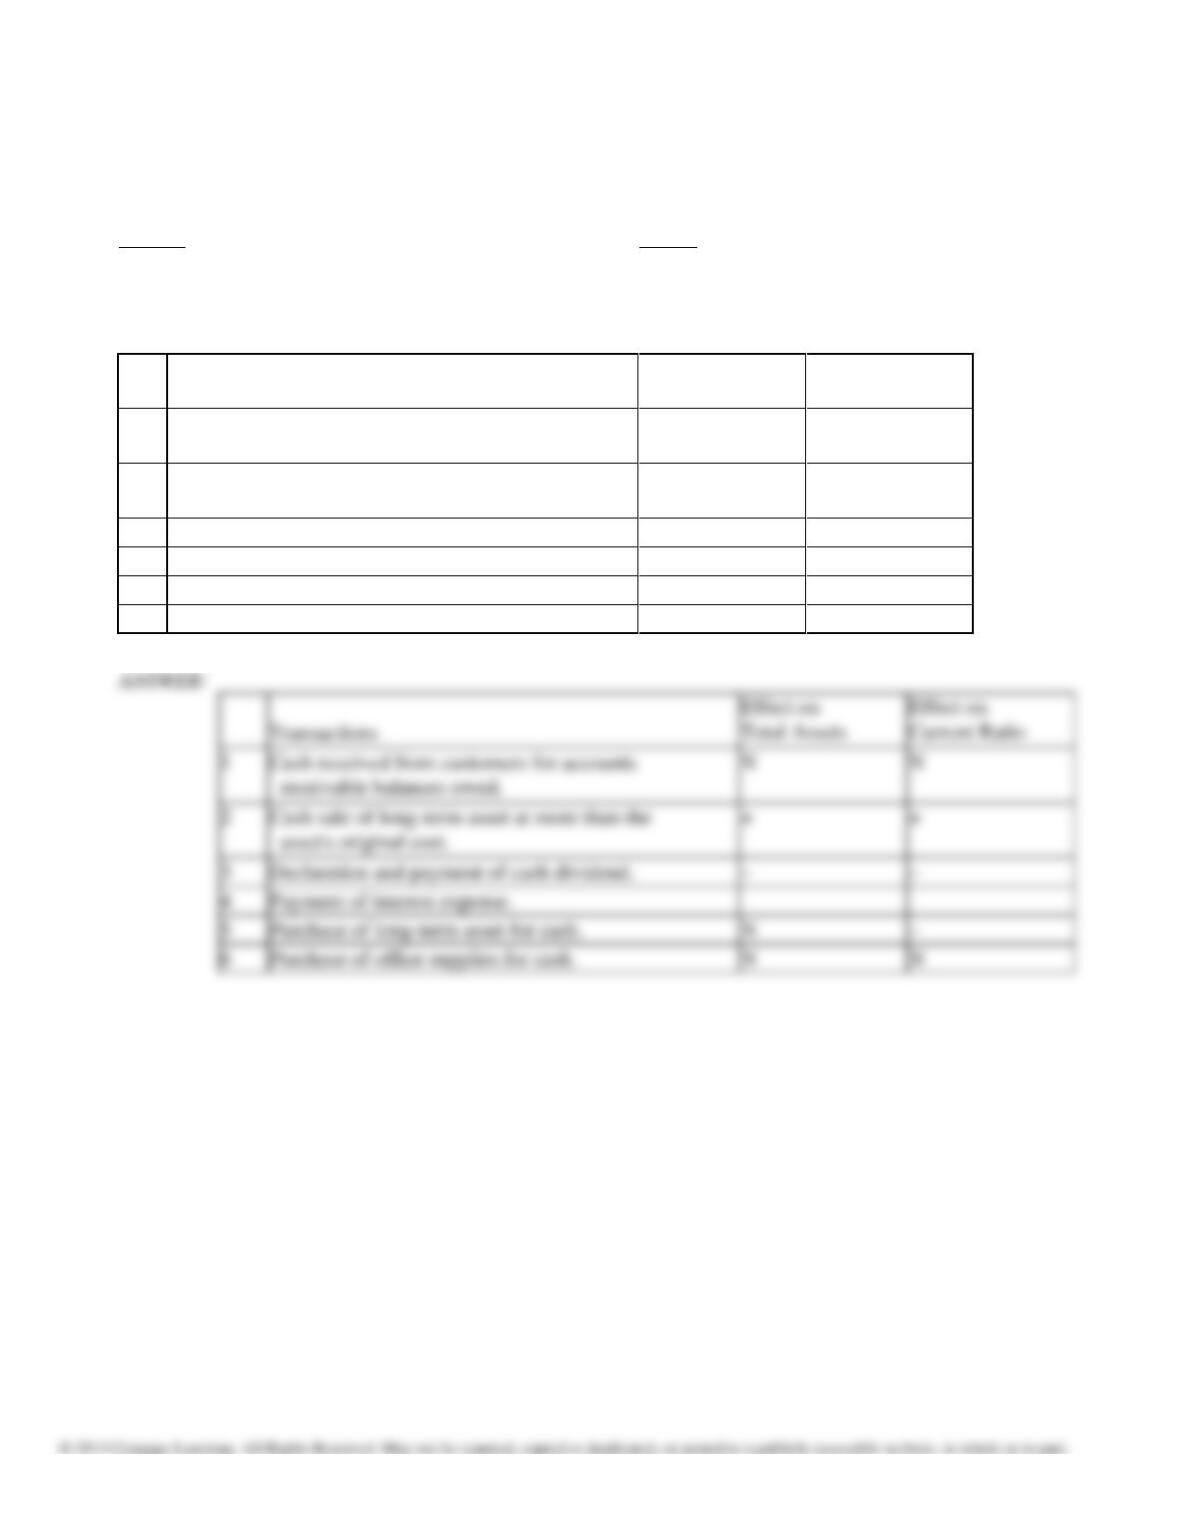
181. Assume that the current ratio is 2:1 for the company in question. Show the effect of each of the transactions below
on total assets and the current ratio by using one of the following symbols in each box to complete the table. If the
numerator and denominator of a ratio both increase or both decrease by the same amount, the effect of the event on
the ratio is “insufficient data.”
Symbol Action
+ Increase
– Decrease
N No effect
O Insufficient data
Transactions
Effect on
Total Assets
Effect on
Current Ratio
1
Cash received from customers for accounts
receivable balances owed.
2
Cash sale of long-term asset at more than the
asset’s original cost.
3
Declaration and payment of cash dividend.
4
Payment of interest expense.
5
Purchase of long-term asset for cash.
6
Purchase of office supplies for cash.
Transactions
Effect on
Effect on
1
Cash received from customers for accounts
receivable balances owed.
N
N
2
Cash sale of long-term asset at more than the
asset’s original cost.
+
+
3
Declaration and payment of cash dividend.
4
Payment of interest expense.
5
Purchase of long-term asset for cash.
N
6
Purchase of office supplies for cash.
N
N
Chapter 13: Financial Statement Analysis
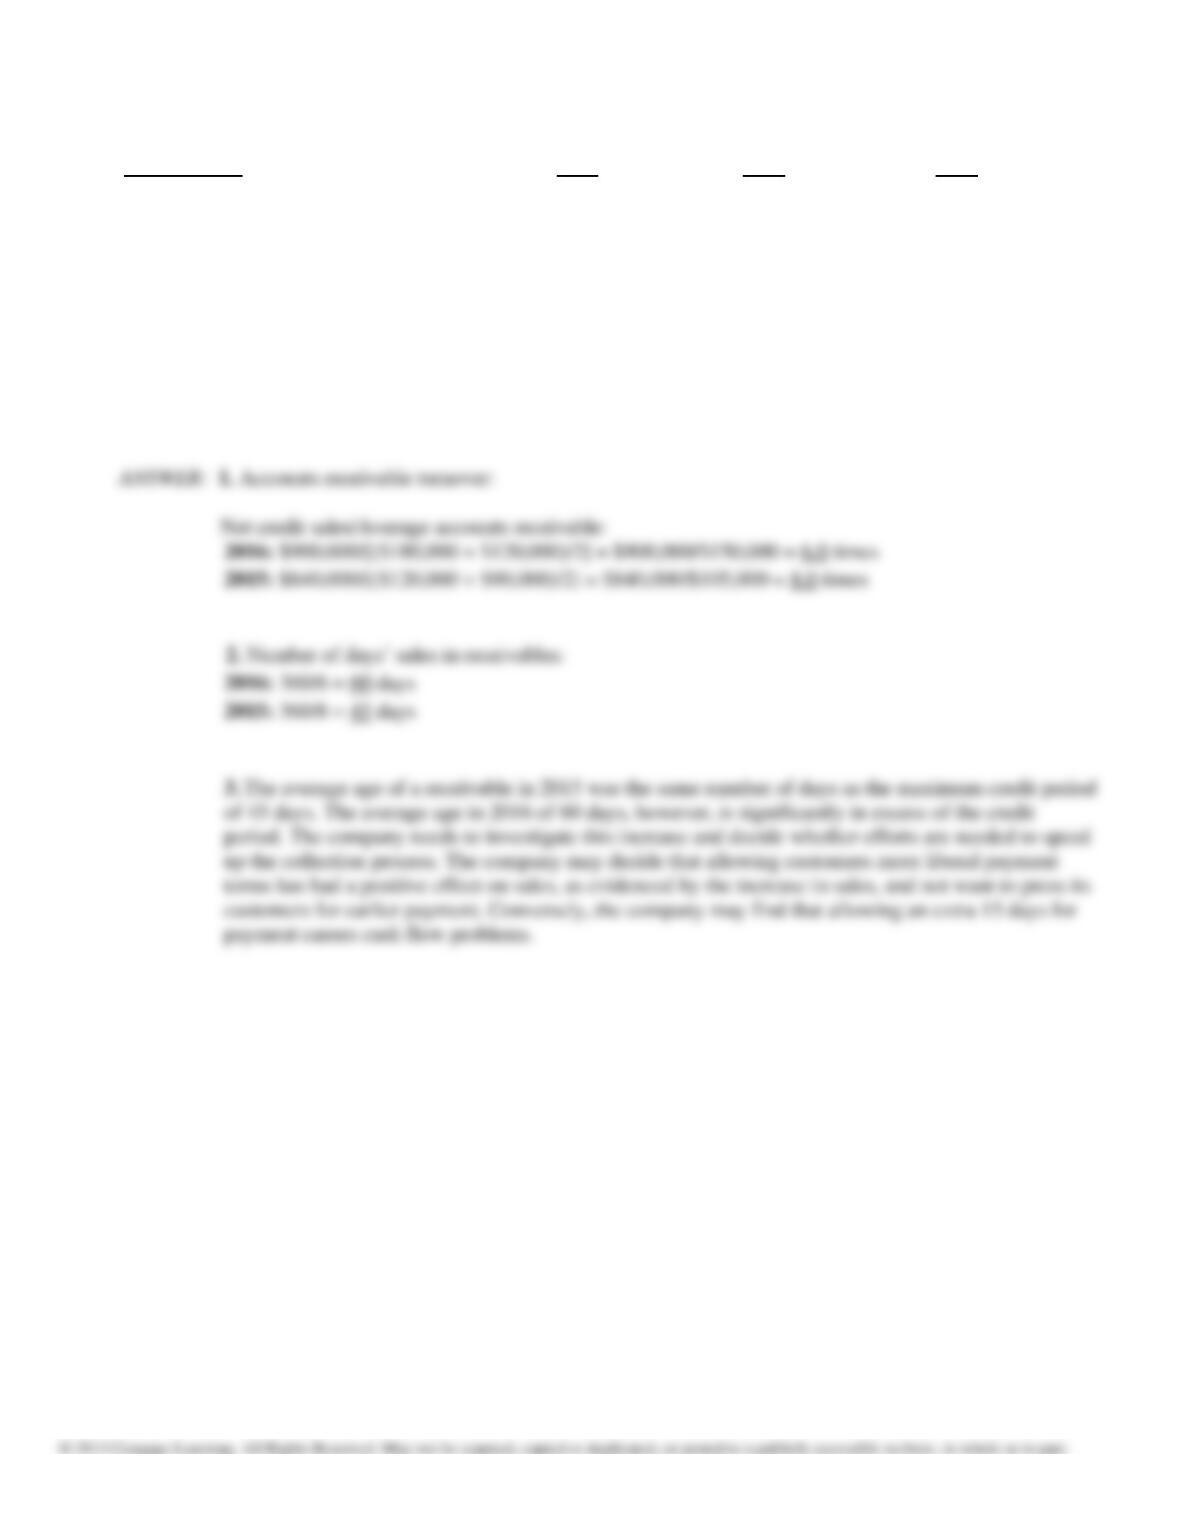
182. The following account balances are taken from the records of the Odessa Industries:
December 31
2016
2015
2014
Accounts receivable
$180,000
$120,000
$90,000
Net credit sales
$900,000
$840,000
Odessa extends credit terms requiring full payment in 45 days, with no discount for early payment.
REQUIRED:
1. Compute Odessa’s accounts receivable turnover ratio for 2016 and 2015.
2. Compute the number of days’ sales in receivables for 2016 and 2015. Assume 360 days in a year.
3. Comment on the efficiency of Odessa’s collection efforts over the twoyear period.

Chapter 13: Financial Statement Analysis
Culinary Delights Company
Use the financial statements for Culinary Delights Company to answer the questions that follow.
Consolidated Statement of Earnings and Retained Earning
Year ended December 31,
2016
2015
2014
In thousands of dollars except for per share amounts
Earnings
Revenues:
Net sales
$2,004,719
$1,937,021
$1,835,987
Investment and other income
18,636
17,153
14,614
Total revenues
$2,023,355
$1,954,174
$1,850,601
Costs and expenses:
Cost of goods sold
$ 848,363
$ 847,366
$ 814,483
Costs (gain) related to factory closure
and sale
(10,404)
3,300
10,436
Selling, distribution and general
administrative
743,902
708,310
656,473
Interest
615
958
1,097
Total cost and expenses
$1,582,476
$1,559,934
$1,482,489
Earnings before income taxes
$ 440,879
$ 394,240
$ 368,112
Income taxes
136,378
122,614
128,840
Net earnings
$ 304,501
$ 271,626
$ 239,272
Retained Earnings
Retained earnings at beginning of year
$1,032,139
$ 898,512
$ 497,481
Dividends declared
(per share: 2016—$1.31; 2015—$1.19)
(152,023)
(137,999)
(87,301)
Retained earnings at end of year
$1,184,617
$1,032,139
$ 649,452
Per Share Amounts
Net earnings per average share of
common stock
$2.63
$2.34
$1.99
Dividends paid per share of common
stock
$1.30
$1.17
$1.02
Chapter 13: Financial Statement Analysis
Consolidated Balance Sheets
at December 31
2016
2015
ASSETS
In thousands of dollars
Current assets:
Cash and cash equivalents
$ 214,572
$ 206,627
Short-term investments, at amortized cost
137,112
120,728
Accounts receivable, net
194,877
175,967
Inventory
256,108
247,392
Other prepaid assets
25,376
30,538
Deferred income taxes—current
15,027
16,421
Total current assets
$ 843,072
$ 797,673
Marketable equity securities, at fair value
39,888
26,375
Deferred charges and other assets
92,183
59,566
Deferred income taxes—noncurrent
25,522
29,038
Property, plant, and equipment, at cost:
Land
$ 36,013
$ 26,298
Buildings and building equipment
310,212
277,808
Machinery and equipment
642,556
566,766
$ 988,781
$ 870,872
Less accumulated depreciation
468,691
440,398
$ 520,090
$ 430,474
Total assets
$1,520,755
$1,343,126
LIABILITIES AND STOCKHOLDERS’ EQUITY
2016
2015
Current liabilities:
Accounts payable
$ 76,691
$ 71,001
Accrued expenses
67,848
78,378
Dividends payable
23,222
22,034
Income and other taxes payable
49,491
53,460
Deferred income taxes—current
1,374
943
Total current liabilities
$ 218,626
$ 225,816
Deferred income taxes—noncurrent
$ 40,312
$ 30,874
Other noncurrent liabilities
104,885
101,057
Stockholders’ equity:
Preferred stock—no par, Auth. 20,000 shares;
Issued 0
Common stock—no par, Auth. 400,000
shares; Issued 2016: 93,007; 2015: 92,545
$ 12,401
$ 2,339
Class B common—conv. Auth. 80,000 shares;
Issued 2016: 23,214; 2015: 23,676
3,095
3,157
Additional paid-in capital
272
226
Retained earnings
1,184,617
1,032,139
Foreign currency translation adjustment
(61,339)
(65,034)
Unrealized holding gains on marketable equity
securities
24,698
25,915
Common stock in treasury, at cost
(2016: 111 shares; 2015: 252 shares)
(6,712)
(13,363)
Total stockholders’ equity
$1,157,032
$ 985,379
Total liabilities and stockholders’ equity
$1,520,855
$1,343,126
Chapter 13: Financial Statement Analysis
183. Refer to the financial statements from Culinary Delights Company.
REQUIRED:
(A) Calculate the company’s current and acid-test ratios for 2016. Would you lend this company $4,000,000 at
10% over a one-year period? Explain. (Note: The statements provided are in “thousands.”)
(B) Suppose the company has credit terms of 20 days and all sales are on credit. During 2016, what credit
management problems does this company have, if any? Explain
184. Refer to the financial statements of Culinary Delights Company.
REQUIRED:
(A) Culinary Delights’ cash flow from operations for 2016 is $323,847 (in thousands). Evaluate Culinary Delights’
short-term cash flow position during 2016. Is the company in danger of problems? Explain.
(B) Evaluate Culinary Delights’ inventory management during 2016.
Chapter 13: Financial Statement Analysis
185. Refer to the financial statements of Culinary Delights Company.
REQUIRED:
(A) Calculate Culinary Delights’ return on sales ratio for 2016 and 2015. Assume that the income tax rate is 30%.
What information is provided with this ratio?
(B) Calculate the return on common stockholders’ equity ratio for 2016 and 2015. Stockholders’ equity at
December 31, 2014, was $897,431 (in thousands). Why is the denominator an average instead of a single amount?
186. The following account balances are taken from the records of Clarke Inc., a wholesaler:
December 31
2012
2011
2010
Merchandise inventory
$ 240,000
$180,000
$150,000
Cost of goods sold
REQUIRED:
$6,400,000
$9,600,000
1. Compute Clarke’s inventory turnover ratio for 2016 and 2015.
2. Compute the number of days’ sales in inventory for 2016 and 2015. Assume 360 days in a year.
3. Comment on your answers in (1) and (2) relative to the company’s management of inventory over the two years.
What problems do you see in its inventory management?
Chapter 13: Financial Statement Analysis
187. The following information was obtained from the 2016 and 2015 financial statements Better Books and
Tenacious Texts. Assume all sales are on credit for both companies.
(in millions) Better Books Tenacious Texts
Accounts and notes receivable, net 12/31/16 $ 3,100 $ 4,800
12/31/15 3,320 4,500
Inventories 12/31/16 2,080 2,530
12/31/15 2,250 2,320
Net revenue 2016 32,010 44,050
2015 28,900 39,500
Cost of goods sold 2016 11,370 20,350
2015 10,400 18,000
REQUIRED:
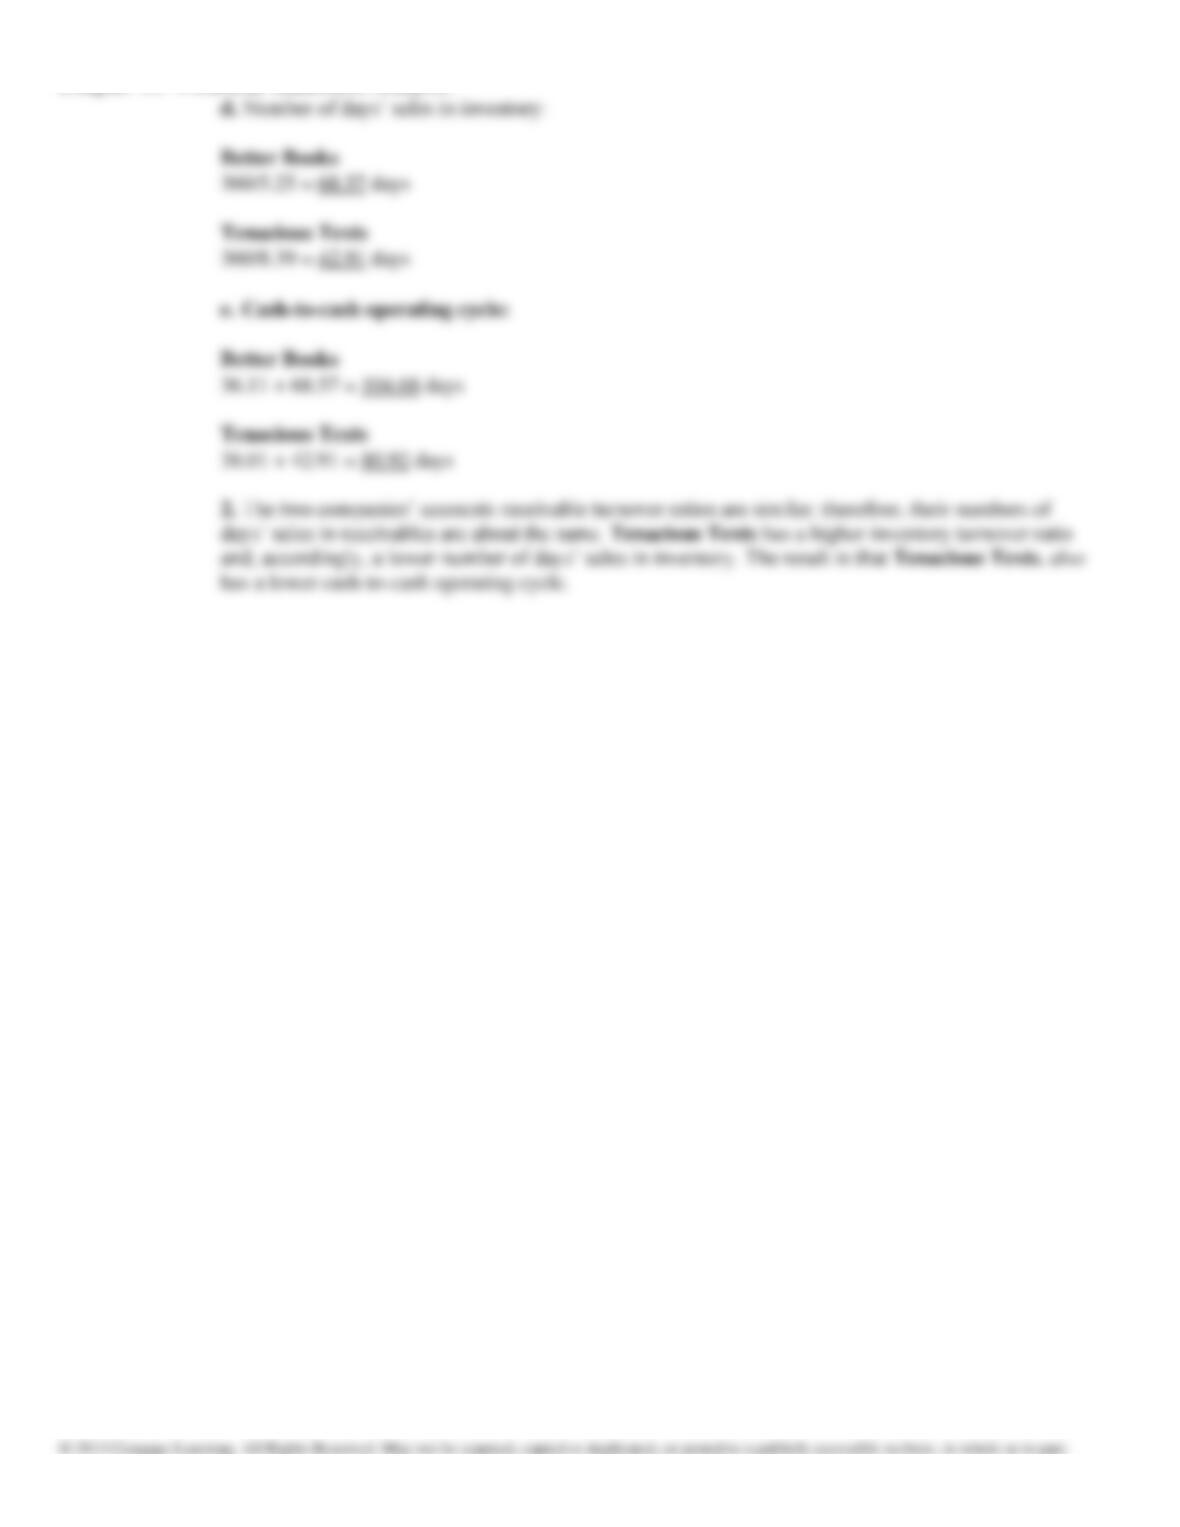
1. Using the information provided, compute the following for each company for 2016(rounded to two decimals):
a. Accounts receivable turnover ratio
b. Number of days’ sales in receivables
c. Inventory turnover ratio
d. Number of days’ sales in inventory
e. Cash-to-cash operating cycle
2. Comment briefly on the liquidity of each of these two companies.
Chapter 13: Financial Statement Analysis
Chapter 13: Financial Statement Analysis
188. The following information was summarized from the balance sheets of the Better Books and Tenacious Texts
at December 31, 2016:
(in millions)
Better Books
Tenacious Texts
Cash and cash equivalents
$ 5,800
$ 3,150
Short-term investments/marketable securities
280
210
Accounts and notes receivables, net*
3,100
4,700
Inventories
2,200
2,500
Prepaid expenses and other current assets
1,920
1,320
Total current assets
$13,300
$11,880
Current liabilities
$13,900
$ 9,800
REQUIRED:
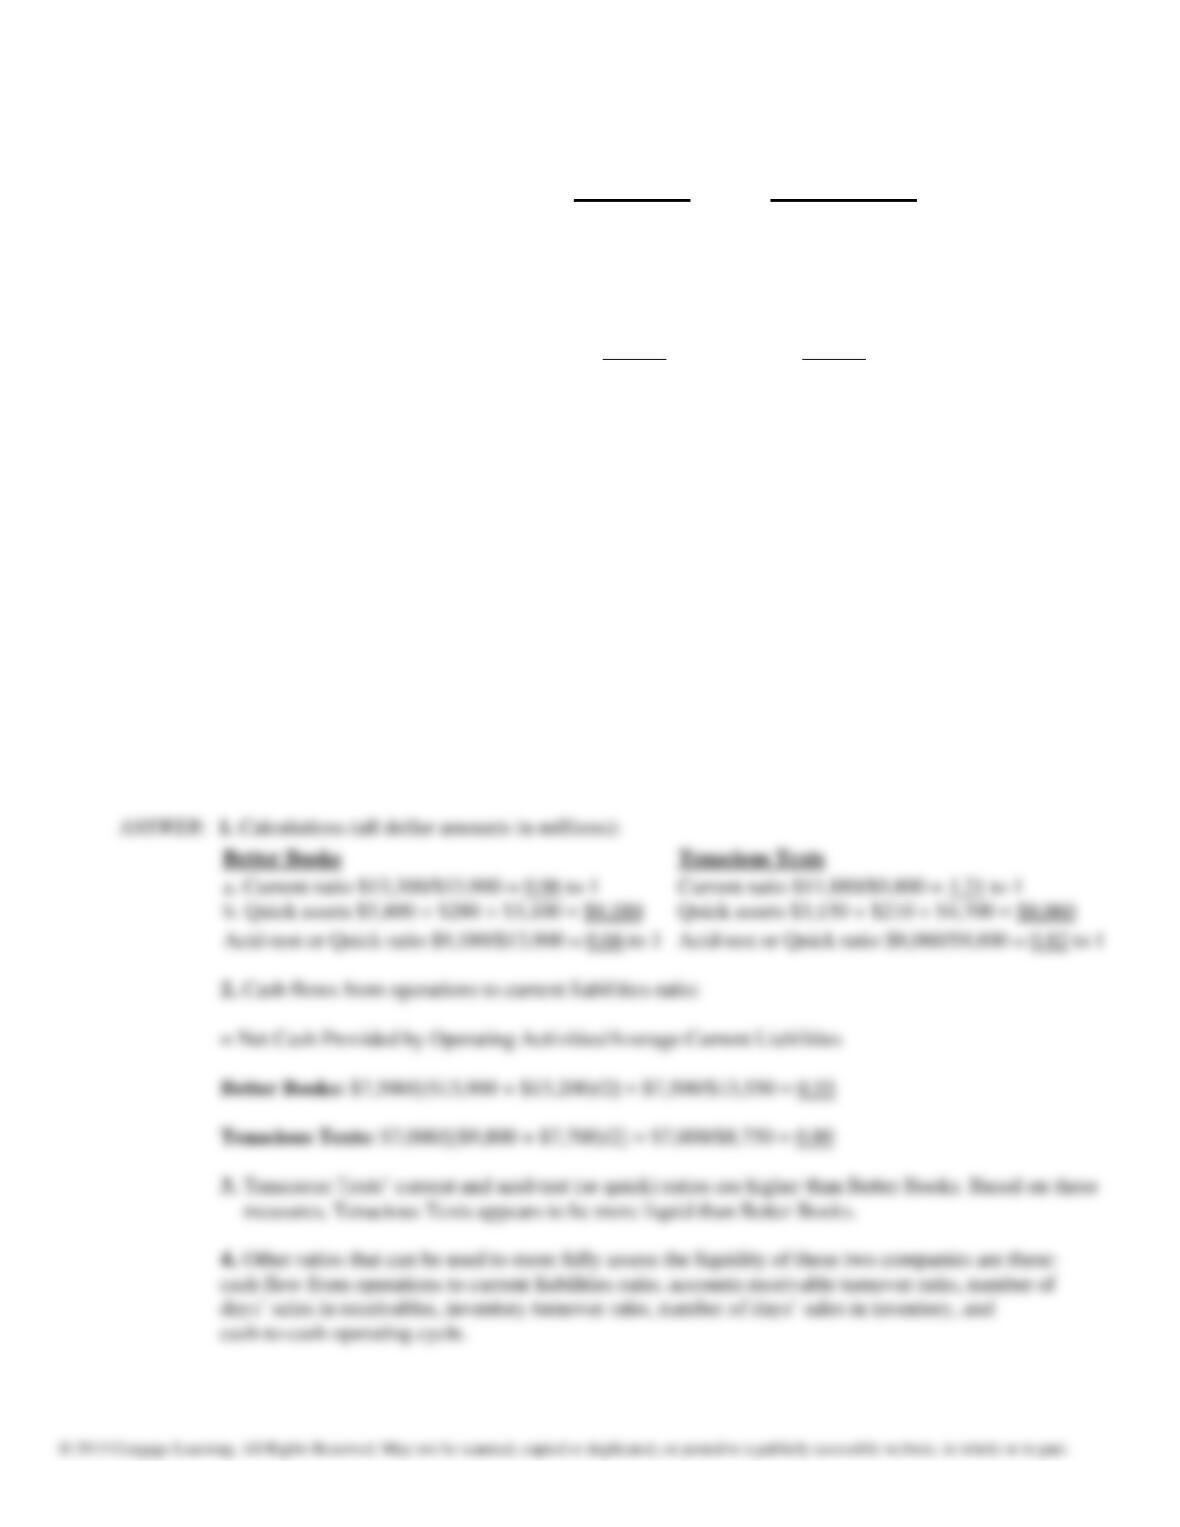
1. Using the information provided, compute the following for each company at the end of 2016:
a. Current ratio
b. Quick ratio
2. Better Books reported cash flow from operations of $7,500 million during 2016. Tenacious Texts reported
cash flow from operations of $7,000 million. Current liabilities reported by Better Books and Tenacious Texts at
December 31, 2015, were $13,200 million and $7,700 million, respectively. Compute the cash flow from
operations to current liabilities ratio for each company for 2016.
3. Comment briefly on the liquidity of each of these two companies. Which appears to be more liquid?
4. What other ratios would help you more fully assess the liquidity of these companies?
Chapter 13: Financial Statement Analysis
189. Show the effect of each of the transactions below on total liabilities and the debt–to-equity ratio by using one of the
following symbols in each box to complete the table. If the numerator and denominator of a ratio both increase or
both decrease by the same amount, the effect of the event on the ratio is “insufficient data.”
Symbol Action
+ Increase
– Decrease
N No effect
O Insufficient data
Transactions
Effect on
Total
Liabilities
Effect on
Debt-to-Equity
Ratio
1
Cash received from customers for accounts receivable
balances owed.
2
Declaration and payment of cash dividend.
3
Purchase of long-term asset for cash.
Effect on
Effect on
Ratio
2
Declaration and payment of cash dividend.
N
+
3
Purchase of long-term asset for cash.
N
N
Chapter 13: Financial Statement Analysis
190. The following information was obtained from the comparative financial statements included in Arco Inc.’s 2016
annual report. (All amounts are in millions of dollars.)
12/31/16
12/31/15
Total liabilities
$95,050
$90,960
Total stockholders’ equity
13,460
27,470
For the Years Ended
12/31/16
12/31/15
Interest expense
$ 730
$ 600
Provision for income taxes
4,300
4,070
Net income
14,000
10,400
Net cash provided by operating activities
from continuing operations
18,700
16,000
Cash dividends paid
2,450
2,010
Payments for plant, rental machines and other property
4,010
4,630
Payments to settle debt
10,000
11,530
REQUIRED:
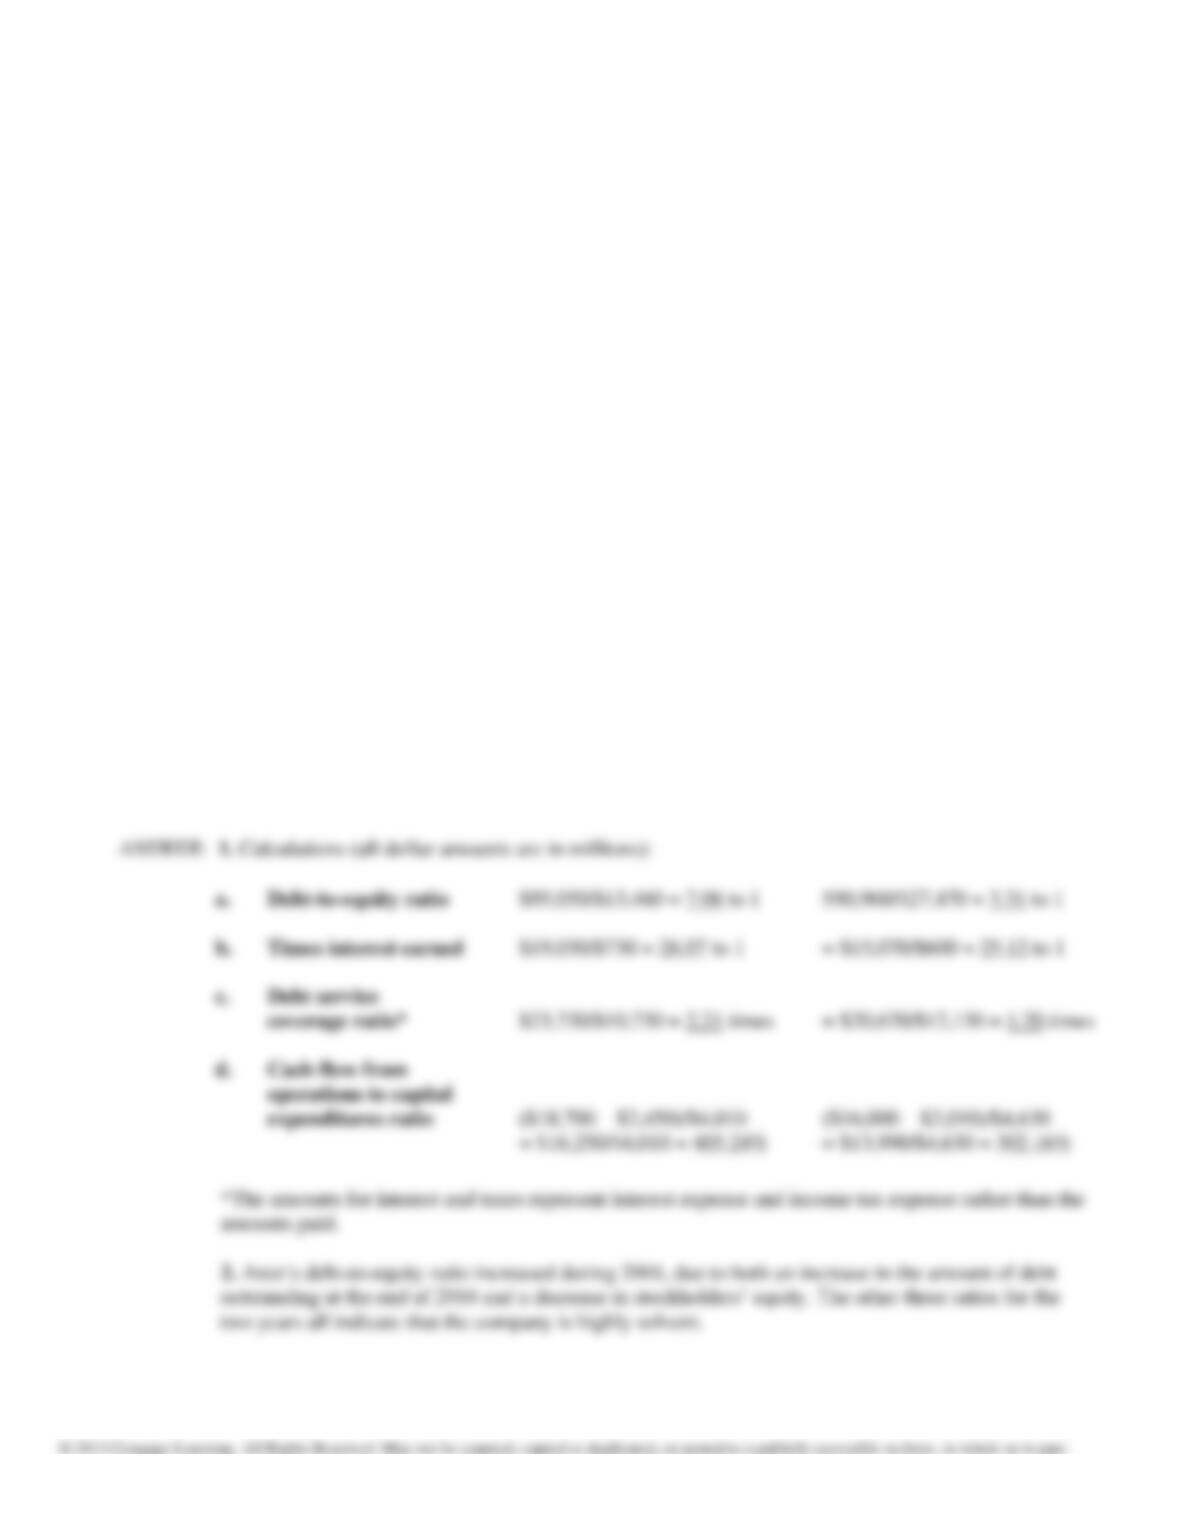
1. Using the information provided, compute the following for 2016 and 2015:
a. Debt-to-equity ratio (at each year-end)
b. Times interest earned ratio
c. Debt service coverage ratio
d. Cash flow from operations to capital expenditures ratio
2. Comment briefly on the company’s solvency.
Chapter 13: Financial Statement Analysis
191. Kim Chen Corporation is a wholesaler of scuba gear. During 2016, Chen expanded its retail business by adding
over 50 dive shops. The following information is obtained from the comparative financial statements included in
the company’s 2016 annual report (all amounts are in thousands of dollars):
Total liabilities
Dec. 31, 2016
$26,000
Dec. 31, 2015
$18,000
Total stockholders’ equity
34,000
38,000
FOR THE FISCAL YEARS ENDED
Depreciation expense
Dec. 31, 2016
$ 2,000
Dec. 31, 2015
$ 6,000
Interest expense
3,400
3,200
Income tax expense
12,600
18,100
Net income
6,000
15,000
Net cash provided by (used by) operations
41,000
(400)
Total dividends paid
2,000
12,000
Cash used to purchase plant assets
32,000
18,000
Payments on long-term debt
1,600
1,800
1) Using the information provided above, compute the following for 2016 and 2015:
A. Debt-to-equity ratio (at each year-end)
B. Times interest earned ratio
2) Comment briefly on the company’s solvency.
3) What other ratios will help you assess the solvency? What information will they provide
that you do not already have concerning the company’s solvency?
Chapter 13: Financial Statement Analysis
192. The following information is available from the balance sheets at the end of 2016 and 2015 for Riverside Company:
2016
2015
Accounts payable
$ 80,000
$ 40,000
Accrued liabilities
65,000
25,000
Taxes payable
10,000
20,000
Short-term notes payable
-0-
60,000
Bonds payable due within next year
200,000
200,000
Total current liabilities
$ 355,000
$ 345,000
Bonds payable
$ 800,000
$ 300,000
Common stock, $5 par
$1,000,000
$1,000,000
Retained earnings
695,000
55,000
Total stockholders’ equity
$1,695,000
$1,055,000
Total liabilities and stockholders’ equity
$2,850,000
$1,700,000
Net income for 2016 and 2015 was $340,000 and $300,000, respectively. Answer the following:
A) Calculate the return on common stockholders’ equity ratio for 2016.
B) What information is provided to users with the calculation in part A? Explain.
C) What is the difference between the return on stockholders’ equity ratio and the
return on assets ratio?