Financial Analysis: The Big Picture
FOR INSTRUCTOR USE ONLY
13–41
MC 177. (Cont.)
What is the price earnings ratio for this company?
a. 6.0 times
b. 2.5 times
c. 8.0 times
d. 4.0 times
178. Junebag Corporation reported net income $24,000; net sales $400,000; and average
assets $600,000 for 2017. What is the 2017 profit margin?
a. 6%
b. 4%
c. 40%
d. 67%
179. The following information pertains to Blue Flower Company. Assume that all balance sheet
amounts represent both average and ending balance figures. Assume that all sales were
on credit.
Assets
Cash and short-term investments $ 45,000
Accounts receivable (net) 30,000
Inventory 25,000
Property, plant and equipment 210,000
Total Assets $310,000
Liabilities and Stockholders’ Equity
Current liabilities $ 60,000
Long-term liabilities 95,000
Stockholders’ equity—common 155,000
Total Liabilities and Stockholders’ Equity $310,000
Income Statement
Sales revenue $ 116,000
Cost of goods sold 66,000
Gross margin 50,000
Operating expenses 30,000
Net income $ 20,000
Number of shares of common stock 6,000
Market price of common stock $20
Dividends per share on common stock .50
Cash provided by operations $35,000
Test Bank for Financial Accounting: Tools for Business Decision Making, Eighth Edition
13–42
MC 179. (Cont.)
What is the current ratio for this company?
a. 1.17
b. 1.25
c. 1.67
d. 0.75
180. The following information pertains to Blue Flower Company. Assume that all balance sheet
amounts represent both average and ending balance figures. Assume that all sales were
on credit.
Assets
Cash and short-term investments $ 45,000
Accounts receivable (net) 30,000
Inventory 25,000
Property, plant and equipment 210,000
Total Assets $310,000
Liabilities and Stockholders’ Equity
Current liabilities $ 60,000
Long-term liabilities 95,000
Stockholders’ equity—common 155,000
Total Liabilities and Stockholders’ Equity $310,000
Income Statement
Sales revenue $ 116,000
Cost of goods sold 66,000
Gross margin 50,000
Operating expenses 30,000
Net income $ 20,000
Number of shares of common stock 6,000
Market price of common stock $20
Dividends per share on common stock .50
Cash provided by operations $35,000
What is the accounts receivable turnover for this company?
a. 2.2 times
b. 4.4 times
c. 7.7 times
d. 3.9 times
Financial Analysis: The Big Picture
13–43
181. The following information pertains to Blue Flower Company. Assume that all balance sheet
amounts represent both average and ending balance figures. Assume that all sales were
on credit.
Assets
Cash and short-term investments $ 45,000
Accounts receivable (net) 30,000
Inventory 25,000
Property, plant and equipment 210,000
Total Assets $310,000
Liabilities and Stockholders’ Equity
Current liabilities $ 60,000
Long-term liabilities 95,000
Stockholders’ equity—common 155,000
Total Liabilities and Stockholders’ Equity $310,000
Income Statement
Sales revenue $ 116,000
Cost of goods sold 66,000
Gross margin 50,000
Operating expenses 30,000
Net income $ 20,000
Number of shares of common stock 6,000
Market price of common stock $20
Dividends per share on common stock .50
Cash provided by operations $35,000
What is the inventory turnover for this company?
a. 2.6 times
b. 4.6 times
c. 5.3 times
d. 0.38 time
Test Bank for Financial Accounting: Tools for Business Decision Making, Eighth Edition
13–44
182. The following information pertains to Blue Flower Company. Assume that all balance sheet
amounts represent both average and ending balance figures. Assume that all sales were
on credit.
Assets
Cash and short-term investments $ 45,000
Accounts receivable (net) 30,000
Inventory 25,000
Property, plant and equipment 210,000
Total Assets $310,000
Liabilities and Stockholders’ Equity
Current liabilities $ 60,000
Long-term liabilities 95,000
Stockholders’ equity—common 155,000
Total Liabilities and Stockholders’ Equity $310,000
Income Statement
Sales revenue $ 116,000
Cost of goods sold 66,000
Gross margin 50,000
Operating expenses 30,000
Net income $ 20,000
Number of shares of common stock 6,000
Market price of common stock $20
Dividends per share on common stock .50
Cash provided by operations $35,000
What is the return on assets for this company?
a. 16.1%
b. 11.3%
c. 6.5%
d. 12.9%
Financial Analysis: The Big Picture
FOR INSTRUCTOR USE ONLY
13–45
183. The following information pertains to Blue Flower Company. Assume that all balance sheet
amounts represent both average and ending balance figures. Assume that all sales were
on credit.
Assets
Cash and short-term investments $ 45,000
Accounts receivable (net) 30,000
Inventory 25,000
Property, plant and equipment 210,000
Total Assets $310,000
Liabilities and Stockholders’ Equity
Current liabilities $ 60,000
Long-term liabilities 95,000
Stockholders’ equity—common 155,000
Total Liabilities and Stockholders’ Equity $310,000
Income Statement
Sales revenue $ 116,000
Cost of goods sold 66,000
Gross margin 50,000
Operating expenses 30,000
Net income $ 20,000
Number of shares of common stock 6,000
Market price of common stock $20
Dividends per share on common stock .50
Cash provided by operations $35,000
What is the profit margin for this company?
a. 34.5%
b. 43.1%
c. 25.8%
d. 17.2%
184. The following information pertains to Blue Flower Company. Assume that all balance sheet
amounts represent both average and ending balance figures. Assume that all sales were
on credit.
Assets
Cash and short-term investments $ 45,000
Accounts receivable (net) 30,000
Inventory 25,000
Property, plant and equipment 210,000
Total Assets $310,000
Liabilities and Stockholders’ Equity
Current liabilities $ 60,000
Long-term liabilities 95,000
Stockholders’ equity—common 155,000
Total Liabilities and Stockholders’ Equity $310,000
Test Bank for Financial Accounting: Tools for Business Decision Making, Eighth Edition
FOR INSTRUCTOR USE ONLY
13–46
MC 184. (Cont.)
Income Statement
Sales revenue $ 116,000
Cost of goods sold 66,000
Gross margin 50,000
Operating expenses 30,000
Net income $ 20,000
Number of shares of common stock 6,000
Market price of common stock $20
Dividends per share on common stock .50
Cash provided by operations $35,000
What is the return on common stockholders’ equity for this company?
a. 25.8%
b. 12.9%
c. 22.6%
d. 32.3%
185. The following information pertains to Blue Flower Company. Assume that all balance sheet
amounts represent both average and ending balance figures. Assume that all sales were
on credit.
Assets
Cash and short-term investments $ 45,000
Accounts receivable (net) 30,000
Inventory 25,000
Property, plant and equipment 210,000
Total Assets $310,000
Liabilities and Stockholders’ Equity
Current liabilities $ 60,000
Long-term liabilities 95,000
Stockholders’ equity—common 155,000
Total Liabilities and Stockholders’ Equity $310,000
Income Statement
Sales revenue $ 116,000
Cost of goods sold 66,000
Gross margin 50,000
Operating expenses 30,000
Net income $ 20,000
Number of shares of common stock 6,000
Market price of common stock $20
Dividends per share on common stock .50
Cash provided by operations $35,000
Financial Analysis: The Big Picture
13–47
MC 185. (Cont.)
What is the price-earnings ratio for this company?
a. 2.4 times
b. 2.0 times
c. 3.4 times
d. 6.0 times
186. The following information is available for Patterson Company:
2017 2016
Accounts receivable $ 360,000 $ 340,000
Inventory 280,000 320,000
Net credit sales 3,150,000 2,600,000
Cost of goods sold 1,800,000 840,000
Net income 300,000 170,000
The accounts receivable turnover for 2017 is
a. 8.8 times.
b. 4.5 times.
c. 9.0 times.
d. 9.3 times.
187. The following information is available for Patterson Company:
2017 2016
Accounts receivable $ 360,000 $ 340,000
Inventory 280,000 320,000
Net credit sales 3,000,000 1,400,000
Cost of goods sold 1,800,000 840,000
Net income 300,000 170,000
The inventory turnover for 2017 is
a. 6.4 times.
b. 6.0 times.
c. 5.6 times.
d. 3.0 times.
Test Bank for Financial Accounting: Tools for Business Decision Making, Eighth Edition
13–48
188. The following amounts were taken from the financial statements of R.Dodd Company:
2017 2016
Current liabilities $1,280,000 $1,220,000
Long-term liabilities 1,800,000 1,600,000
Interest expense 100,000 50,000
Income tax expense 50,000 30,000
Net income 300,000 170,000
Net cash provided by operating activity 325,000 270,000
The times interest earned for 2017 is
a. 3.0 times.
b. 3.5 times.
c. 4.0 times.
d. 4.5 times.
189. The following amounts were taken from the financial statements of Ando Company:
2017 2016
Total assets $800,000 $1,000,000
Net sales 720,000 650,000
Gross profit 352,000 320,000
Net income 108,000 117,000
Weighted average number of
common shares outstanding 90,000 90,000
Market price of common stock $42 $39
The return on assets for 2017 is
a. 14%.
b. 12%.
c. 11%.
d. 6%.
Financial Analysis: The Big Picture
13–49
190. The following amounts were taken from the financial statements of Ando Company:
2017 2016
Total assets $800,000 $1,000,000
Net sales 720,000 650,000
Gross profit 352,000 320,000
Net income 108,000 117,000
Weighted average number of
common shares outstanding 90,000 90,000
Market price of common stock $42 $39
The profit margin ratio for 2017 is
a. 14%.
b. 16%.
c. 15%.
d. 18%.
191. The following amounts were taken from the financial statements of Ando Company:
2017 2016
Total assets $800,000 $1,000,000
Net sales 720,000 650,000
Gross profit 352,000 320,000
Net income 108,000 117,000
Weighted average number of
common shares outstanding 90,000 90,000
Market price of common stock $42 $39
The price-earnings ratio for 2017 is
a. 35 times.
b. 30 times.
c. 42 times.
d. 3 times.
192. Solvency is of most interest to
a. short-term creditors.
b. stockholders.
c. competitors.
d. long-term creditors.
193. The current ratio would be of most interest to
a. short-term creditors.
b. long-term creditors.
c. stockholders.
d. customers.
Test Bank for Financial Accounting: Tools for Business Decision Making, Eighth Edition
13–50
194. Which measure(s) is(are) an evaluation of a company’s ability to pay current liabilities?
1. Current ratio.
2. Free cash flow
a. Both 1 and 2.
b. Neither 1 nor 2.
c. 1 only.
d. 2 only
195. Which measure(s) is(are) useful in evaluating the efficiency in managing inventories?
1. Inventory turnover
2. Days in inventory
a. 1 only.
b. 2 only.
c. Both 1 and 2.
d. Neither 1 nor 2.
196. Which of these is not a liquidity ratio?
a. Current ratio
b. Asset turnover
c. Inventory turnover
d. Accounts receivable turnover
197. Akers Corporation reported net income $36,000; net sales $480,000; and average assets
$800,000 for 2017. What is the 2017 profit margin?
a. 4.5%
b. 7.5%
c. 13.3%
d. 60.0%
198. Beta Corporation had net income of $325,000 and paid dividends to common stockholders
of $39,000 in 2017. The weighted average number of shares outstanding in 2017 was
50,000 shares. Beta Corporation’s common stock is selling for $52 per share on the New
York Stock Exchange. Beta Corporation‘s price-earnings ratio is
a. 12.5 times.
b. 8.0 times.
c. 6.5 times.
d. 9.1 times.
Financial Analysis: The Big Picture
13–51
199. Bertram Corporation had net income of $325,000 and paid dividends to common
stockholders of $39,000 in 2017. The weighted average number of shares outstanding in
2017 was 50,000 shares. Bertram Corporation’s common stock is selling for $52 per share
on the New York Stock Exchange. Bertram Corporation’s payout ratio for 2017 is
a. $6.5 per share.
b. 16%.
c. 12%.
d. 8.3%.
200. A successful discount retail store such as Kmart would probably have
a. a low inventory turnover.
b. a high inventory turnover.
c. zero profit margin.
d. low volume.
201. Net sales are $3,250,000, beginning total assets are $1,400,000, and the asset turnover is
2.5 times. What is the ending total asset balance?
a. $1,300,000
b. $1,200,000
c. $1,400,000
d. $1,500,000
202. All of the following are ways that a company’s current ratio would decrease except
a. purchasing inventory on account.
b. adding equal amounts to the numerator and denominator.
c. paying off one-third of its accounts payable.
d. paying cash for new equipment.
203. All of the following may be indicators of channel stuffing except
a. deep discounts to customers.
b. customers incentives for buying early.
c. an extremely good earnings period followed by several subsequent bad periods.
d. inventory levels that reflect seasonal demand levels.
Test Bank for Financial Accounting: Tools for Business Decision Making, Eighth Edition
13–52
204. The use of alternative accounting methods
a. is not a problem in ratio analysis because the footnotes disclose the method used.
b. may be a problem in ratio analysis even if disclosed.
c. is not a problem in ratio analysis since eventually all methods will lead to the same
end.
d. is only a problem in ratio analysis with respect to inventory.
205. Which situation below might indicate a company has a low quality of earnings?
a. Revenue is recorded when recognized
b. Repair costs are capitalized and then depreciated.
c. The financial statements are prepared in accordance with generally accepted
accounting principles.
d. The same accounting principles are used each year.
206. All of the following situtations below might indicate a company has a low quality of earnings
except
a. A lack of disclosure about guaranteed payments that were mentioned in the MD&A of
the annual report.
b. Maintenance costs are capitalized and then depreciated.
c. Revenue is recognized when earned.
d. Adoption of a different inventory method for each of the last three years.
Financial Analysis: The Big Picture
FOR INSTRUCTOR USE ONLY
13–53
Answers to Multiple Choice Questions
Test Bank for Financial Accounting: Tools for Business Decision Making, Eighth Edition
FOR INSTRUCTOR USE ONLY
13–54
BRIEF EXERCISES
Be. 207
Listed below are some selected Items that may appear on a corporate income statement. Indicate
the order in which these items would appear on an income statement. (The first one should be
assigned the number “1”, the second “2,” etc.)
_____ Income before income taxes
_____ Discontinued operations
_____ Net income
_____ Income from continuing operations
_____ Income tax expense
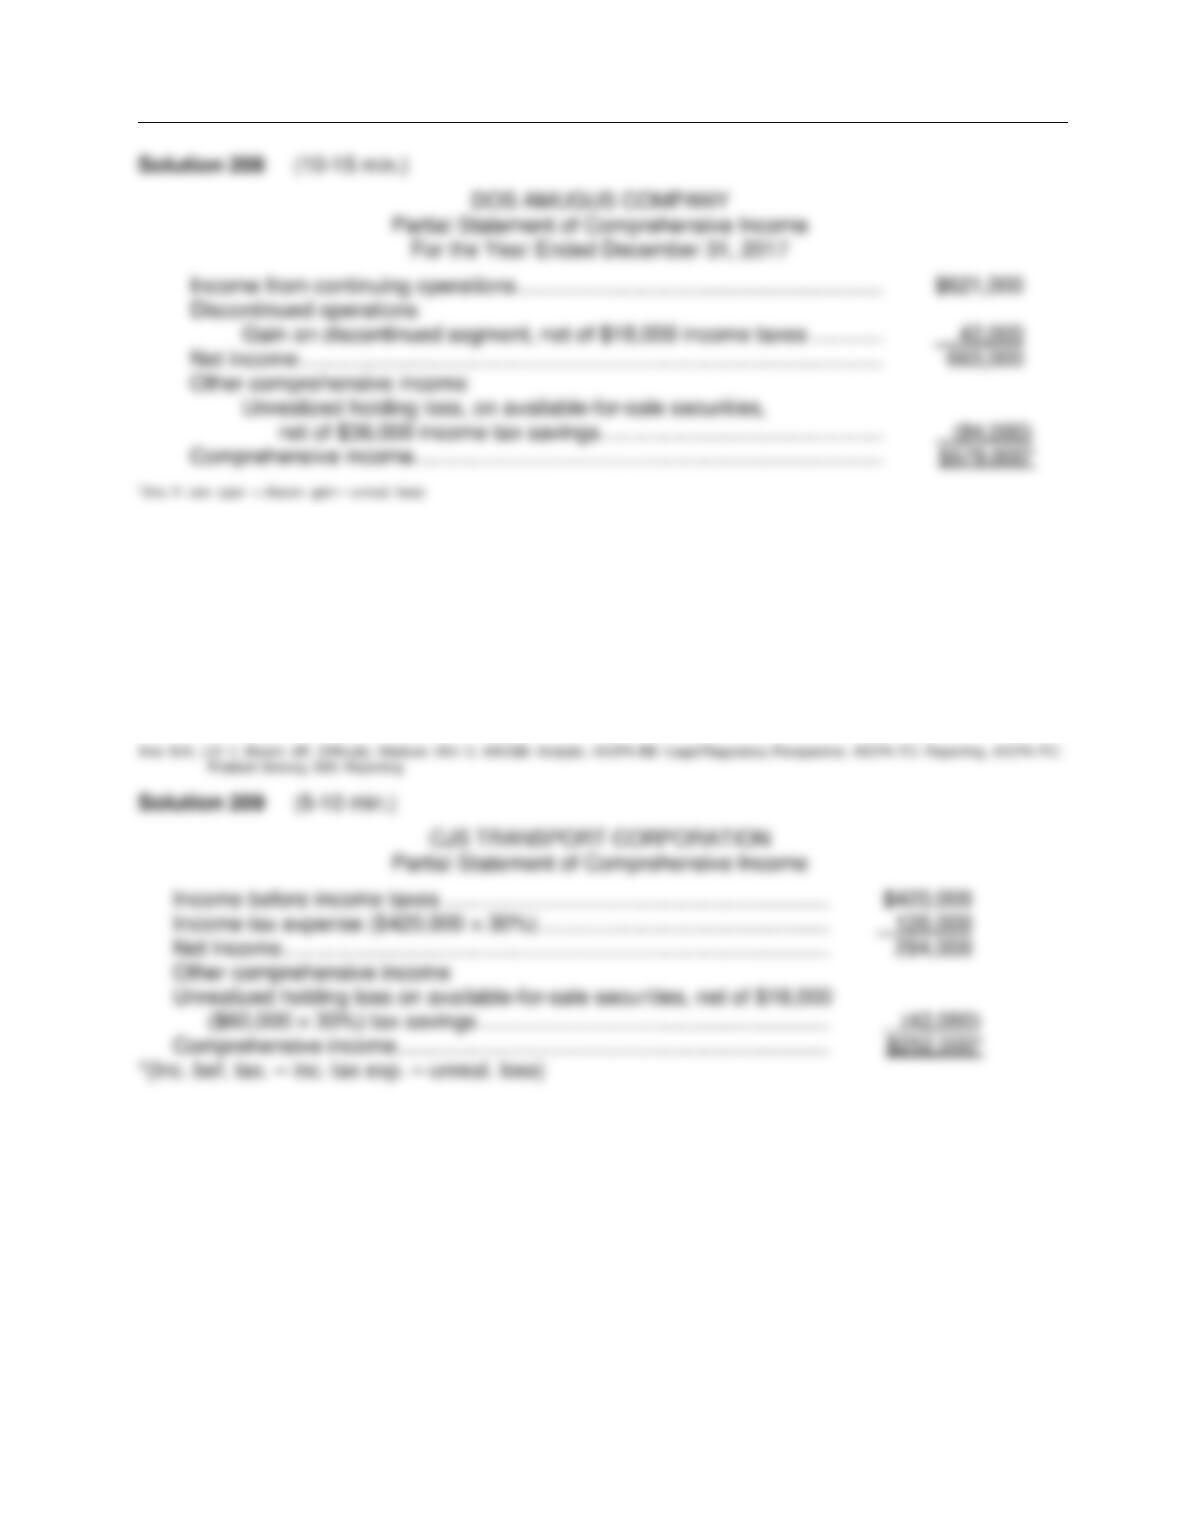
Be. 208
Dos Amugus Company has income from continuing operations of $621,000 (after tax) for the year
ended December 31, 2017. It also has the following items (before considering income taxes):
(1) An unrealized loss of $120,000 available-for-sale-securities.
(2) A gain of $60,000 on the discontinuance of a major component.
(3) A cumulative effect of a change in accounting principle that resulted in an increase in prior
years’ depreciation of $50,000.
Assume all items are subject to income taxes at a 30% tax rate.
Instructions
Prepare a statement of comprehensive income, beginning with income from continuing operations.
Financial Analysis: The Big Picture
FOR INSTRUCTOR USE ONLY
13–55
Be. 209
An inexperienced accountant for CJS Transport Corporation showed the following in CJS
Transport’s 2017 income statement: income before income taxes $420,000; and unrealized loss
on available-for-sale securities (before taxes) $60,000. The unrealized loss and income before
income taxes are both subject to a 30% tax rate.
Instructions
Prepare a corrected statement of income.
Test Bank for Financial Accounting: Tools for Business Decision Making, Eighth Edition
FOR INSTRUCTOR USE ONLY
13–56
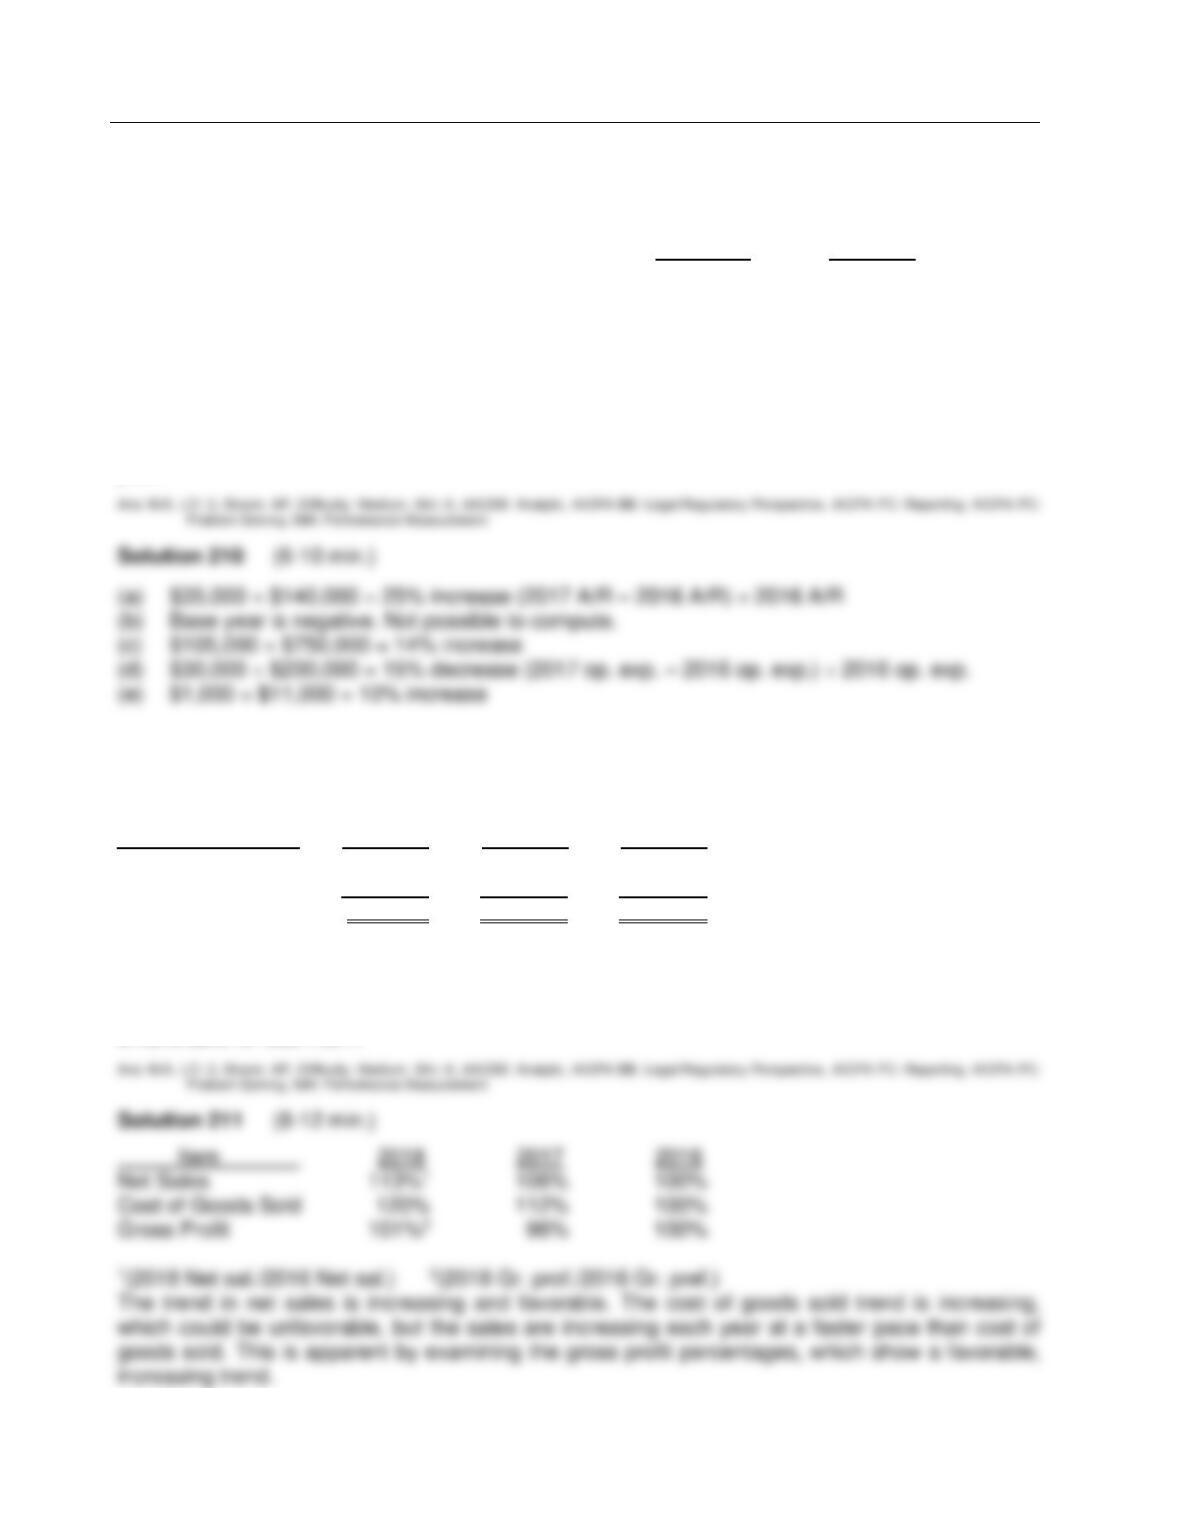
Be. 210
Comparative information taken from the Bergeron Company financial statements is shown below:
2017 2016
(a) Accounts receivable $ 175,000 $ 140,000
(b) Retained earnings 30,000 (14,000)
(c) Sales revenue 855,000 750,000
(d) Operating expenses 170,000 200,000
(e) Income taxes payable 11,000 10,000
Instructions
Using horizontal analysis, show the percentage change from 2016 to 2017 with 2016 as the base
year.
Be. 211
The following items were taken from the financial statements of Kramer Manufacturing, Inc., over
a three-year period:
Item 2018 2017 2016
Net Sales $226,000 $212,000 $200,000
Cost of Goods Sold 150,000 140,000 125,000
Gross Profit $ 76,000 $ 72,000 $ 75,000
Instructions
Using horizontal analysis and 2016 as the base year, compute the trend percentages for net
sales, cost of goods sold, and gross profit. Explain whether the trends are favorable or
unfavorable for each item.
Financial Analysis: The Big Picture
FOR INSTRUCTOR USE ONLY
13–57
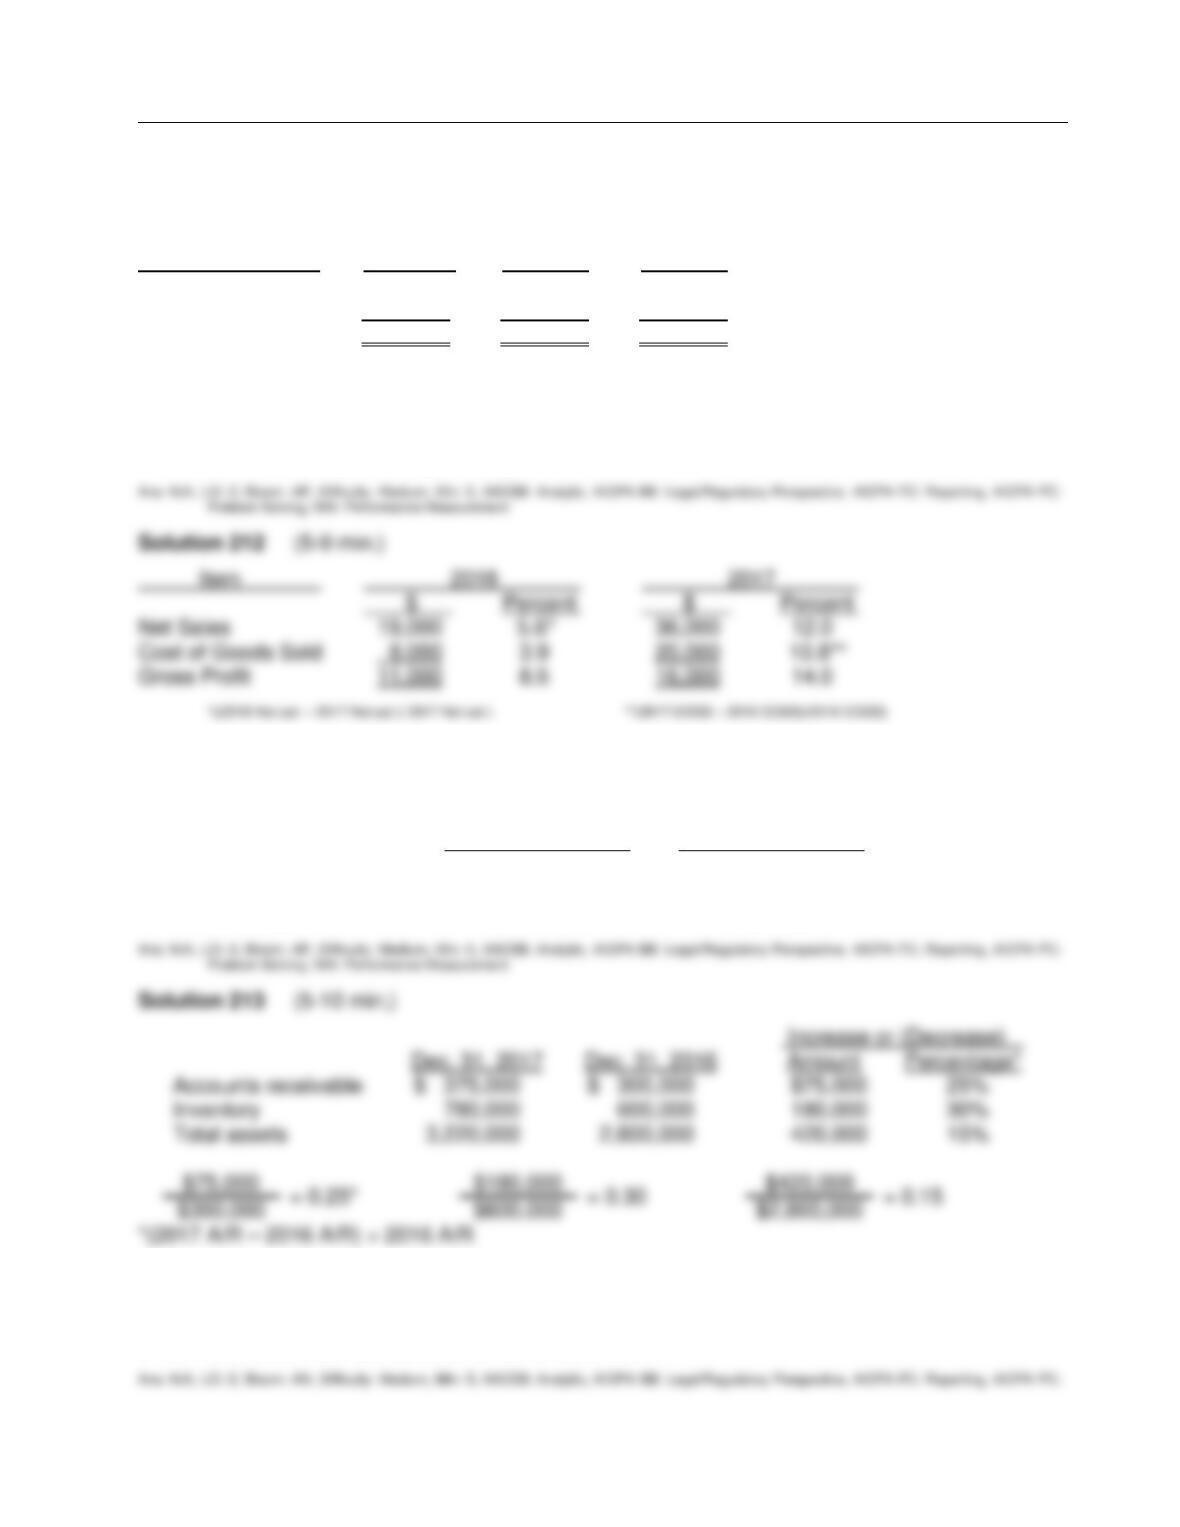
Be. 212
The following items were taken from the financial statements of Mint, Inc., over a three-year
period:
Item 2018 2017 2016
Net Sales $355,000 $336,000 $300,000
Cost of Goods Sold 214,000 206,000 186,000
Gross Profit $141,000 $130,000 $114,000
Instructions
Compute the following for each of the above time periods.
a. The amount and percentage change from 2016 to 2017.
b. The amount and percentage change from 2017 to 2018.
Be. 213
Using these data from the comparative balance sheet of Sunta Fe Spice Company, perform
horizontal analysis.
December 31, 2017 December 31, 2016
Accounts receivable $ 375,000 $ 300,000
Inventory 780,000 600,000
Total assets 3,220,000 2,800,000
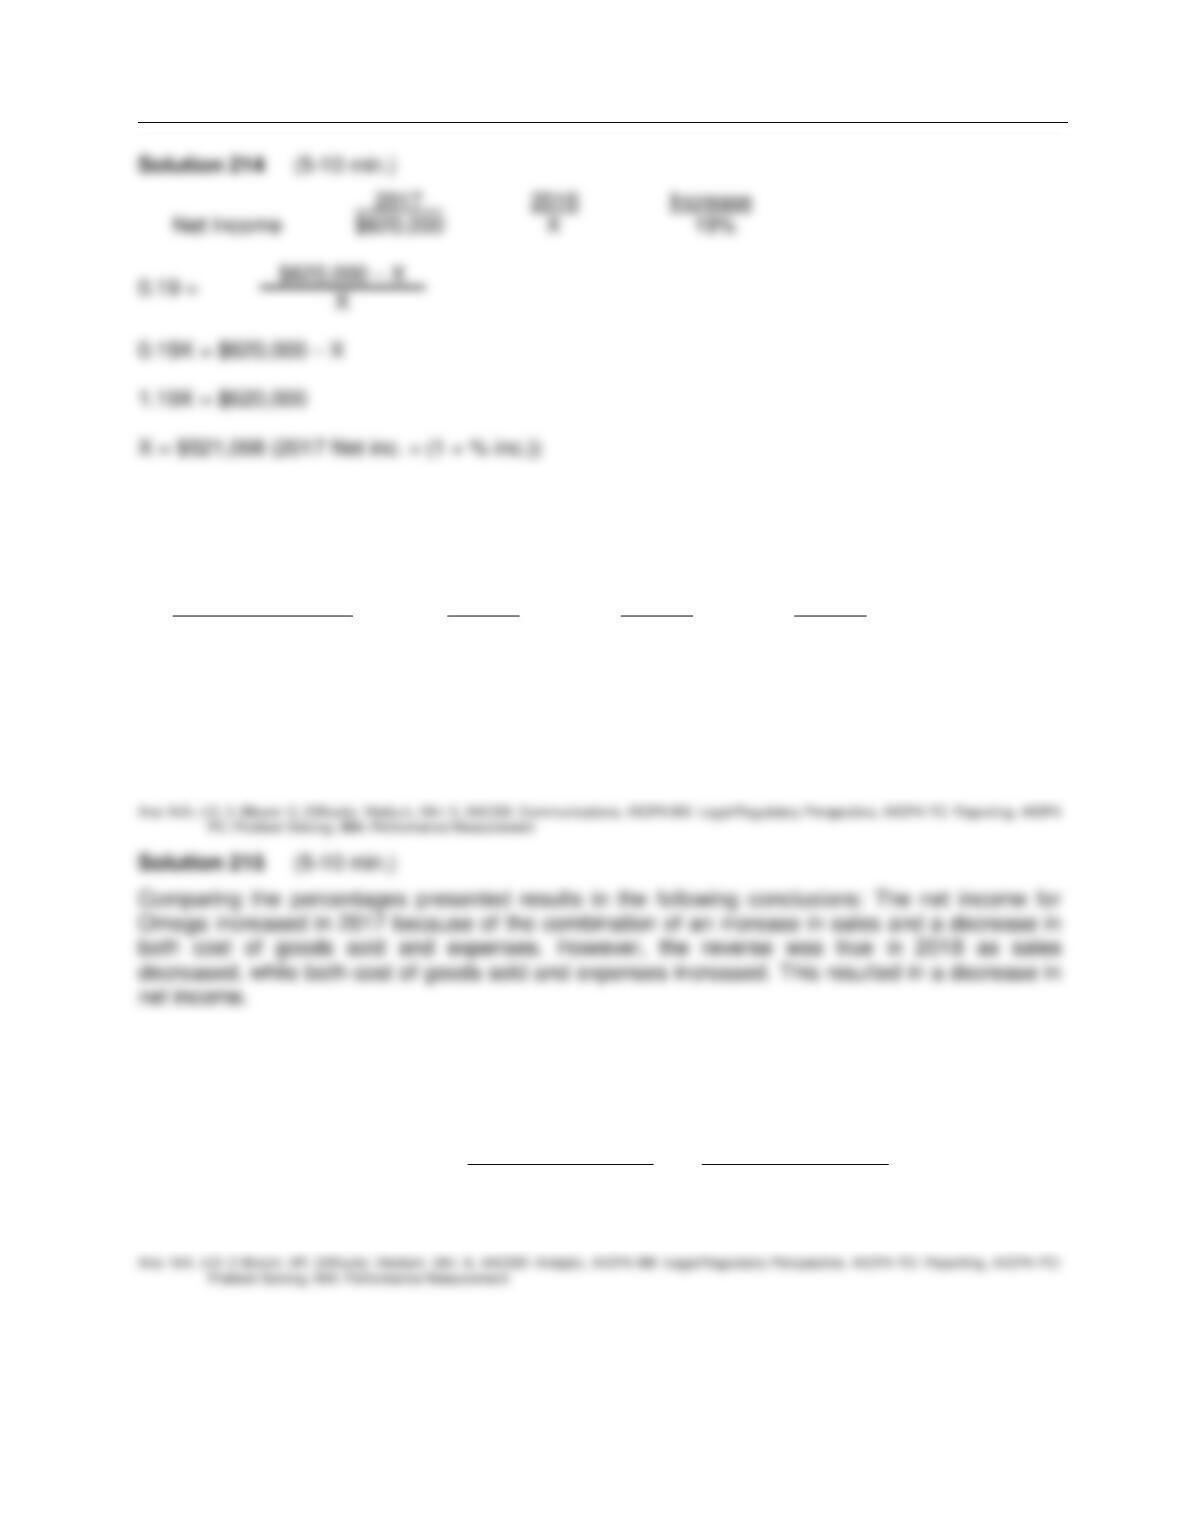
Be. 214
If Hard in Parle Company had net income of $620,000 in 2017 and it experienced a 19% increase
in net income over 2016, what was its 2016 net income?

Test Bank for Financial Accounting: Tools for Business Decision Making, Eighth Edition
FOR INSTRUCTOR USE ONLY
13–58
Financial Analysis: The Big Picture
FOR INSTRUCTOR USE ONLY
13–59
Be. 215
Horizontal analysis (trend analysis) percentages for Omega Company’s sales, cost of goods sold,
and expenses are listed here.
Horizontal Analysis 2018 2017 2016
Sales revenue 98.2% 104.8% 100.0%
Cost of goods sold 103.1 97.5 100.0
Expenses 108.6 96.4 100.0
Instructions
Explain whether Omega’s net income increased, decreased, or remained unchanged over the 3–
year period.
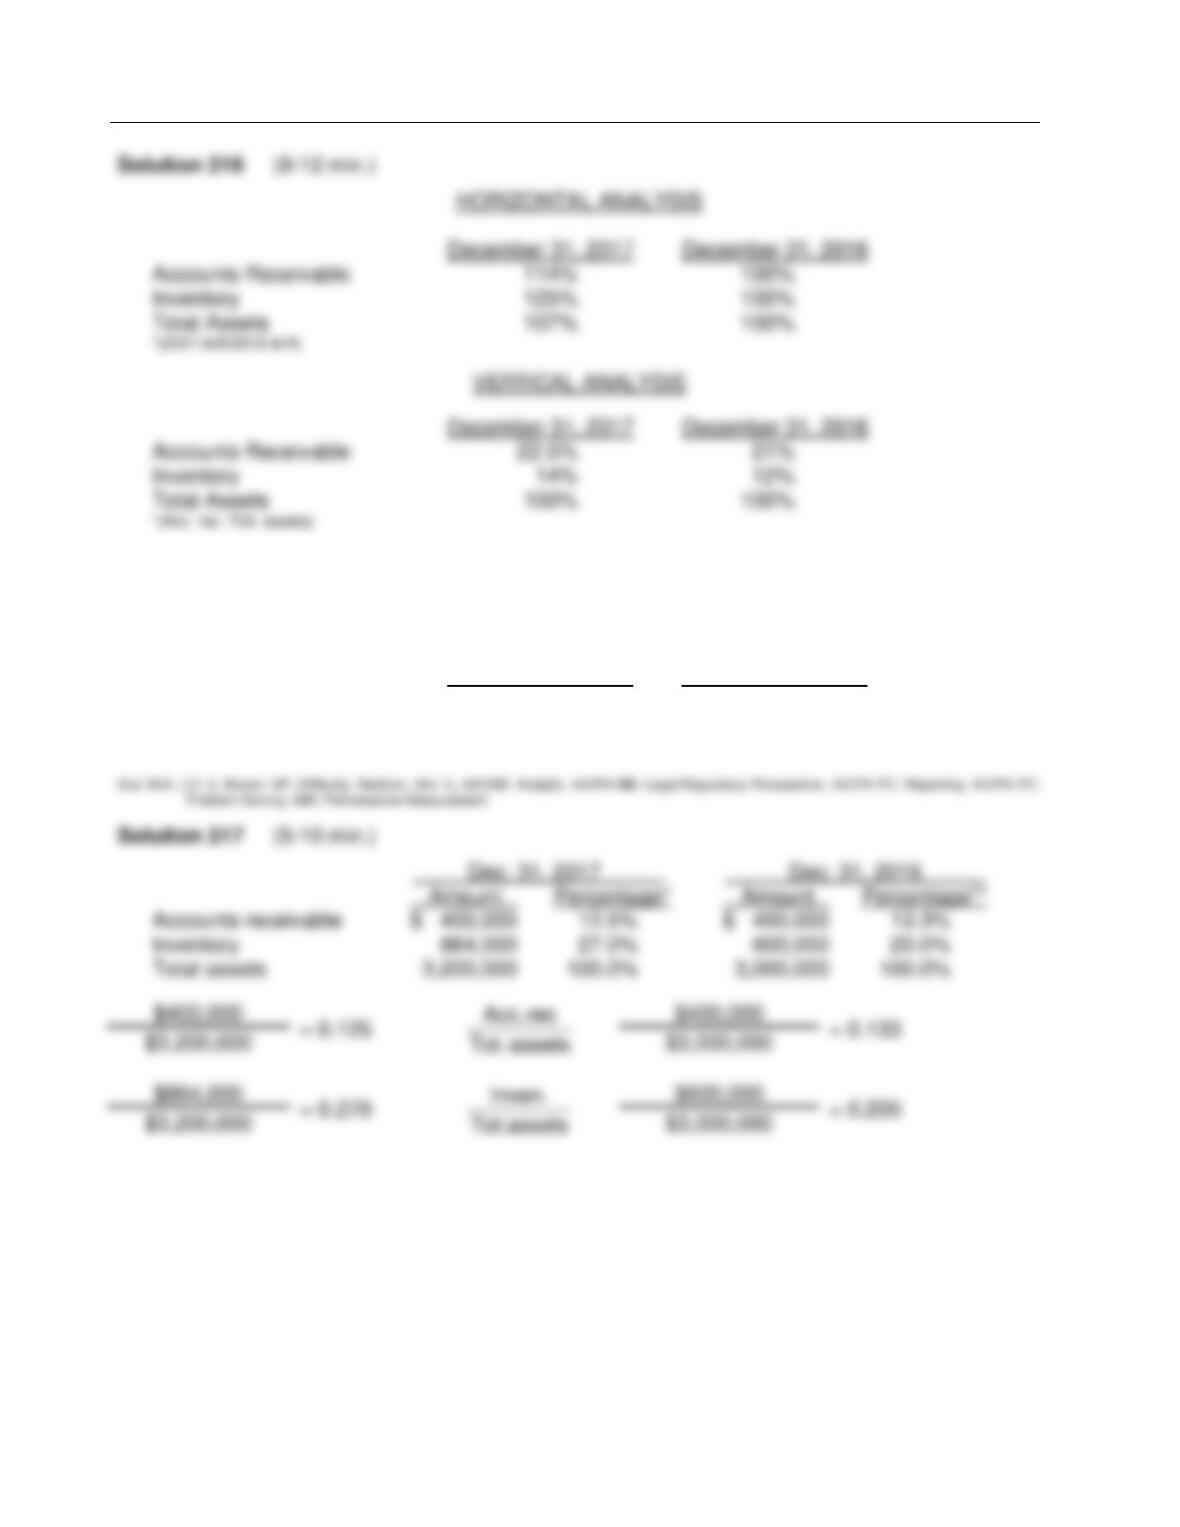
Be. 216
Using the following selected items from the comparative balance sheet of Kato Company, illustrate
horizontal and vertical analysis.
December 31, 2017 December 31, 2016
Accounts Receivable $ 720,000 $ 630,000
Inventory 450,000 360,000
Total Assets 3,200,000 3,000,000
Test Bank for Financial Accounting: Tools for Business Decision Making, Eighth Edition
FOR INSTRUCTOR USE ONLY
13–60
Be. 217
Using these data from the comparative balance sheet of K. Leen Company, perform vertical
analysis.
December 31, 2017 December 31, 2016
Accounts receivable $ 400,000 $ 400,000
Inventory 864,000 600,000
Total assets 3,200,000 3,000,000