157)
If C= 4x– 4x2+x3 is a cost function, sketch the graph of this function with the aid of
intercepts, symmetry, and the first–derivative test.
157)
158)
The cost equation for a company is C(x) =x3+ 5x2– 8x+ 250. Use the second–derivative
test, if applicable, to find the relative maxima and the relative minima.
158)
159)
Find the intervals where the graph of y=f(x) is concave up and where it is concave down.
Do not sketch its graph. Also determine its points of inflection. f(x) = 16x5– 5x.
159)
160)
Find the absolute extrema for y=x3+x2– 3x+ 7 on the interval 0, 3 and where they
occur.
160)
35
161)
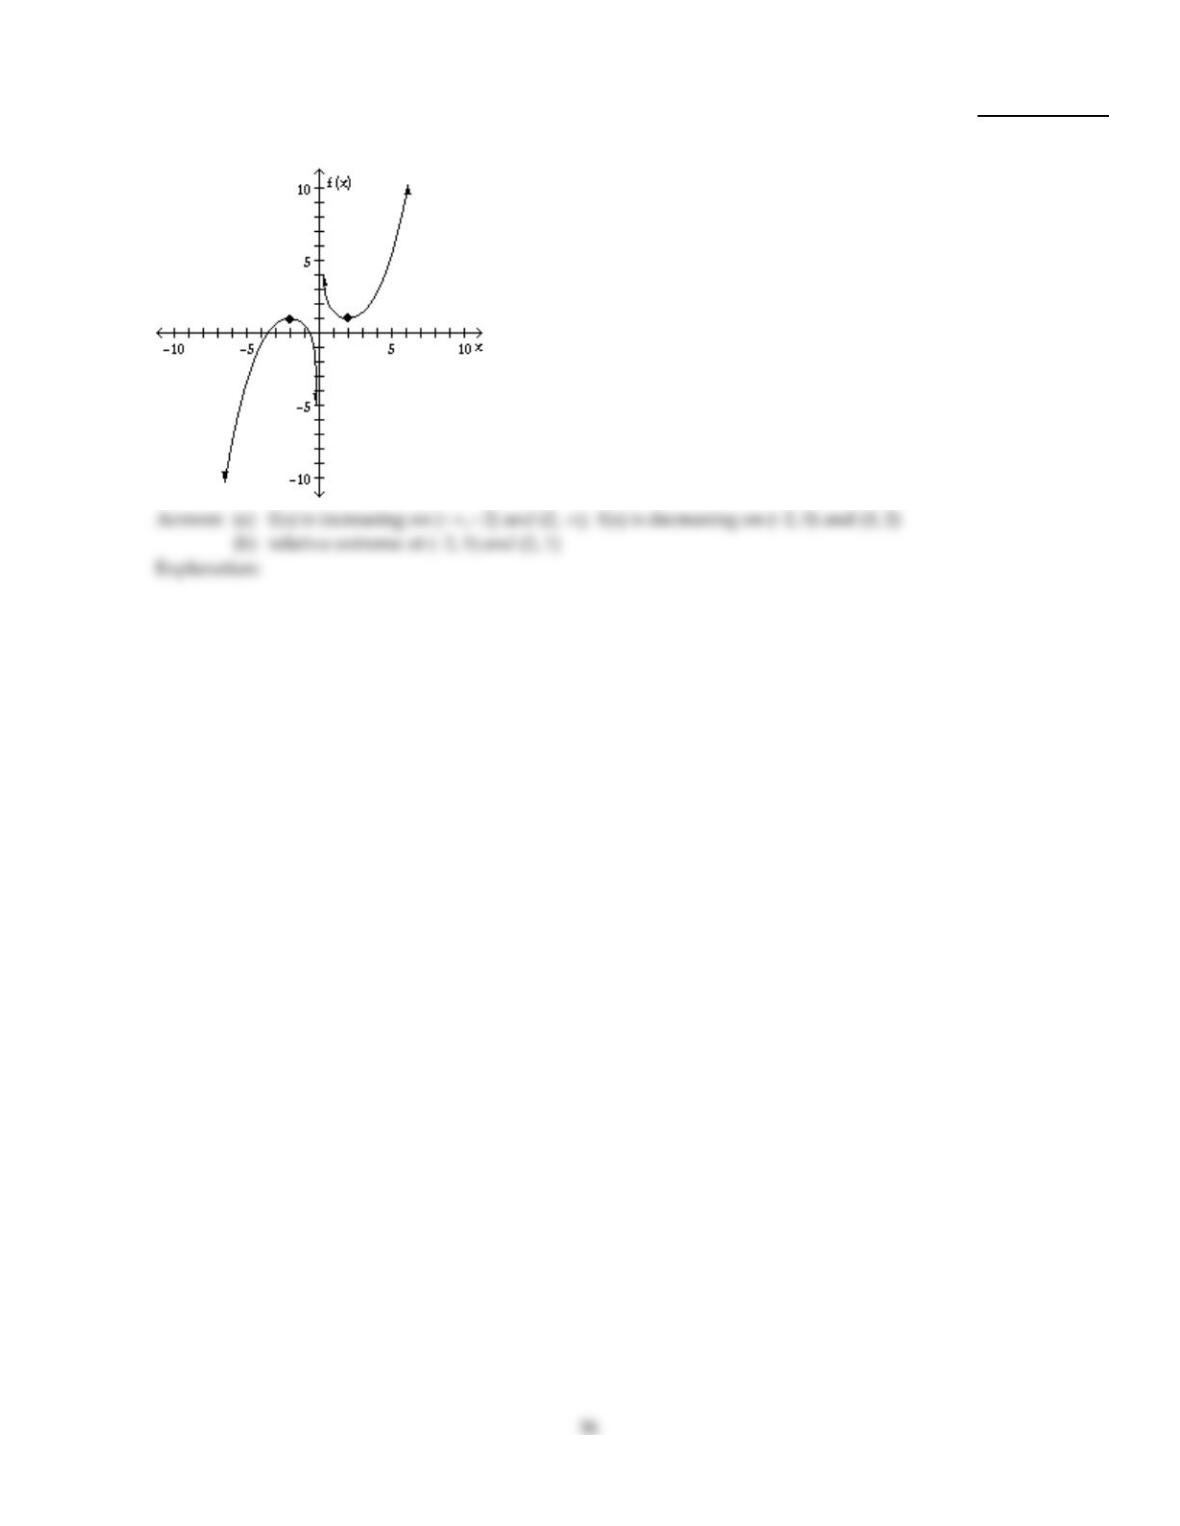
The graph of a function is given. Find
(a) the open intervals on which the function is increasing or decreasing;
(b) the coordinates of all relative extrema.
161)
Answer Key
Testname: C13
37
Answer Key
Answer Key
39
Answer Key
40
Answer Key
Testname: C13
41
Answer Key
42
Answer Key
Testname: C13
43
Answer Key
Testname: C13
44
Answer Key
Testname: C13
Answer Key
Testname: C13
46
Answer Key
Testname: C13
47