Chapter 12—Income Distribution, Poverty, and Discrimination
MULTIPLE CHOICE
1. Which of the following most closely represents the share of total U.S. income to the poorest 20 percent
of all U.S. families?
a.
47 percent.
b.
23 percent.
c.
10 percent.
d.
4 percent.
2. According to the statistics, the distribution of money income:
a.
fluctuated widely since 1947.
b.
changed significantly in favor of the bottom 5 percent.
c.
has not changed greatly since 1947.
d.
has not changed greatly since 1929.
3. “Dividing the economic pie more equally may reduce the size of the economic pie.” This argument is
characterized as:
a.
untrue.
b.
a form of discrimination.
c.
a conflict between equity and efficiency.
d.
a conflict between full employment and economic growth.
e.
b and c.
4. The highest fifth of all families receive approximately ____ of the distribution of annual money
income among families.
a.
5 percent
c.
25 percent
b.
10 percent
d.
50 percent
5. The poorest 20 percent of the U.S. population received approximately ____ of total income.
a.
5 percent
c.
15 percent
b.
10 percent
d.
20 percent
6. In the United States, approximately what percentage of the total income is earned by the highest 5
percent of the families?
a.
10 percent.
c.
30 percent.
b.
20 percent.
d.
40 percent.
7. Which of the following countries has the most unequal distribution of income?
a.
The United States.
c.
Brazil.
b.
Czech Republic.
d.
cannot be determined.
8. Since 1929, the distribution of income in the United States has become:
a.
substantially more equal.
c.
slightly more unequal.
b.
slightly more equal.
d.
substantially more unequal.
Exhibit 12-1 Income distribution for three countries
Quintile
Country I (%)
Country II (%)
Country III (%)
Poorest
6
8
4
Second
12
12
8
Third
15
15
10
Fourth
27
30
30
Richest
40
35
48
9. Exhibit 12-1 shows the percentage of income received by each population quintile. From this chart we
can conclude:
a.
Country I has the most unequal income distribution.
b.
Country III has the most equal income distribution.
c.
Country II has the most unequal income distribution.
d.
Country II has the most equal income distribution.
e.
Country III has a more equal income distribution than Country II.
10. Exhibit 12-1 shows the percentage of income received by each population quintile. In Country I we
can conclude that the:
a.
richest 20 percent of the population received 25 percent of the economy’s income.
b.
richest 20 percent of the population received 40 percent of the economy’s income.
c.
richest 20 percent of the population received 80 percent of the economy’s income.
d.
least-wealthy 20 percent of the population received 40 percent of the economy’s income.
e.
richest 40 percent of the population received 25 percent of the economy’s income.
11. Exhibit 12-1 shows the percentage of income received by each population quintile. In Country II we
can conclude that the:
a.
least-wealthy 20 percent of the population received 75 percent of the economy’s income.
b.
least-wealthy 20 percent of the population received 25 percent of the economy’s income.
c.
richest 20 percent of the population received 25 percent of the economy’s income.
d.
richest 40 percent of the population received 25 percent of the economy’s income.
e.
least-wealthy 40 percent of the population received 25 percent of the economy’s income.
12. Exhibit 12-1 shows the percentage of income received by each population quintile. In Country III, we
can conclude that the:
a.
majority of the people receive the majority of the income.
b.
richest 20 percent of the population received 75 percent of the economy’s income.
c.
richest 20 percent of the population received 78 percent of the economy’s income.
d.
richest 40 percent of the population received 78 percent of the economy’s income.
e.
least-wealthy 40 percent of the population received 78 percent of the economy’s income.
13. Which of the following statements is true?
a.
Income distribution in the United States has gotten progressively more unequal since
1929.
b.
The Lorenz curve indicates the degree of discrimination in an economy.
c.
The Lorenz curve indicates the degree of income inequality in an economy.
d.
The richest 5% of Americans earn approximately half of the nation’s income.
e.
All of these.
14. The Lorenz curve shows the:
a.
growth of income over time compared to potential growth of income.
b.
relative percentage of income going to each of the resources.
c.
demand for unskilled versus unskilled labor.
d.
actual cumulative percentage of income received compared to a perfectly equal cumulative
percentages of income.
15. One of the main tools used by economists to measure the actual distribution of income is the:
a.
Lorenz curve.
c.
MR = MC rule.
b.
Golden Rule.
d.
MRP = MRC rule.
16. Using the Lorenz curve, the degree of income inequality is measured by the:
a.
line connecting all points for which a given percentage of families receives exactly that
cumulative percentage of income.
b.
distance of the Lorenz curve from the line of perfect equality.
c.
flat diagonal line that applies to a perfectly elastic demand curve.
d.
number of times the Lorenz curve crosses the line of perfect equality.
17. A graph that shows the cumulative shares of income received by a family is a:
a.
Distribution curve.
c.
Ricardian curve.
b.
Lorenz curve.
d.
Quintlile curve.
18. The Lorenz curve measures the:
a.
distribution of income.
b.
effectiveness of government transfer payments.
c.
extent to which family incomes are affected by welfare.
d.
all of these.
19. A graph that shows the percentage of the families on one axis and the percentage of income on the
other is called the:
a.
Budget-distribution curve.
c.
Lorenz curve.
b.
Income-consumption curve.
d.
Marx curve.
20. Between 1929 and 2005 in the United States, the Lorenz curve became:
a.
less bowed outward.
c.
a straight line.
b.
more bowed outward.
d.
a downward-sloping curve.
21. Between 1929 and 2005 in the United States, as measured by the Lorenz curve, income inequality:
a.
was greater.
c.
was less.
b.
remain unchanged.
d.
increased sharply.
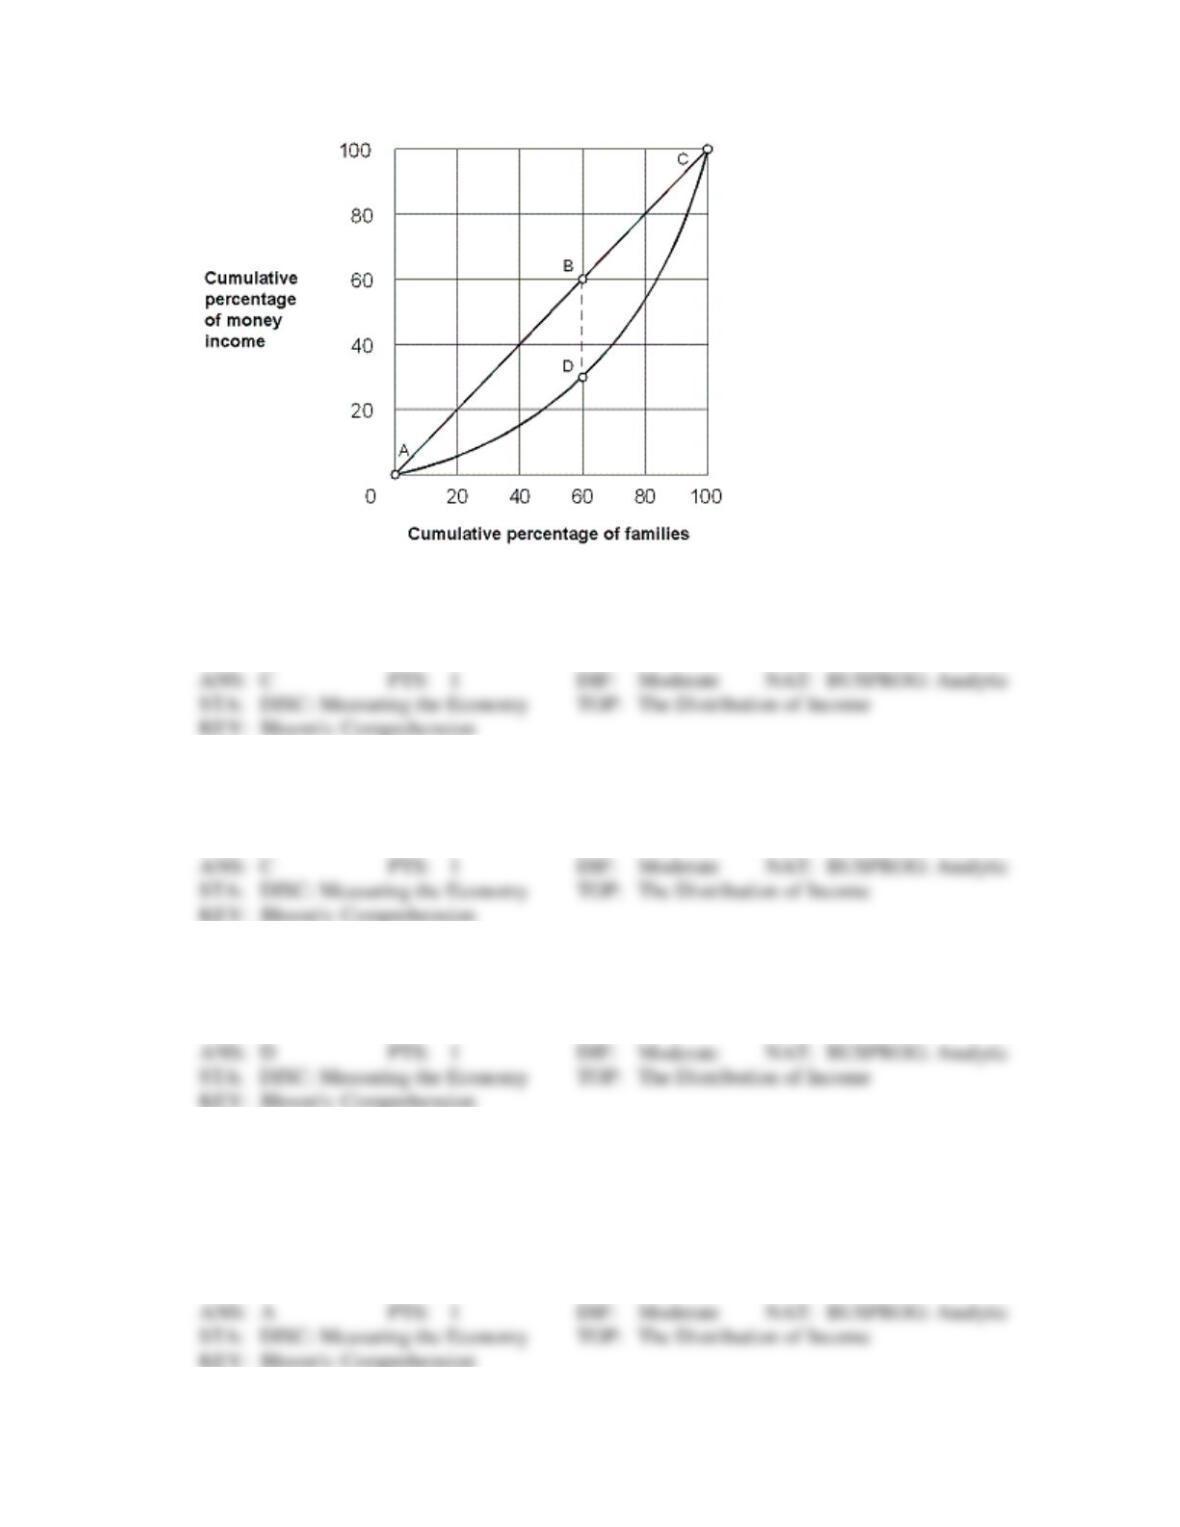
Exhibit 12-2 Lorenz curve
22. As shown in Exhibit 12-2, the perfect equality line is drawn between points:
a.
A and B.
c.
A and C along the straight line.
b.
B and D.
d.
A and C along the curve.
23. As shown in Exhibit 12-2, 60 percent of families earned a cumulative share of about ____ of income.
a.
5 percent
c.
30 percent
b.
15 percent
d.
50 percent
24. As shown in Exhibit 12-2, 80 percent of families earned a cumulative share of about ____ of income.
a.
5 percent
c.
30 percent
b.
15 percent
d.
50 percent
25. As shown in Exhibit 12-2, the distance between points B and D means that 60 percent of families earn
____ less of total income than required for perfect equality.
a.
30 percent
b.
60 percent
c.
90 percent
d.
insufficient information to answer question.
26. As shown in Exhibit 12-2, the degree of unequal income distribution is measured by the area between
the:
a.
Lorenz curve and the horizontal axis.
b.
Lorenz curve and the vertical axis.
c.
Perfect equality line and the origin.
d.
Perfect equality line and the Lorenz curve.
27. After 1929 in the United States, as measured by the Lorenz curve, income inequality:
a.
increased sharply.
c.
declined.
b.
remain unchanged.
d.
increased.
28. In a Lorenz curve diagram, the 45 line represents:
a.
perfect income equality.
b.
zero inflation.
c.
a negative income tax.
d.
an extremely unequal distribution of income.
29. A Lorenz curve shows the:
a.
number of people in an economy living below the poverty line.
b.
percentage of children in an economy who are not receiving adequate nutrition.
c.
percentage of the economy’s population benefiting from government spending programs.
d.
percentage of an economy’s total income each part of the population receives.
e.
percentage of the population whose income is dependent on sales to foreign countries.
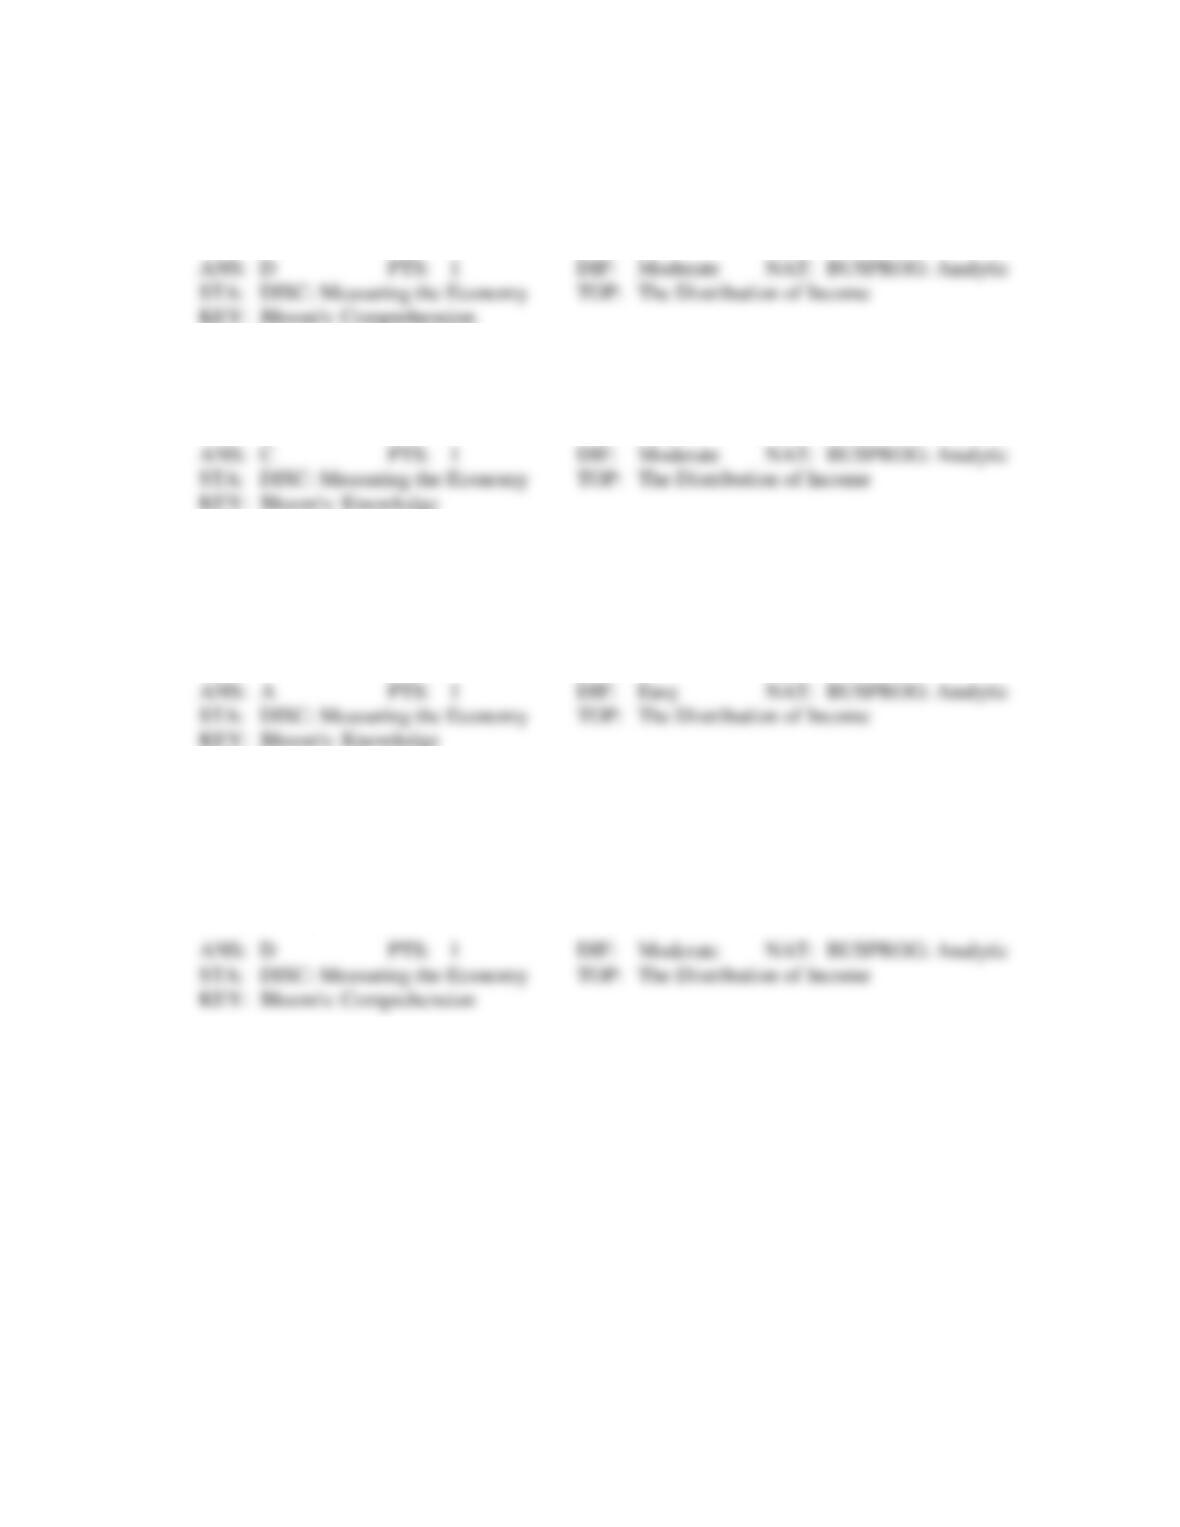
Exhibit 12-3 Lorenz curve for an economy
30. According to the Lorenz curve shown in Exhibit 12-3, what percentage of total income is earned by
the richest 20 percent of families?
a.
20 percent.
c.
60 percent.
b.
40 percent.
d.
80 percent.
31. If this economy’s distribution of income becomes more equal, then the Lorenz curve shown in Exhibit
12-3 will:
a.
move closer to the 45 line.
c.
lie above the 45 line.
b.
become more bowed outward.
d.
shift down and to the right.
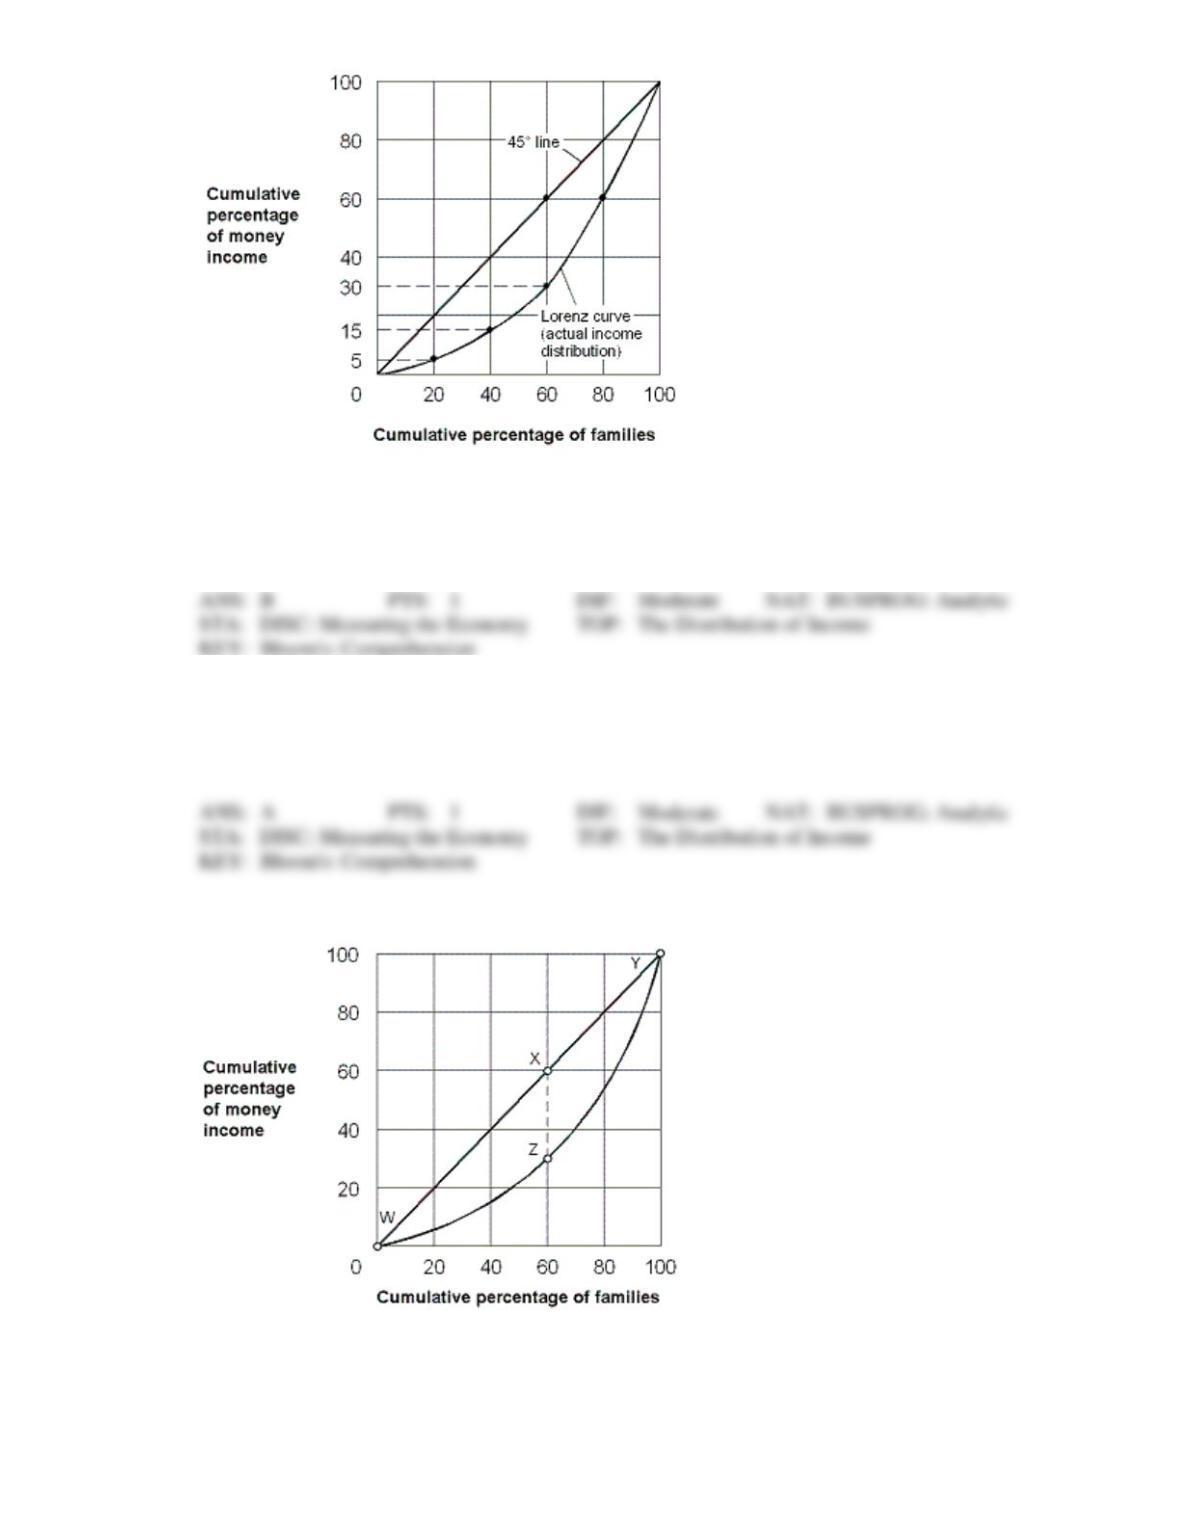
Exhibit 12-4 Lorenz curve
32. As shown in Exhibit 12-4, the perfect equality line is drawn between points:
a.
W and Y along the curve.
c.
W and Y along the straight line.
b.
X and Z.
d.
W and X.
33. As shown in Exhibit 12-4, 20 percent of families earned a cumulative share of about ____ percent of
income.
a.
5
c.
30
b.
10
d.
50
34. As shown in Exhibit 12-4, 40 percent of families earned a cumulative share of about ____ percent of
income.
a.
5
c.
30
b.
15
d.
50
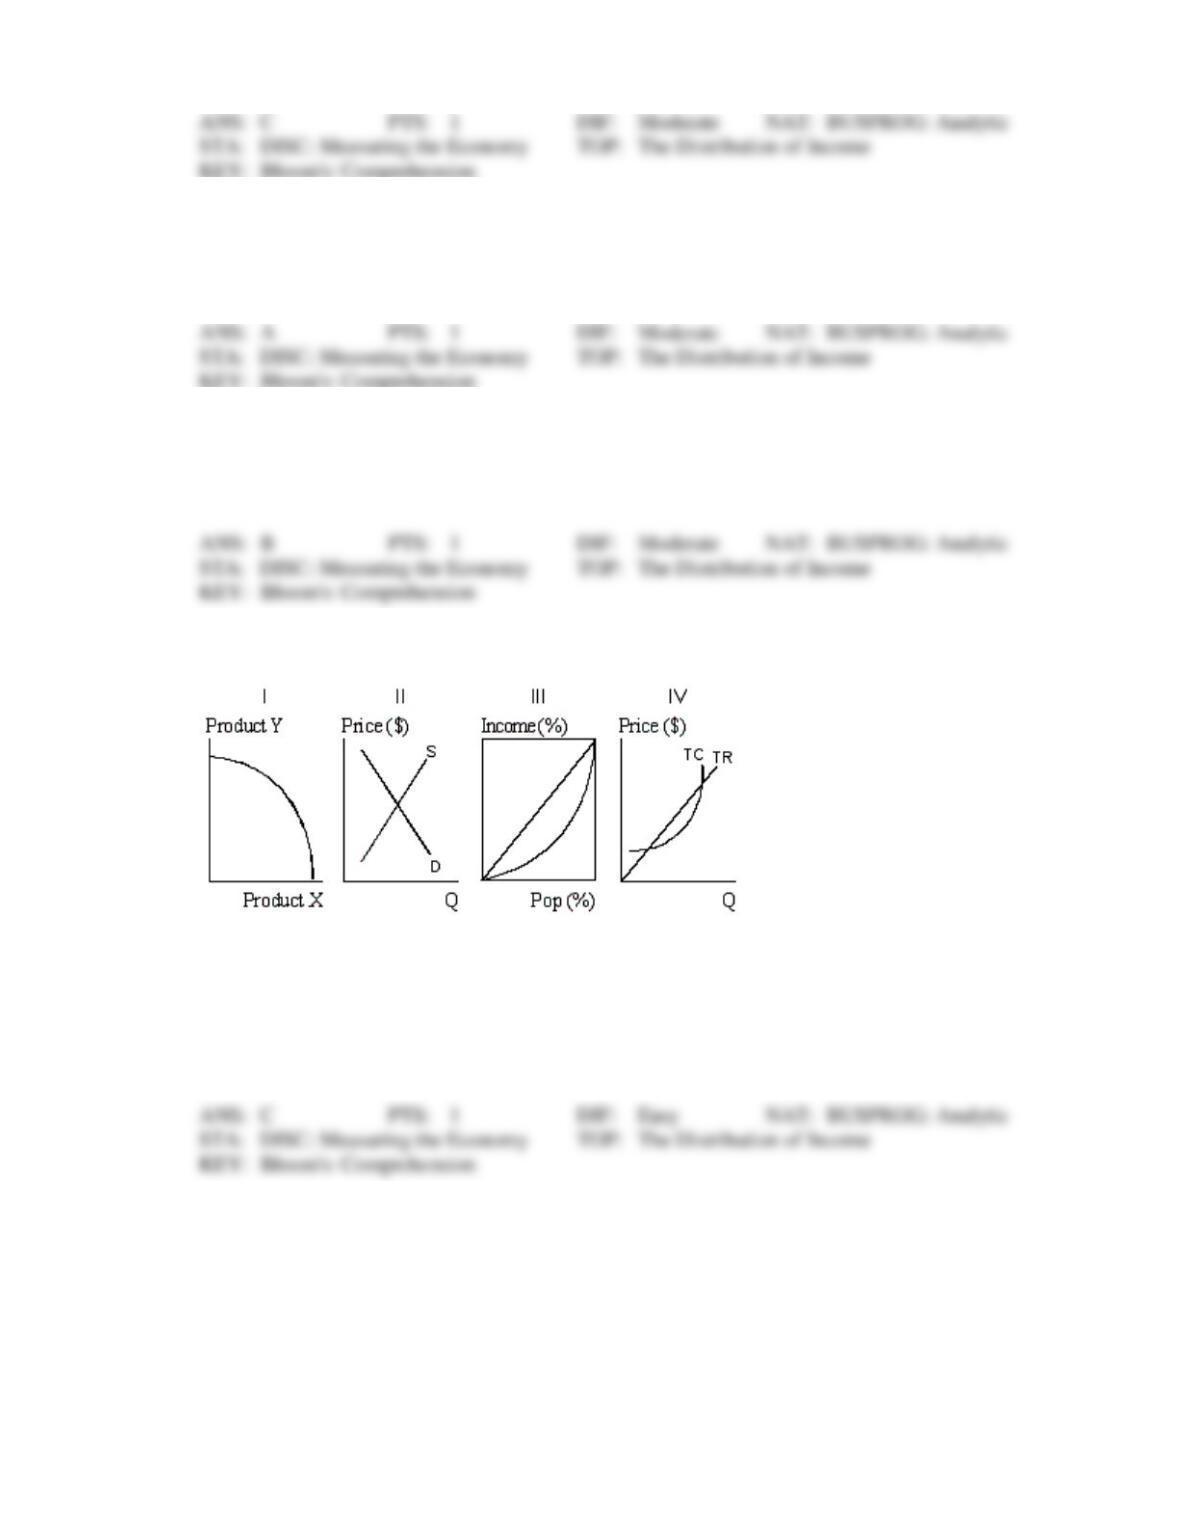
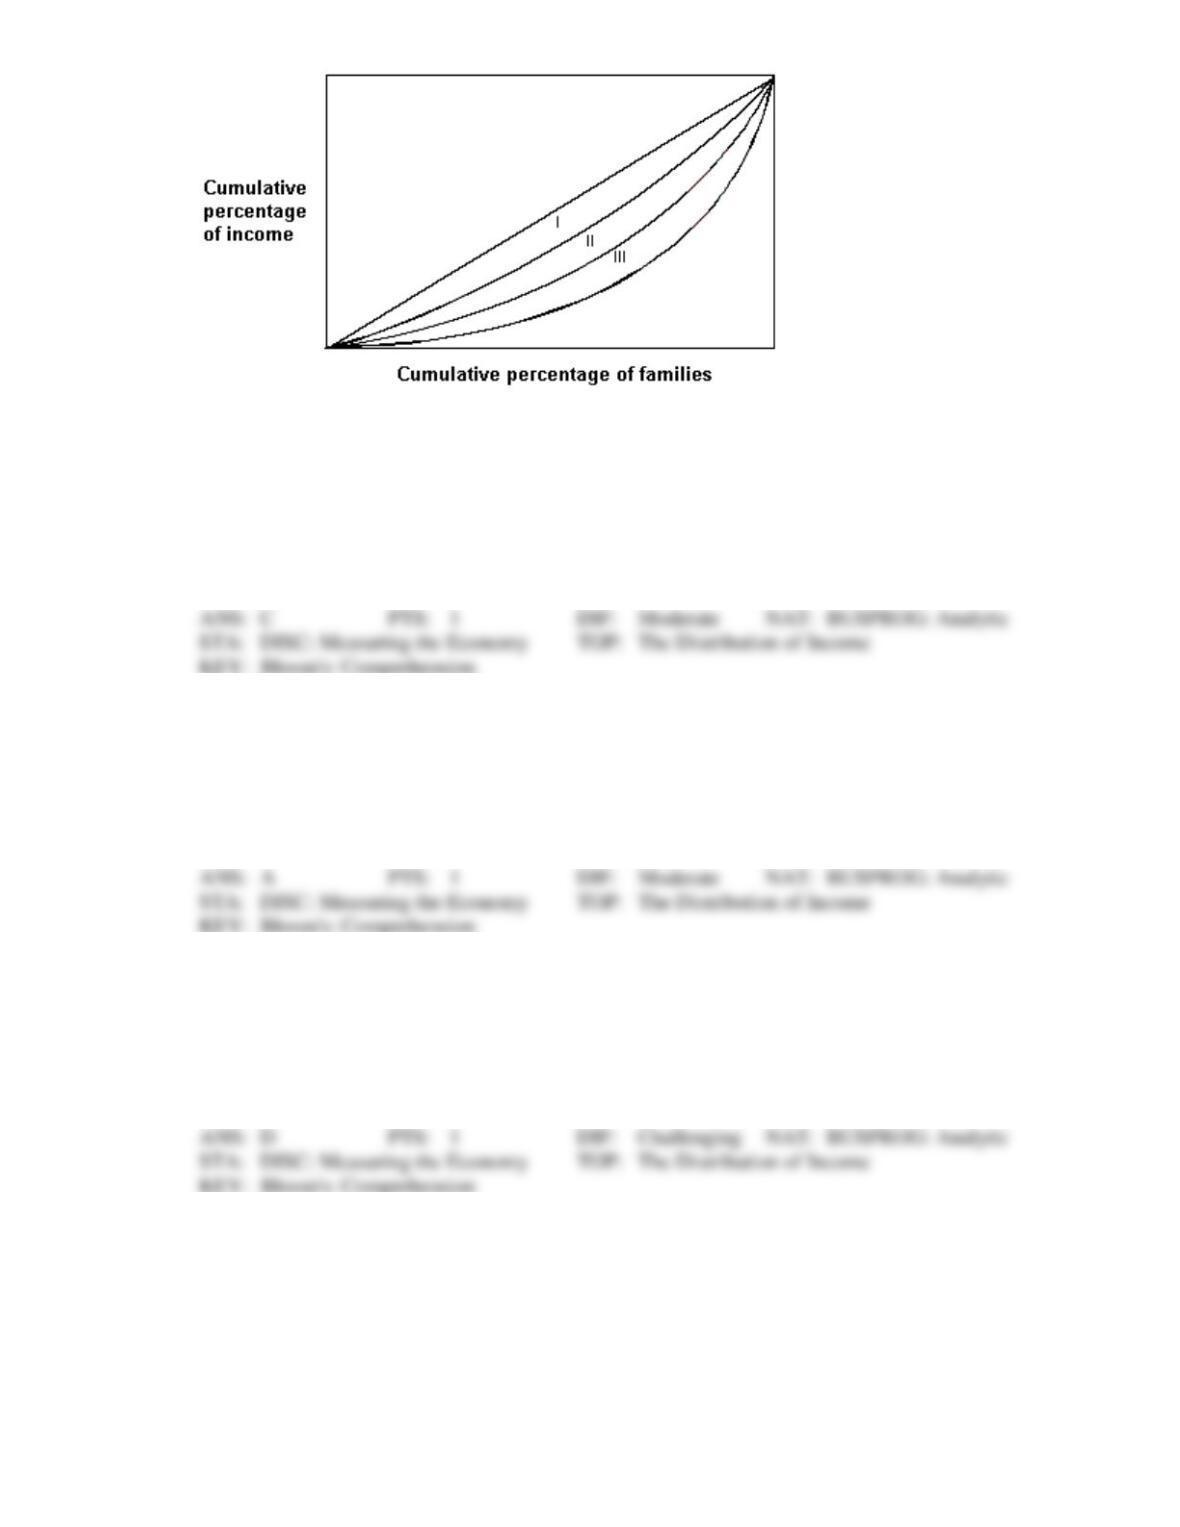
Exhibit 12-5 Economic curves
35. In Exhibit 12-5, a Lorenz curve is shown in diagram:
a.
I.
b.
II.
c.
III.
d.
IV.
e.
both I and II.
Exhibit 12-6 Lorenz curves
36. Exhibit 12-6 shows the Lorenz Curve for three countries, I, II, and III. Which of the following
statements is true?
a.
Country I has the most unequal income distribution.
b.
Country II has the most unequal income distribution.
c.
Country I has the most equal income distribution.
d.
Country III has the most equal income distribution.
e.
Country II has a more equal income distribution than Country I.
37. Exhibit 12-6 shows the Lorenz Curve for three countries, I, II, and III. Of the three countries shown,
a.
Country III has the most unequal income distribution.
b.
Country II has the most unequal income distribution.
c.
Country I has the most unequal income distribution.
d.
Country III has the most equal income distribution.
e.
Country II has a more equal income distribution than Country I.
38. Economists look at which of the following to get a quick visual expression of income distribution?
a.
Gini coefficient.
b.
IRS records of how much income each household earned.
c.
supply and demand curves for resources.
d.
Lorenz curve.
e.
surveys of business estimates for MRPs.
39. Typically, a country’s population is divided into how many income groups to find a Lorenz Curve?
a.
1 or 2.
b.
5 or 10.
c.
10 or 20.
d.
25 or 50.
e.
100.
40. For the calculation of a Lorenz curve using quintiles, the:
a.
first quintile contains the richest 50 percent of population.
b.
first quintile contains the richest 20 percent of population.
c.
first quintile contains the poorest 50 percent of population.
d.
first quintile contains the poorest 20 percent of population.
e.
last quintile contains the poorest 10 percent of population.
41. When the Lorenz curve moves closer to the diagonal, this shows:
a.
the rich getting richer and the poor getting poorer.
b.
total income is rising.
c.
the distribution of income is becoming more even.
d.
the population is decreasing.
e.
the prices of goods are rising.
42. In an economy where the poorest quintile of the population receives 5 percent of the income, the
Lorenz curve:
a.
is the diagonal of the box.
b.
lies below the diagonal in the box.
c.
lies above the diagonal in the box.
d.
is the lower right corner of the box.
e.
is the upper left corner of the box.
43. If 80 percent of the population receives 75 percent of the income,
a.
the richest quintile receives 20 percent of the income.
b.
the Lorenz curve is the diagonal.
c.
income is not perfectly evenly distributed.
d.
the poorest quintile receives more than 20 percent of income.
e.
people in the middle quintile have the highest incomes.
44. When the Lorenz curve lies above the diagonal,
a.
the poorest 20 percent of the population receive more than 20 percent of income.
b.
the richest 20 percent of the population receive more than 20 percent of income.
c.
everyone receives the same income.
d.
the country’s income has been rising over time.
e.
it is wrong since it is impossible for the graph to look like this.
45. Of the following demographic groups, which has the lowest poverty rate in the U.S.?
a.
Families headed by a female with no adult male present.
b.
Families in which the “head of the household” has not attained a high-school education.
c.
Families headed by a male with no adult female present.
d.
Families in which the “head of the household” has attained at least a bachelor’s degree
from a college or university.
46. Which of the following are not counted when we compare a family’s income to the poverty line?
a.
In-kind transfers such as food stamps, Medicaid, and public housing.
b.
Cash welfare payments such as from social security.
c.
Cash payments when a worker becomes unemployed.
d.
Both a. and b. above are correct.
47. The social security tax is called FICA, which stands for:
a.
Federal Investment Corporation of America.
b.
Federal Income Contributions to Americans.
c.
Funding from Individuals and Corporations in America.
d.
Federal Insurance Contributions Act.
48. The poverty income level equals the:
a.
average income of the bottom one-tenth of all income recipients.
b.
cost of an economical and nutritional food plan for a family multiplied by six.
c.
cost of an economical and nutritional food plan for a family multiplied by three.
d.
average income of a family headed by a worker who has been unemployed for six months
or more.
49. The level of money income below which a family is considered poor is called the:
a.
bottom 20 percent of the income distribution.
b.
poverty income level.
c.
guaranteed income level.
d.
subsistence income level.
50. Which of the following is not counted as income when the official poverty rate is calculated?
a.
Medicaid benefits.
b.
dividends derived from the ownership of stock.
c.
earnings derived from a part-time job.
d.
money income derived from transfer payments.
51. If official U.S. poverty statistics included in-kind transfer payments the:
a.
poverty rate would be close to zero.
b.
poverty rate would be lower.
c.
government deficit would be lower.
d.
top 10 percent of those in the income distribution would be wealthier.
52. Which of the following is an in-kind transfer payment?
a.
Medicaid.
b.
Social Security.
c.
unemployment insurance.
d.
Temporary Assistance to Needy Families.
53. Food stamps and Medicaid are examples of:
a.
money transfers
c.
in-kind transfers
b.
resource earnings
d.
tax expenditures
54. The largest in-kind transfer program is:
a.
Transitory Assistance to Needy Families.
b.
Medicaid.
c.
Social Security.
d.
Food stamps.
55. The official poverty line is defined as:
a.
one-half the average family income.
b.
one-third the average family income.
c.
three times the cost of a minimal food requirement.
d.
two times the cost of a minimal food requirement.
56. The official poverty rate for all persons declined sharply between 1959 and:
a.
2000.
c.
1980.
b.
1970.
d.
1990.
57. Which of the following is not included in census income?
a.
wages and salaries.
c.
cash welfare benefits.
b.
property income.
d.
in-kind transfers.
58. Which of the following is not an in-kind subsidy?
a.
Food stamps.
b.
Low-cost rental housing.
c.
Medicare.
d.
Medicaid.
e.
Unemployment compensation.
59. Statistics on families below the poverty line may be overstated because:
a.
the poor are primarily children who soon will move out of poverty.
b.
poverty in the United States is rich compared to poverty in other nations.
c.
the income levels used to measure poverty do not include in-kind transfers.
d.
unemployment compensation is a program closed to the poor.
60. Which of the following statements is correct?
a.
About 25 percent of the U.S. population earns an income below the poverty line.
b.
About 50 percent of blacks earn an income below the poverty line.
c.
Since 1980 the fraction of persons below the poverty level has risen sharply.
d.
None of these.
61. The Social Security Act was passed:
a.
in 1955.
c.
in 1935.
b.
just after World War II.
d.
in 1964.
62. The poverty line:
a.
separates those on welfare from those not on welfare.
b.
equals three times an economy food budget.
c.
equals the median income level.
d.
all of these.
63. The official U.S. poverty line for a family is calculated by taking 3 times the annual cost of:
a.
public housing.
c.
utilities and transportation.
b.
basic medical care.
d.
a minimal diet.