
148. Rhodes Bakery
The balance sheet taken from the company’s 2015 10-K is provided below:
December 31
Assets:
2015
2014
Current Assets:
Cash
$ 61,100
$54,000
Accounts Receivable
22,500
17,500
Inventory
8,500
7,000
Other Current Assets
6,500
5,500
Total Current Assets
98,600
84,000
Long-term Assets:
Property, Plant & Equipment, net
744,900
25,000
Intangible Assets
211,250
225,000
Total Assets
$1,054,750
$334,000
Liabilities and Stockholders’ Equity
Current Liabilities:
Accounts Payable
$ 5,500
$ 4,500
Interest Payable
500
500
Current Portion of Long-Term Debt
15,000
0
Income Tax Payable
18,500
23,000
Total Current Liabilities
$ 39,500
28,000
Long-term Liabilities:
Notes Payable
246,250
15,000
Total Liabilities
285,750
43,000
Stockholders’ Equity
Common Stock
60,000
35,000
Additional Paid-in Capital
654,000
186,000
Retained Earnings
92,500
70,000
Treasury Stock
(37,500)
0
Total Stockholders’ Equity
769,000
291,000
Total Liabilities and Stockholders’ Equity
$1,054,750
$334,000
Refer to Rhodes Bakery. Calculate the following debt management ratios for 2015 and 2014: Times Interest Earned Ratio, Long-Term Debt-to–
Equity Ratio, Debt-to-Equity Ratio, Long-Term Debt-to-Assets Ratio, and Debt-to-Assets Ratio. Income from operations were $65,000 and $49,000
and interest expense was $26,000 and $1,750 for 2015 and 2014, respectively. Round your answers to two decimal places. Comment on the
company’s debt management.
2015:
Times Interest Earned Ratio:
$65,000 income from operations / 26,000 interest expense = 2.50
Long-Term Debt-to-Equity Ratio:
($246,250 long-term debt + $15,000 current portion) / $769,000 total equity = 0.34
$285,750 total liabilities / $769,000 total equity = 0.37
Long-Term Debt-to-Assets Ratio:
($246,250 long-term debt + $15,000 current portion) / $1,054,750 total assets = 0.25
$285,750 total liabilities / $1,054,750 total assets = 0.27
2014:
Times Interest Earned Ratio:
$49,000 income from operations / $1,750 interest expense = 28.00
Long-Term Debt-to-Equity Ratio:
($15,000 long-term debt + $0 current portion) / $291,000 total equity = 0.05
$43,000 total liabilities / $291,000 total equity = 0.15
Long-Term Debt-to-Assets Ratio:
($15,000 long-term debt + $0 current portion) / $334,000 total assets = 0.05
$43,000 total liabilities / $334,000 total assets = 0.13
149. Rhodes Bakery
The balance sheet taken from the company’s 2015 10-K is provided below:
December 31
Assets:
2015
2014
Current Assets:
Cash
$ 61,100
$54,000
Accounts Receivable
22,500
17,500
Inventory
8,500
7,000
Other Current Assets
6,500
5,500
Total Current Assets
98,600
84,000
Long-term Assets:
Property, Plant & Equipment, net
744,900
25,000
Intangible Assets
211,250
225,000
Total Assets
$1,054,750
$334,000
Liabilities and Stockholders’ Equity
Current Liabilities:
Accounts Payable
$ 5,500
$ 4,500
Interest Payable
500
500
Current Portion of Long-Term Debt
15,000
0
Income Tax Payable
18,500
23,000
Total Current Liabilities
$ 39,500
28,000
Long-term Liabilities:
Notes Payable
246,250
15,000
Total Liabilities
285,750
43,000
Stockholders’ Equity
Common Stock
60,000
35,000
Additional Paid-in Capital
654,000
186,000
Retained Earnings
92,500
70,000
Treasury Stock
(37,500)
0
Total Stockholders’ Equity
769,000
291,000
Total Liabilities and Stockholders’ Equity
$1,054,750
$334,000
Refer to Rhodes Bakery. Calculate the following asset efficiency ratios for 2015 and 2014: Accounts Receivable Turnover Ratio, Inventory
Turnover Ratio, and Asset Turnover Ratio. Also determine the Operating Cycle. Round your answers to two decimal places. Comment on the
company’s asset efficiency ratios.
A portion of the company’s income statements are shown below. At December 31, 2013, Accounts Receivable, Inventories, and Total Assets were
$18,500, $6,500, and $325,000, respectively.
2015
2014
Net Sales
$475,000
$387,500
Cost of Goods Sold
240,000
200,000
Gross Profit
$235,000
$187,500
150. Rhodes Bakery
The balance sheet taken from the company’s 2015 10-K is provided below:
December 31
Assets:
2015
2014
Current Assets:
Cash
$ 61,100
$54,000
Accounts Receivable
22,500
17,500
Inventory
8,500
7,000
Other Current Assets
6,500
5,500
Total Current Assets
98,600
84,000
Long-term Assets:
Property, Plant & Equipment, net
744,900
25,000
Intangible Assets
211,250
225,000
Total Assets
$1,054,750
$334,000
Liabilities and Stockholders’ Equity
Current Liabilities:
Accounts Payable
$ 5,500
$ 4,500
Interest Payable
500
500
Current Portion of Long-Term Debt
15,000
0
Income Tax Payable
18,500
23,000
Total Current Liabilities
$ 39,500
28,000
Long-term Liabilities:
Notes Payable
246,250
15,000
Total Liabilities
285,750
43,000
Stockholders’ Equity
Common Stock
60,000
35,000
Additional Paid-in Capital
654,000
186,000
Retained Earnings
92,500
70,000
Treasury Stock
(37,500)
0
Total Stockholders’ Equity
769,000
291,000
Total Liabilities and Stockholders’ Equity
$1,054,750
$334,000
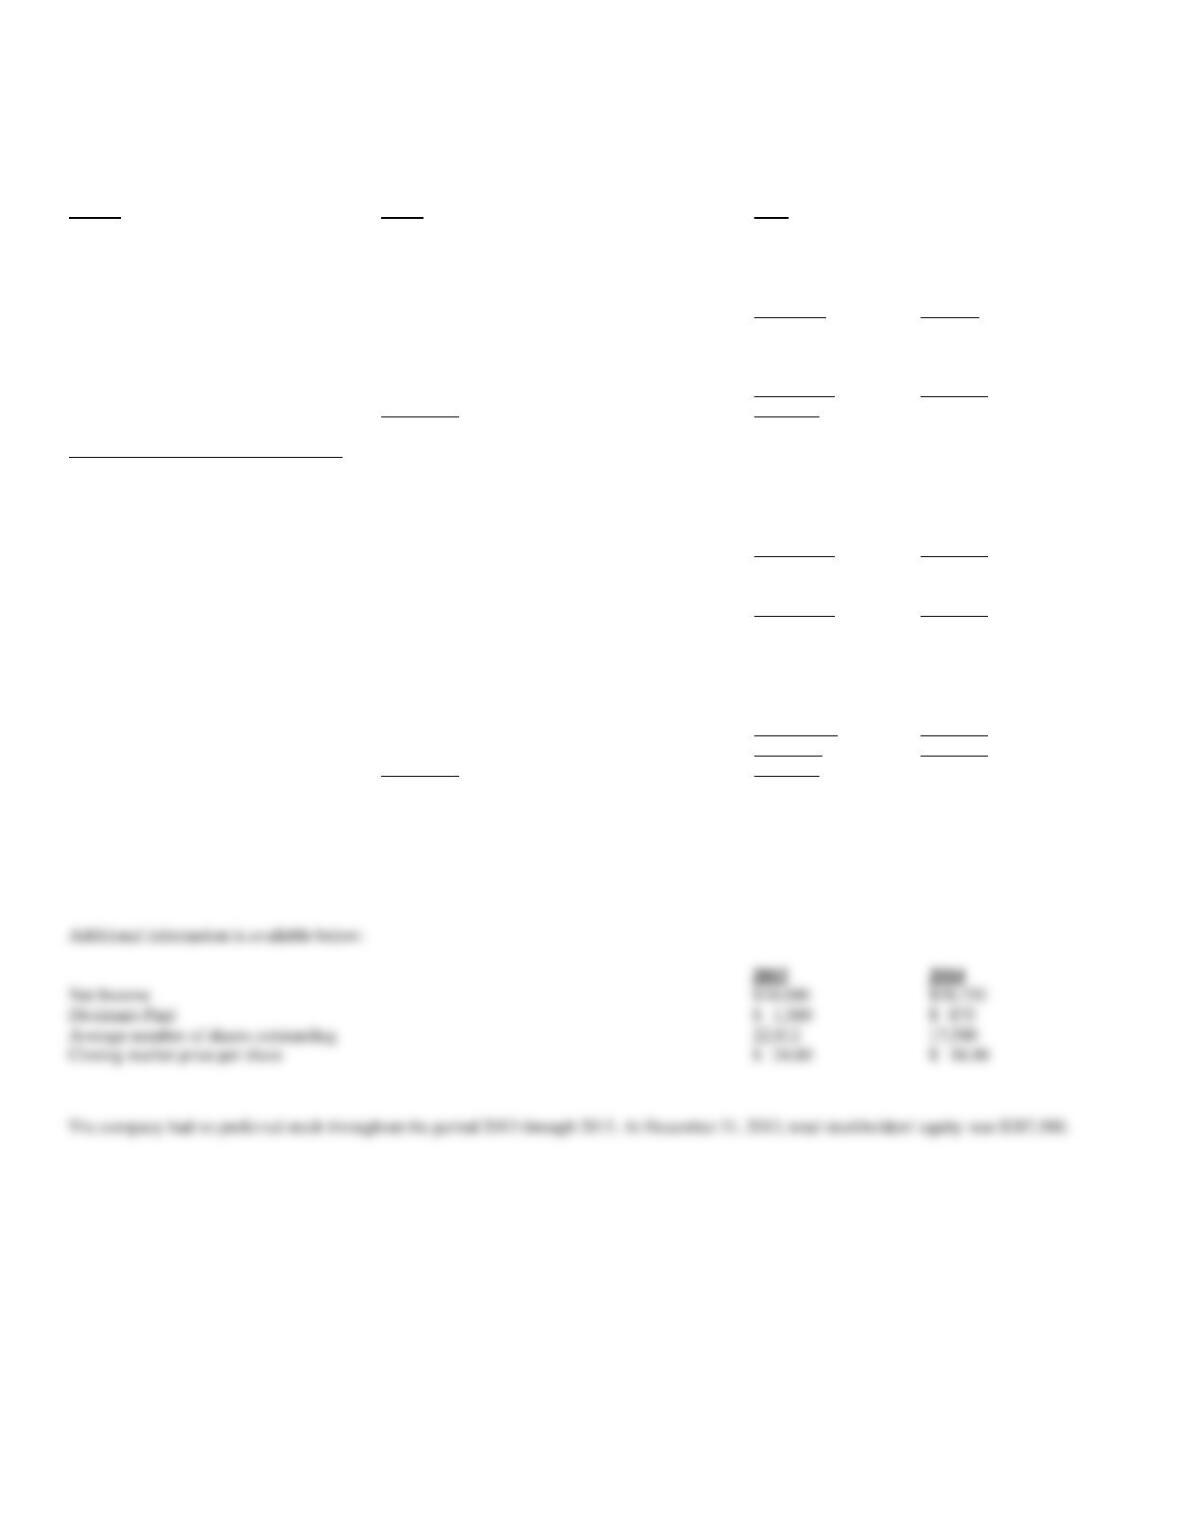
Refer to Rhodes Bakery. Calculate the following profitability ratios for 2015 and 2014: Gross Profit Percentage, Operating Margin Percentage, Net
Profit Margin Percentage, Return on Assets, and Return on Equity. Express each ratio as a percentage and round your answers to two decimal places,
then comment on the company’s performance in terms of profitability.
The company’s income statements are available below. At December 31, 2013, total assets and total stockholders’ equity were $325,000 and
$287,500, respectively.
2015
2014
Net Sales
$475,000
$387,500
Cost of Goods Sold
240,000
200,000
Gross Profit
235,000
187,500
Operating Expenses
170,000
138,500
Income from Operations
65,000
49,000
Interest Expense
26,000
1,750
Income before Taxes
39,000
47,250
Income Taxes
15,000
18,500
Net Income
$ 24,000
$ 28,750
151. Rhodes Bakery
The balance sheet taken from the company’s 2015 10-K is provided below:
December 31
Assets:
2015
2014
Current Assets:
Cash
$ 61,100
$54,000
Accounts Receivable
22,500
17,500
Inventory
8,500
7,000
Other Current Assets
6,500
5,500
Total Current Assets
98,600
84,000
Long-term Assets:
Property, Plant & Equipment, net
744,900
25,000
Intangible Assets
211,250
225,000
Total Assets
$1,054,750
$334,000
Liabilities and Stockholders’ Equity
Current Liabilities:
Accounts Payable
$ 5,500
$ 4,500
Interest Payable
500
500
Current Portion of Long-Term Debt
15,000
0
Income Tax Payable
18,500
23,000
Total Current Liabilities
$ 39,500
28,000
Long-term Liabilities:
Notes Payable
246,250
15,000
Total Liabilities
285,750
43,000
Stockholders’ Equity
Common Stock
60,000
35,000
Additional Paid-in Capital
654,000
186,000
Retained Earnings
92,500
70,000
Treasury Stock
(37,500)
0
Total Stockholders’ Equity
769,000
291,000
Total Liabilities and Stockholders’ Equity
$1,054,750
$334,000
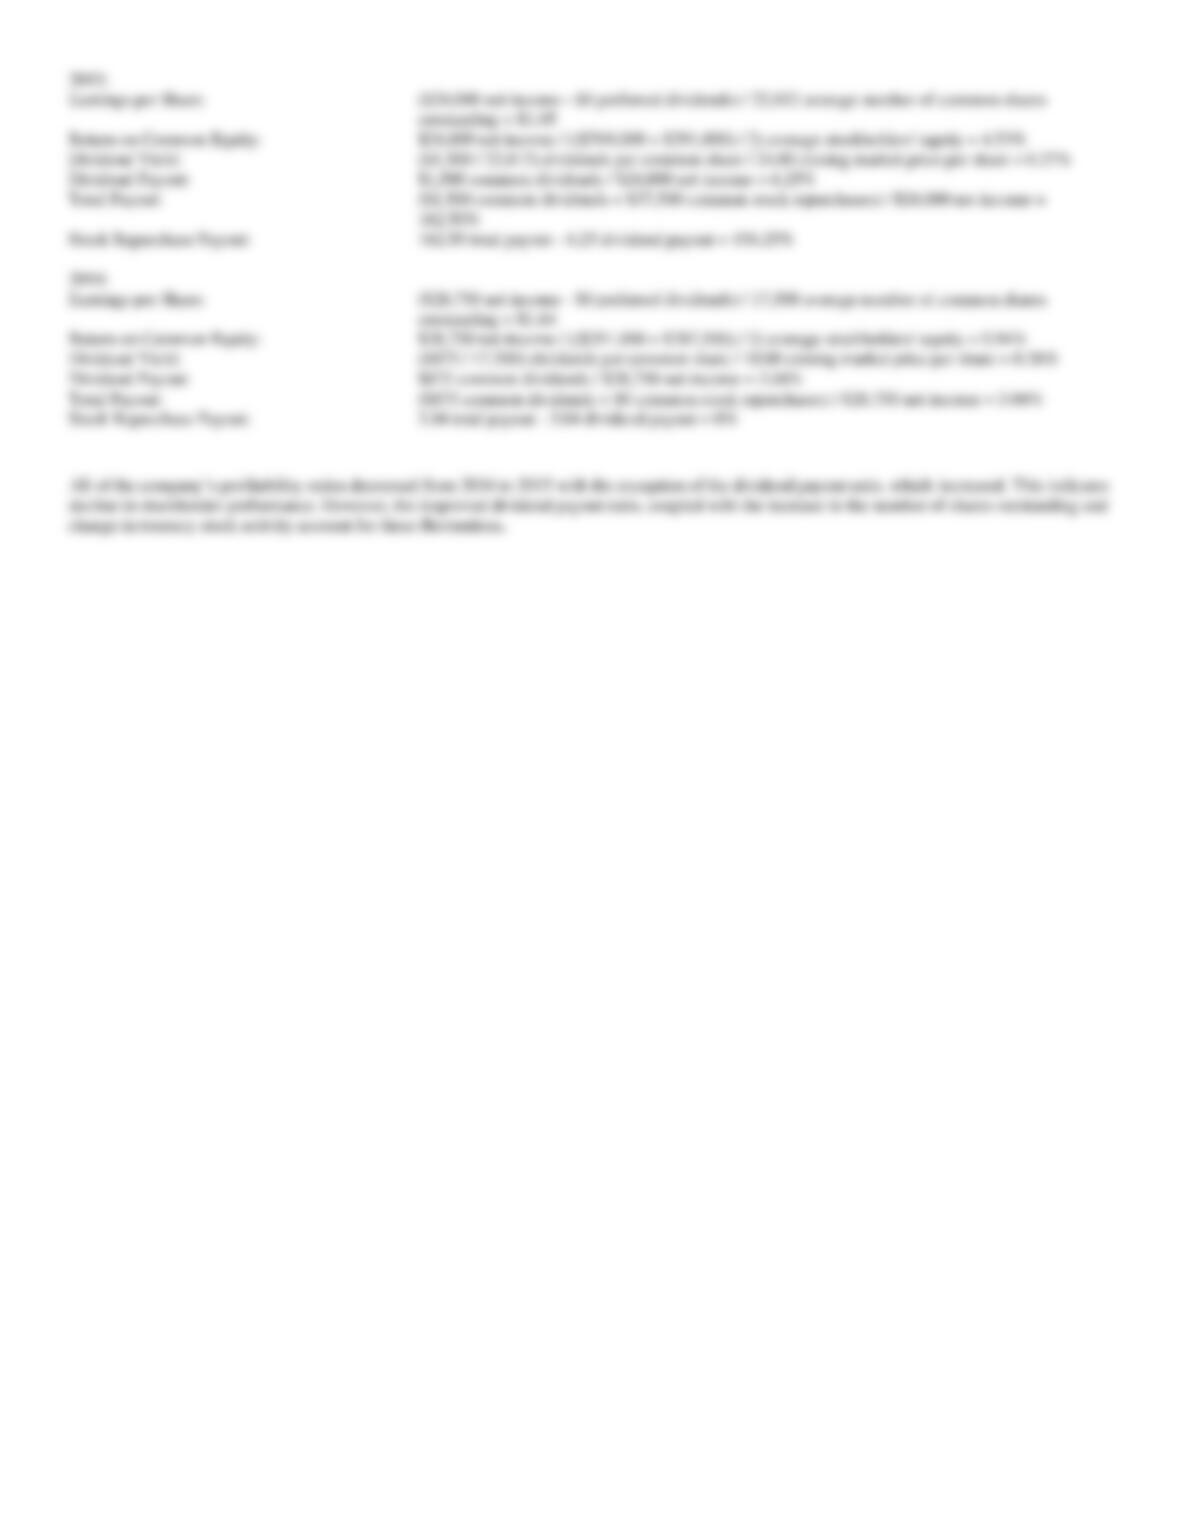
Refer to Rhodes Bakery. Calculate the following stockholder ratios for 2015 and 2014: Earnings per Share, Return on Common Equity, Dividend
Yield, Dividend Payout, Total Payout, and Stock Repurchase Payout Ratios. Round your answers to two decimal places, then comment on the
company’s stockholder performance.
2015
2014
Net Income
$24,000
$28,750
Dividends Paid
$ 1,500
$ 875
Average number of shares outstanding
22,812
17,500
Closing market price per share
$ 24.00
$ 18.00

152. Rhodes Bakery
The balance sheet taken from the company’s 2015 10-K is provided below:
December 31
Assets:
2015
2014
Current Assets:
Cash
$ 61,100
$54,000
Accounts Receivable
22,500
17,500
Inventory
8,500
7,000
Other Current Assets
6,500
5,500
Total Current Assets
98,600
84,000
Long-term Assets:
Property, Plant & Equipment, net
744,900
25,000
Intangible Assets
211,250
225,000
Total Assets
$1,054,750
$334,000
Liabilities and Stockholders’ Equity
Current Liabilities:
Accounts Payable
$ 5,500
$ 4,500
Interest Payable
500
500
Current Portion of Long-Term Debt
15,000
0
Income Tax Payable
18,500
23,000
Total Current Liabilities
$ 39,500
28,000
Long-term Liabilities:
Notes Payable
246,250
15,000
Total Liabilities
285,750
43,000
Stockholders’ Equity
Common Stock
60,000
35,000
Additional Paid-in Capital
654,000
186,000
Retained Earnings
92,500
70,000
Treasury Stock
(37,500)
0
Total Stockholders’ Equity
769,000
291,000
Total Liabilities and Stockholders’
Equity
$1,054,750
$334,000
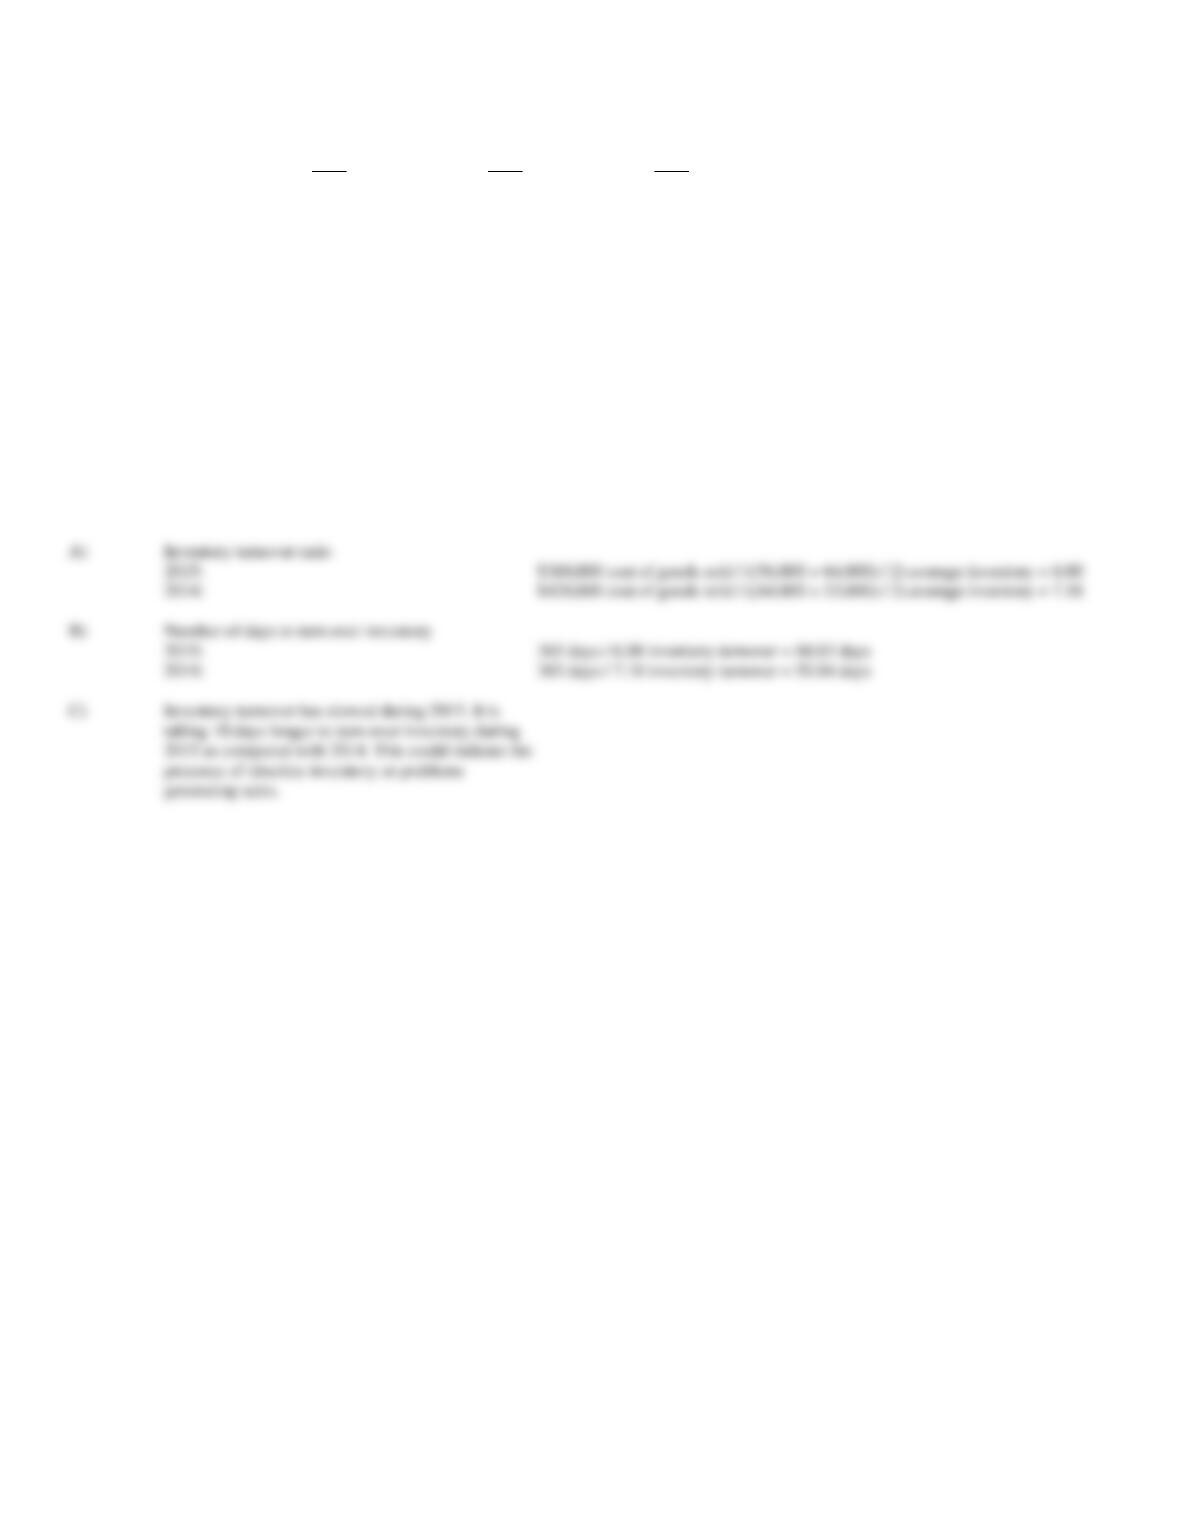
Refer to Rhodes Bakery. Perform DuPont Analysis for 2015 and 2014, including the three components of Return on Equity (ROE). Round your
answers to two decimal places, then comment on the company’s relative ROE from 2014 to 2015.
Additional information is available below:
2015
2014
Total Sales
$500,000
$410,000
Net Income
$ 24,000
$ 28,750
At December 31, 2013, the company’s total assets and total stockholders’ equity were $325,000 and $287,500, respectively.
2015:
2014:
153. Use the following selected financial information to answer the questions that follow.
2015
2014
2013
Inventory
$ 56,000
$ 64,000
$ 53,000
Total Assets
1,205,000
952,000
945,000
Cost of Goods Sold
360,000
420,000
440,000
Net Income
65,000
25,000
16,000
A)
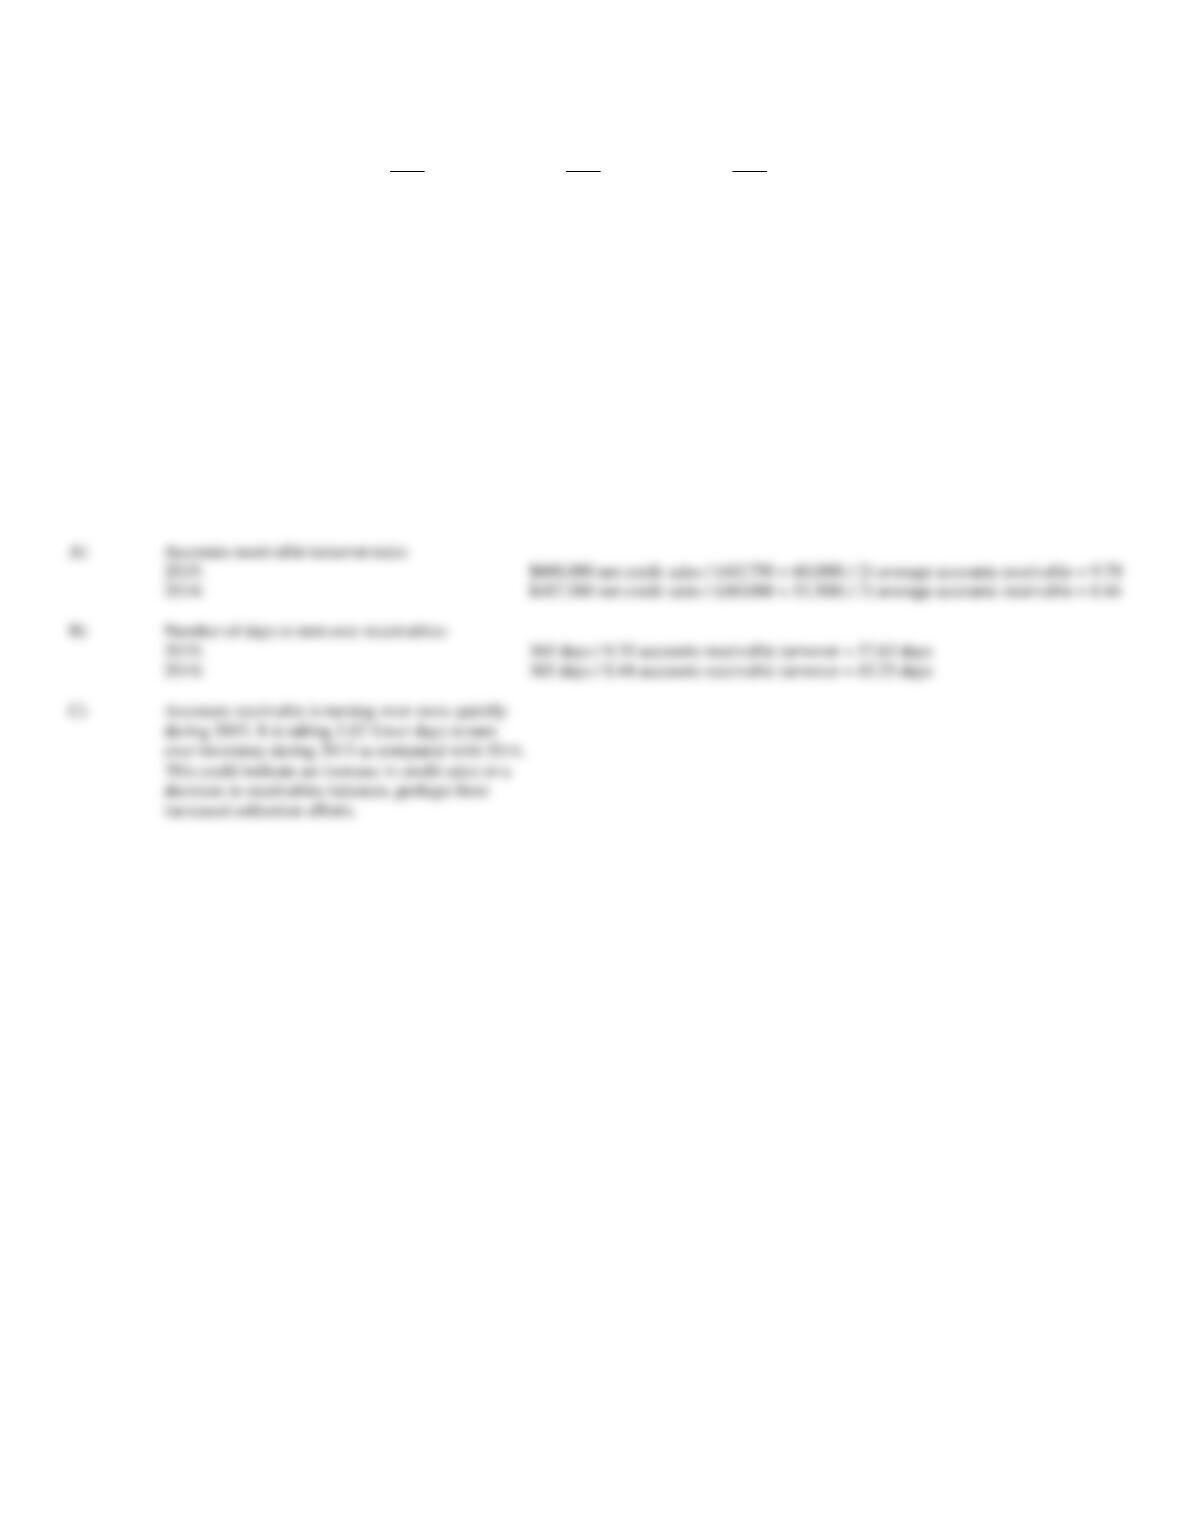
Calculate this company’s inventory turnover ratio for 2015 and 2014.
B)
Determine the number of days it would take to turn over the entire inventory at December 31, 2015 and 2014.
C)
What problems are apparent with the company’s inventory management?
A)
Inventory turnover ratio
2015:
2014:
B)
Number of days to turn over inventory
2015:
2014:
154. Use the selected financial information provided below to answer the following questions.
2015
2014
2013
Accounts Receivable
$ 63,750
$ 60,000
$ 55,500
Total Assets
487,500
615,750
600,000
Net Credit Sales
600,000
487,500
540,000
Net Income
11,250
65,000
9,000
A)
Calculate the company’s accounts receivable turnover ratio for 2015 and 2014.
B)
Determine the number of days it would take to turn over accounts receivable at December 31, 2015 and 2014.
C)
What could have caused the change?
A)
Accounts receivable turnover ratio:
2015:
2014:
B)
Number of days to turn over receivables:
2015:
2014:

155. Use the following selected financial information to compare these three companies and answer the
questions that follow.
Rabbit Co.
Reptile Co.
Rhino Co.
Accounts Receivable
December 31, 2015
$ 22,000
$ 33,000
$ 41,500
December 31, 2014
12,800
30,000
42,600
Inventory
December 31, 2015
12,600
22,600
54,200
December 31, 2014
32,800
23,900
44,000
Net Credit Sales
2015
320,000
620,000
510,000
2014
310,000
610,000
760,000
Cost of Goods Sold
2015
406,000
211,000
311,000
2014
200,000
156,000
310,000
A)
Calculate the accounts receivable turnover ratio for each company for 2015.
B)
Which company appears to be in the best position regarding asset efficiency based solely on the accounts receivable turnover?
C)
Calculate the inventory turnover ratio for each company for 2015.
D)
Which company appears to be in the best position regarding asset efficiency based solely on the inventory turnover?
E)
Calculate and interpret each company’s operating cycle.
156. Use the following selected financial information to compare these two companies at December 31, 2015,
and to answer the questions that follow.
Russell Co.
Ryland Co.
Cash
$340,800
$100,200
Short-term investments
12,000
7,600
Accounts receivable
413,300
60,000
Inventories
200,000
39,000
Other current assets
7,400
1,000
Total current assets
973,500
207,800
Total current liabilities
860,900
150,000
Long-term liabilities
5,000,400
300,500
Stockholders’ equity
2,400,300
800,700
Cash flows from operating activities
750,000
290,000
Calculate working capital and the short-term liquidity ratios for these two companies for 2015 and comment on their relative liquidity.
Working Capital:
Russell:
$973,500 current assets – 860,900 current liabilities = $112,600
Ryland:
$207,800 current assets – 150,000 current liabilities = $57,800
Current Ratio:
Russell:
$973,500 current assets / 860,900 current liabilities = 1.13
Ryland:
$207,800 current assets / 150,000 current liabilities = 1.39
Quick Ratio:
Russell:
($340,800 cash + 12,000 short-term investments + 413,300 receivables) / 860,900 current liabilities = 0.89
Ryland:
($100,200 cash + 7,600 short-term investments + 60,000 receivables) / 150,000 current liabilities = 1.12
Cash Ratio:
Russell:
($340,800 cash + 12,000 short-term investments) / 860,900 current liabilities = 0.41
Ryland:
($100,200 cash + 7,600 short-term investments) / 150,000 current liabilities = 0.72
Russell:
$750,000 cash flows from operations / 860,900 current liabilities = 0.87
Ryland:
$290,000 cash flows from operations / 150,000 current liabilities = 1.93
157. Use the following selected financial information to compare these two companies at December 31, 2015,
and to answer the questions that follow.
Robin’s Co.
Ruth’s Co.
Cash
$ 1,100
$ 300
Short-term investments
100
900
Accounts and notes receivable
11,700
12,400
Inventories
1,200
1,000
Prepaid expenses
1,400
600
Total current assets
15,500
15,200
Total current liabilities
5,000
4,000
Long-term liabilities
2,300
12,000
Stockholders’ equity
5,300
7,300
A)
Compute the current ratios for the two companies.
B)
Compute the quick ratios for the two companies.
C)
Which company appears to be more liquid?
D)
What other ratios would help to more fully assess the liquidity of these two companies?
Current Ratio:
Robin:
Ruth:
B)
Quick Ratio:
Robin:
Ruth:
158. Royal Dunes Company is a retailer of specialty beachwear. During 2015, the company expanded its retail
business by adding 30 new retail stores. The following information is obtained from the comparative financial
statements included in the company’s 2015 Form 10-K (all amounts in $ thousands).
January 31, 2015
January 31, 2014
Current liabilities
$ 6,000
$ 8,000
Total liabilities
26,000
18,000
Total stockholders’ equity
34,000
38,000
Total assets
60,000
56,000
For the fiscal years ended January
31
2015
2014
Depreciation expense
$ 2,000
$ 6,000
Interest expense
3,400
3,200
Income tax expense
12,600
18,100
Net income
6,000
15,000
Net cash flows from operations
41,000
(400)
Total dividends paid
2,000
12,000
Using the information provided, address the following questions for both 2015 and 2014:
A)
What is the debt-to-equity ratio?
B)
What is the times interest earned ratio?
C)
What is the long-term debt-to-equity ratio, assuming that there is no current portion of long-term debt?
D)
What is the long-term debt-to-total assets ratio, assuming that there is no current portion of long-term debt?
E)
What is the debt-to-total assets ratio?
F)
Comment briefly on the company’s debt management position.
A)
2015:
2014:
B)
Times Interest Earned Ratio:
2015:
2014:
C)
Long-term Debt-to-equity Ratio:
2015:
2014:
D)
Long-term Debt-to-total Assets Ratio:
2015:
2014:
E)
2015:
2014:
of the decreases are substantial.
159. Use the following selected financial data from the balance sheet at the end of 2015 and 2014:
June 30, 2015
June 30, 2014
Total current liabilities
$ 495,000
$ 320,000
Bonds payable
600,000
500,000
Common stock, $5 par
800,000
800,000
Retained earnings
200,000
100,000
Total stockholders’ equity
1,000,000
900,000
Total liabilities and stockholders’ equity
2,095,000
1,720,000
Net income for 2015 and 2014 was $120,000 and $460,000, respectively. No stock was issued during either year, but dividends of $20,000 and
$16,000 were paid in 2015 and 2014, respectively.
A)
What is return on common equity ratio for 2015?
B)
What is the dividend payout ratio for 2015?
C)
What is the earnings per share measure for 2015?
D)
What other stockholder ratios would be helpful in assessing information of interest to stockholders?
A)
Return on Common Equity:
$120,000 net income / ((1,000,000 + 900,000) / 2) average common equity = 12.63%
$20,000 dividends / 120,000 net income = 16.67%
C)
Earnings per Share:
($120,000 net income – 0 preferred dividends) / (800,000 / $5 par) average common shares outstanding = $.75
160. Use the following selected financial data from the balance sheet at the end of 2015 and 2014:
2015
2014
Net income
$110,000
$123,000
Cash dividends paid on preferred stock
$ 12,000
$ 15,000
Cash dividends paid on common stock
$ 42,000
$ 38,000
Common stock repurchases
$ 10,000
$ 14,000
Weighted average number of common shares outstanding
105,000
95,000
Year-end market price per share of common stock
$ 16.00
$ 13.00
Using the information provided, address the following questions for both 2015 and 2014:
A)
What is the dividend yield ratio?
B)
What is the earnings per share measure?
C)
What is the dividend payout ratio?
D)
What is the total payout ratio?
E)
What is the stock repurchase payout ratio?
F)
Comment on the change in the stockholders ratios from 2014 to 2015.
A)
Dividend yield ratio:
B)
Earnings per share:
2015:
($110,000 net income – 12,000 preferred dividends) / 105,000 average common shares outstanding = $0.93
2014:
($123,000 net income – 15,000 preferred dividends) / 95,000 average common shares outstanding = $1.14
C)
Dividend payout ratio:
2015:
$42,000 common dividends / 110,000 net income = 38.18%
2014:
$38,000 common dividends / 123,000 net income = 30.89%
D)
Total payout ratio:
2015:
($42,000 common dividends + 10,000 common stock repurchases) / 110,000 net income = 47.27%
2014:
($38,000 common dividends + 14,000 common stock repurchases) / 123,000 net income = 42.27%
E)
Stock repurchase payout ratio:
2015:
47.27% total payout ratio – 38.18 dividend payout ratio = 9.09%
2014:
42.27% total payout ratio – 30.89 dividend payout ratio = 11.38%