57.
The following is an example of:
Year
Increase (Decrease)
2018
2017
Amount
%
Cash
$300,000
$800,000
($500,000)
(62.5)
Accounts receivable
500,000
200,000
300,000
150.0
Inventory
800,000
700,000
100,000
14.3
Long-term assets
3,400,000
2,300,000
1,100,000
47.8
Total assets
$5,000,000
$4,000,000
$1,000,000
25.0
58.
Trend analysis and time-series analysis refer to ____ analysis.
59.
To calculate a year–to-year percentage change in any financial statement line item such
as sales, you should take the current year’s amount, subtract the prior year’s amount, then
divide by ______, and finally multiply the result by 100.
60.
Brady’s Inflation Needle Co. reports accounts receivable of $100,000 in 2017 and $250,000
in 2018. Using horizontal analysis, what would be the percentage increase or decrease in
accounts receivable?
61.
The type of analysis used to analyze trends in financial statement data over time is:
62.
Horizontal analysis is used to analyze trends in financial statement data over time:
63.
Horizontal analysis examines trends in a company
64.
Which of the following is an example of horizontal analysis?
65.
Which of the following is an example of horizontal analysis?
66.
Comparing changes in net income for one company over time is an example of:
67.
Which of the following is correct?
68.
Which of the following ratios is most useful in evaluating liquidity?
69.
Which of the following ratios is most useful in evaluating liquidity?
70.
Which of the following ratios is most useful in evaluating solvency?
71.
Which of the following is a sign that a company can quickly turn its receivables into cash?
72.
Which of the following is a sign that a company cannot quickly turn its receivables into
cash?
73.
Which of the following is a negative sign that a company is not selling its inventory
quickly?
74.
Which of the following is a positive sign that a company is selling its inventory quickly?
75.
The current ratio is calculated as:
76.
The acid-test ratio is most similar to the:
77.
The acid-test ratio is:
78.
Which of the following is not a solvency ratio?
79.
When a company with a current ratio of 1.2 pays a current liability:
80.
Assuming a current ratio of 1.0, how will the purchase of inventory with cash affect the
ratio?
81.
Assuming an acid-test ratio of 1.0, how will the purchase of inventory with cash affect the
ratio?
82.
Assuming a current ratio of 1.0 and an acid-test ratio of 0.75, how will the purchase of
inventory with cash affect each ratio?
83.
When a company sells land for cash and makes a $25,000 gain:
84.
Assume a company’s current ratio and acid-test ratio are less than 1.0 before it purchases
inventory on credit. When it makes the purchase:
85.
A partial balance sheet for Captain D‘s Sportswear is shown below.
(dollars
in
thousands)
Assets:
Liabilities:
Cash
$60
Accounts payable
$240
Accounts receivable (net)
170
Other liabilities
80
Investments
50
Total current liabilities
320
Inventory
200
Long-term liabilities
110
Prepaid rent
25
Total liabilities
430
Total current assets
505
Stockholders’ equity:
Property & Equipment, (net)
255
Common stock
150
Retained earnings
180
Total stockholders’ equity
330
Total assets
$760
Total liabilities and equity
$760
The current ratio is (rounded to two decimal places):
86.
A partial balance sheet for Captain D‘s Sportswear is shown below.
(dollars
in
thousands)
Assets:
Liabilities:
Cash
$60
Accounts payable
$240
Accounts receivable (net)
170
Other liabilities
80
Investments
50
Total current liabilities
320
Inventory
200
Long-term liabilities
110
Prepaid rent
25
Total liabilities
430
Total current assets
505
Stockholders’ equity:
Property & Equipment, (net)
255
Common stock
150
Retained earnings
180
Total stockholders’ equity
330
Total assets
$760
Total liabilities and equity
$760
The acid-test ratio is (rounded to two decimal places):
87.
A partial balance sheet for Captain D‘s Sportswear is shown below.
(dollars
in
thousands)
Assets:
Liabilities:
Cash
$60
Accounts payable
$240
Accounts receivable (net)
170
Other liabilities
80
Investments
50
Total current liabilities
320
Inventory
200
Long-term liabilities
110
Prepaid rent
25
Total liabilities
430
Total current assets
505
Stockholders’ equity:
Property & Equipment, (net)
255
Common stock
150
Retained earnings
180
Total stockholders’ equity
330
Total assets
$760
Total liabilities and equity
$760
The debt to equity ratio is (rounded to two decimal places):
88.
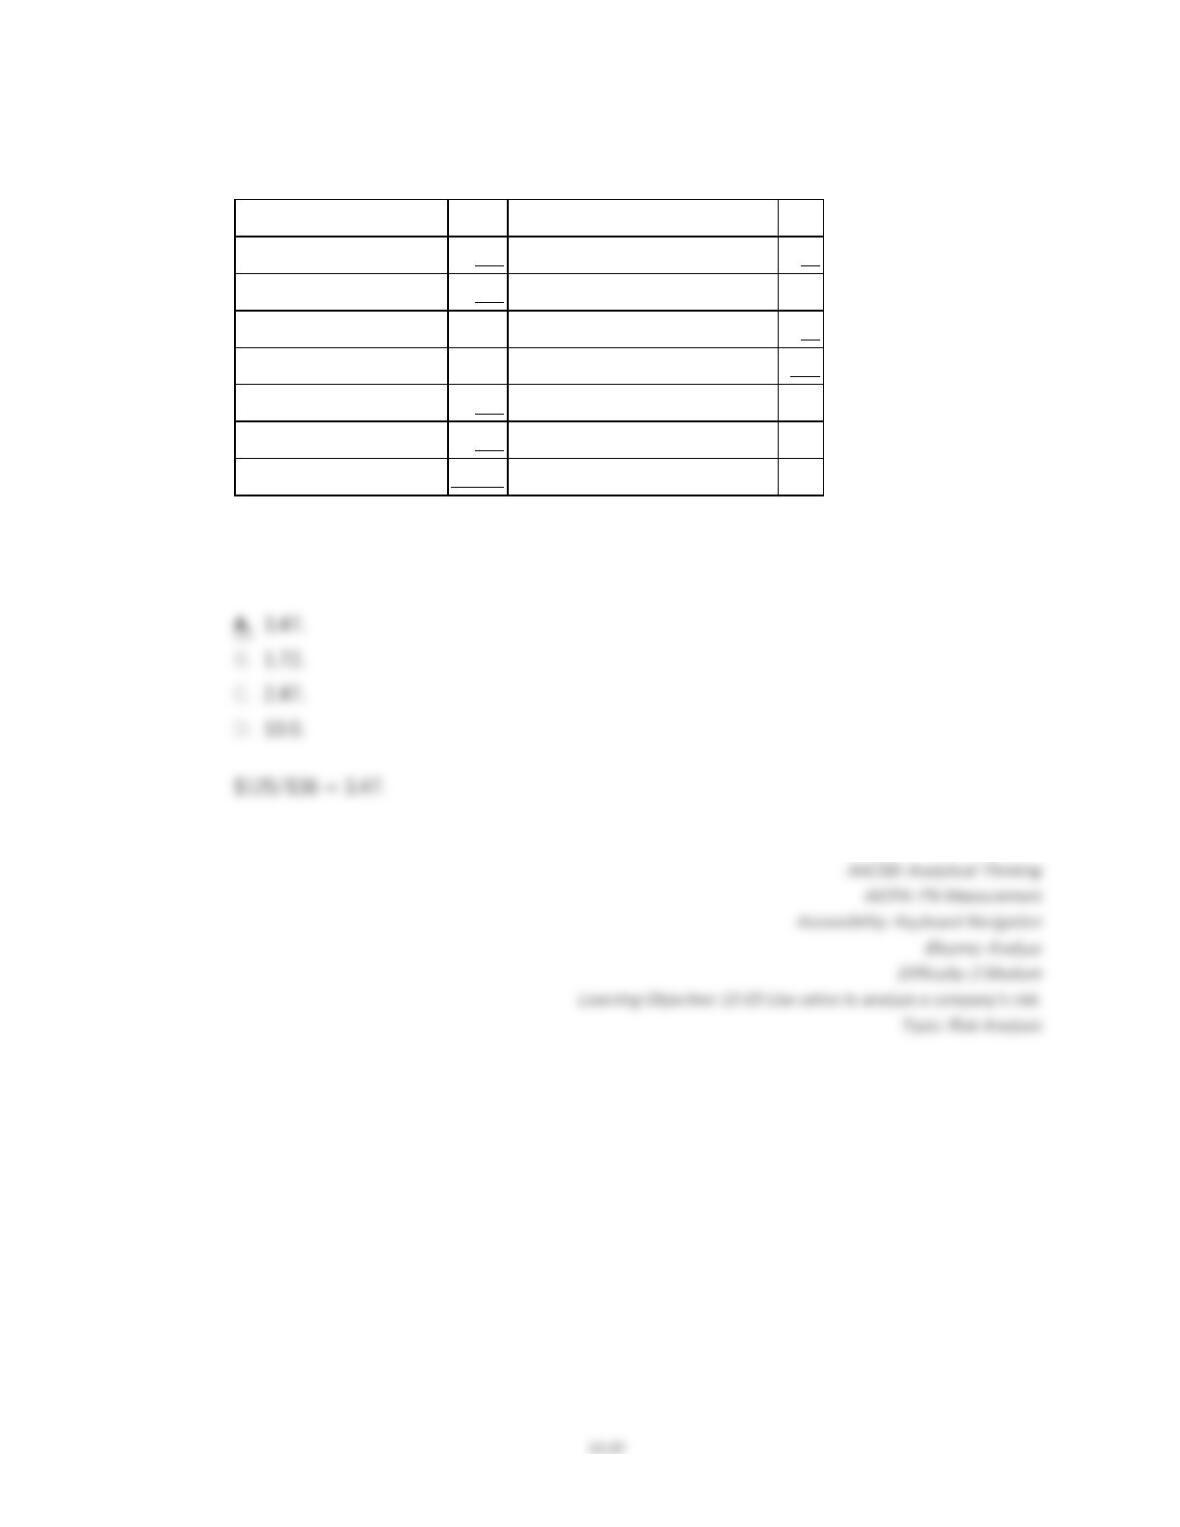
Recent financial statement data for Harmony Health Foods (HHF) Inc. is shown below.
Current liabilities
$180
Income before interest and taxes
$125
10% Bonds, long-term
360
Interest expense
36
Total liabilities
540
Income before tax
89
Stockholders’ equity
Income tax
27
Common stock
200
Net income
$62
Retained earnings
280
Total stockholders’ equity
480
Total liabilities and equity
$1,020
HHF’s debt to equity ratio is (rounded to two decimal places):
89.
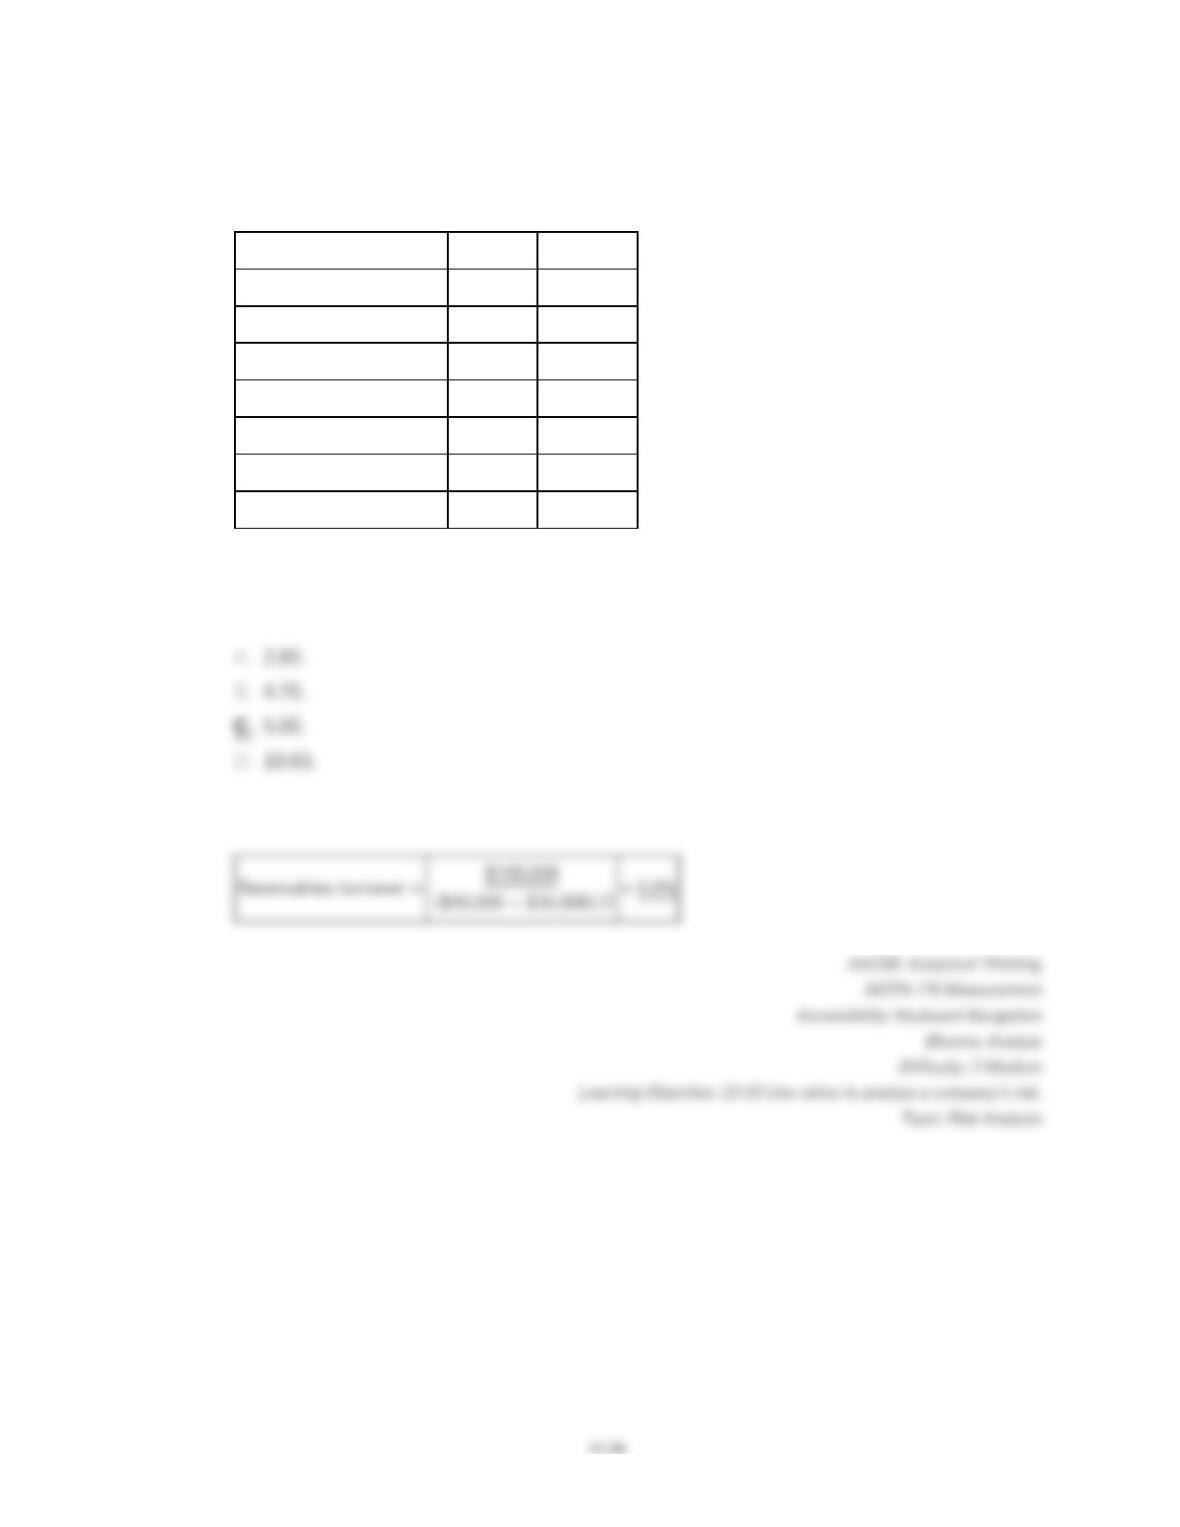
Recent financial statement data for Harmony Health Foods (HHF) Inc. is shown below.
Current liabilities
$180
Income before interest and taxes
$125
10% Bonds, long-term
360
Interest expense
36
Total liabilities
540
Income before tax
89
Stockholders’ equity
Income tax
27
Common stock
200
Net income
$62
Retained earnings
280
Total stockholders’ equity
480
Total liabilities and equity
$1,020
HHF’s times interest earned ratio is (rounded to two decimal places):
90.
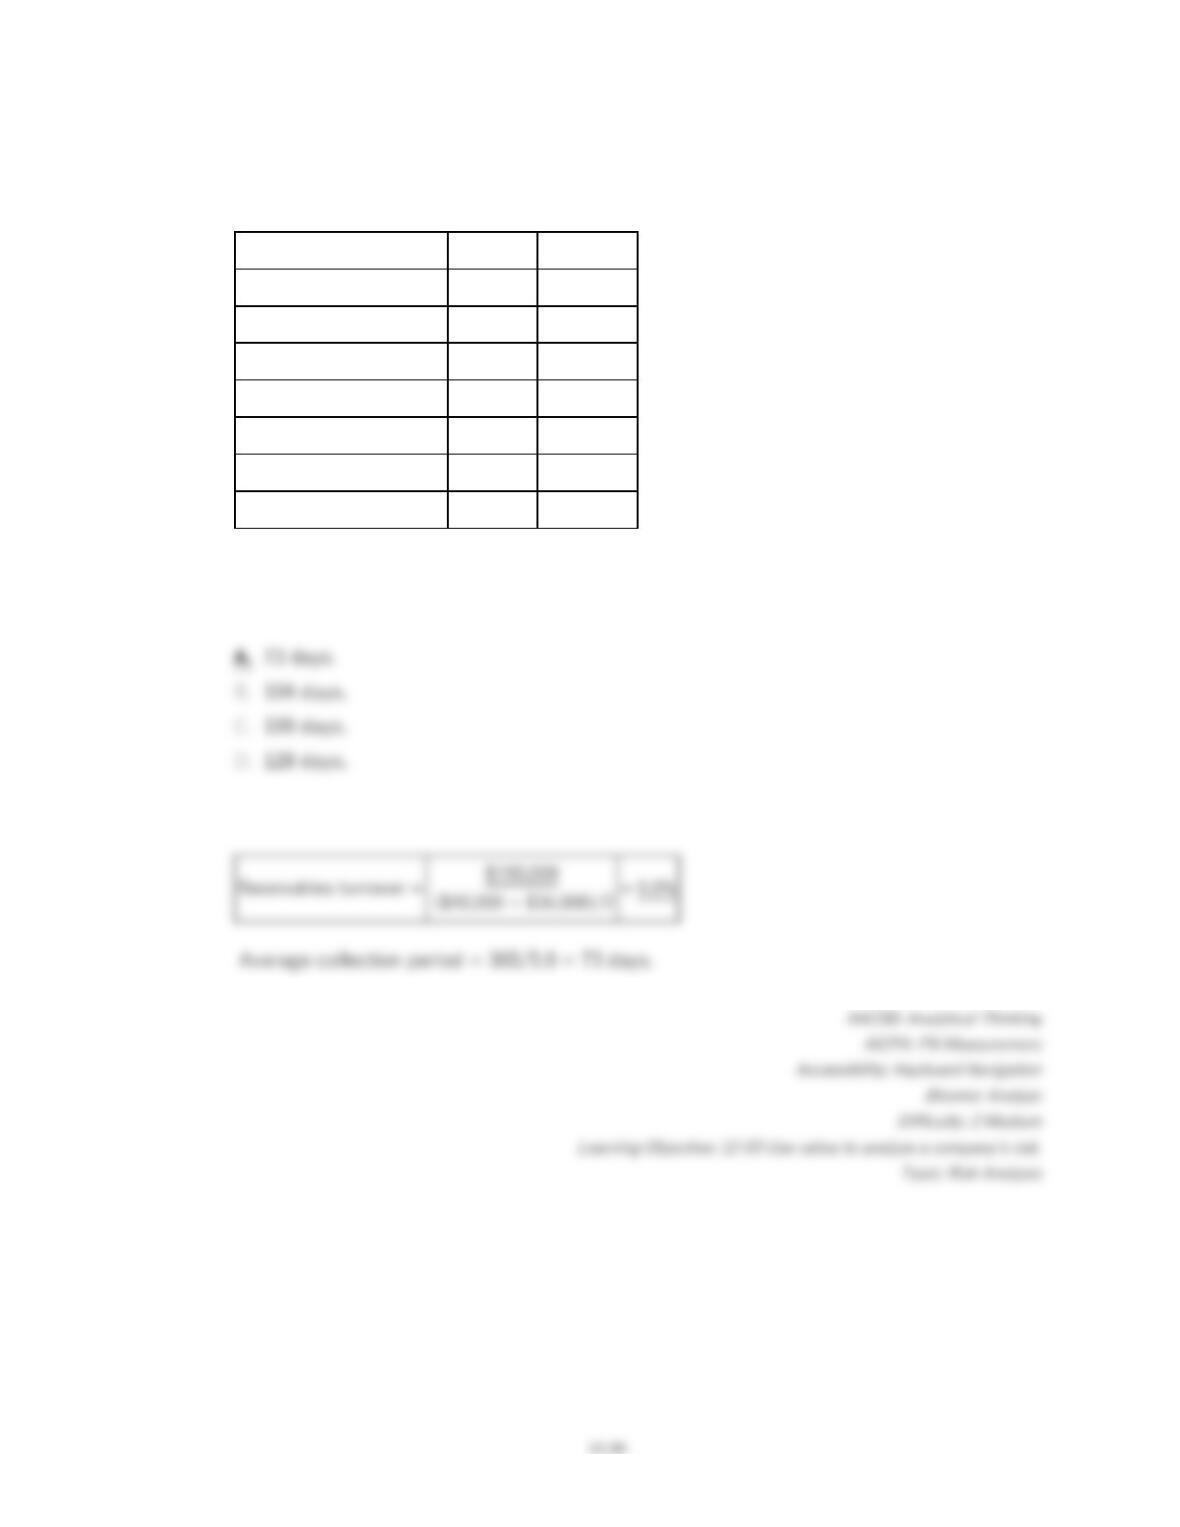
Excerpts from Stealth Company’s December 31, 2018 and 2017, financial statements are
presented below:
2018
2017
Accounts receivable
$40,000
$36,000
Inventory
28,000
35,000
Net sales
190,000
186,000
Cost of goods sold
114,000
108,000
Total assets
425,000
405,000
Total stockholders’ equity
240,000
225,000
Net income
32,500
28,000
($40,000 + $36,000)/2
Stealth Company’s 2018 receivables turnover ratio is:
91.
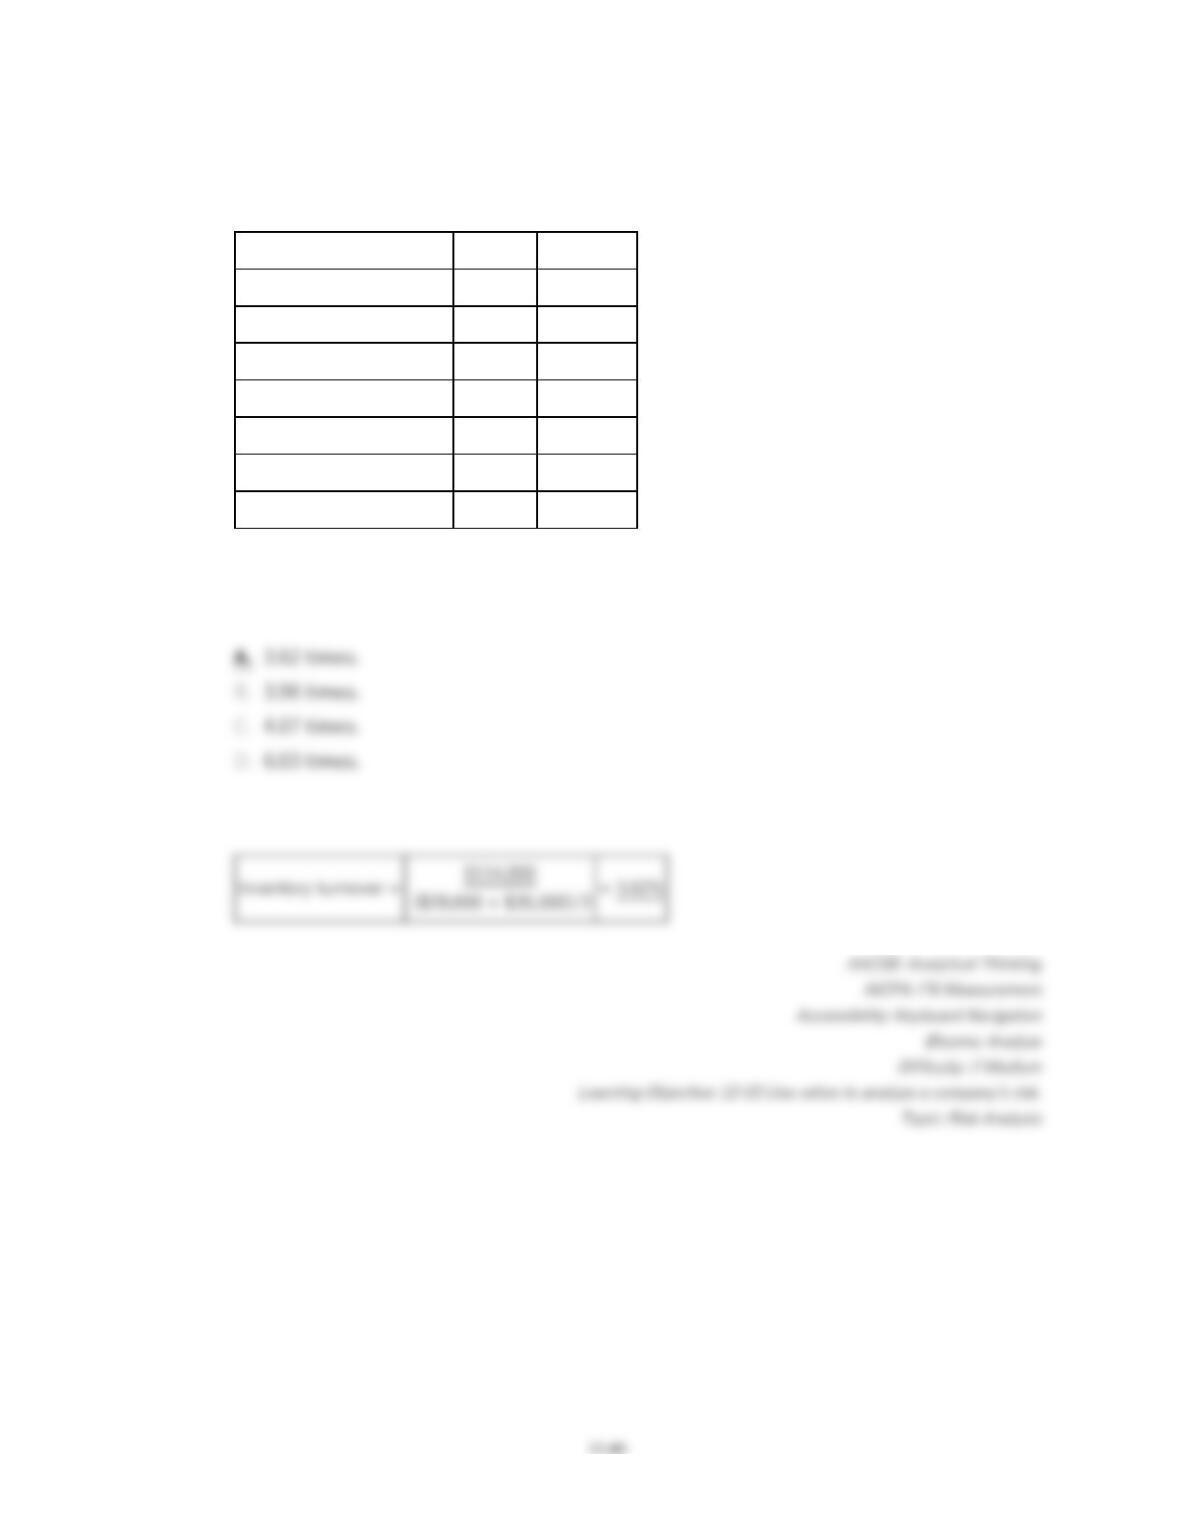
Excerpts from Stealth Company’s December 31, 2018 and 2017, financial statements are
presented below:
2018
2017
Accounts receivable
$40,000
$36,000
Inventory
28,000
35,000
Net sales
190,000
186,000
Cost of goods sold
114,000
108,000
Total assets
425,000
405,000
Total stockholders’ equity
240,000
225,000
Net income
32,500
28,000
($40,000 + $36,000)/2
Stealth Company’s 2018 average collection period is:
92.
Excerpts from Stealth Company’s December 31, 2018 and 2017, financial statements are
presented below:
2018
2017
Accounts receivable
$40,000
$36,000
Inventory
28,000
35,000
Net sales
190,000
186,000
Cost of goods sold
114,000
108,000
Total assets
425,000
405,000
Total stockholders’ equity
240,000
225,000
Net income
32,500
28,000
($28,000 + $35,000)/2
Stealth Company’s 2018 inventory turnover is (rounded to two decimal places):