Required
:
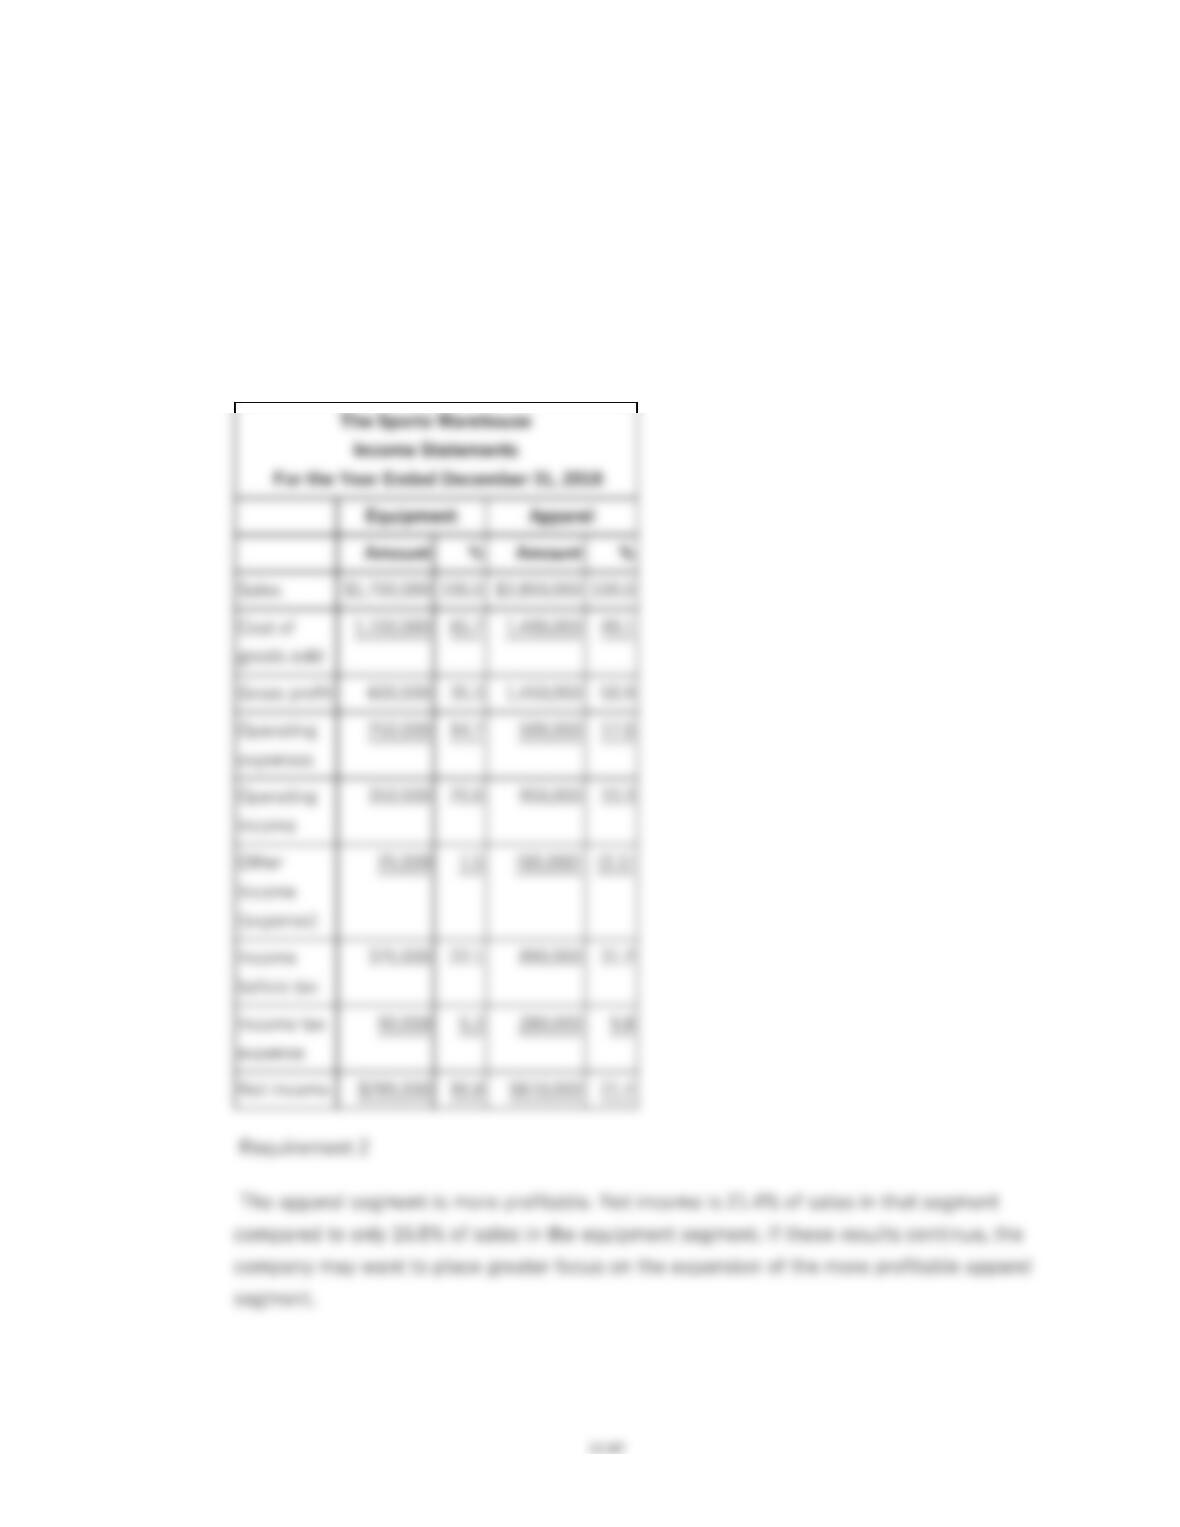
1. Complete the “%” columns to be used in a vertical analysis of The Sports Warehouse’s
two operating segments. Express each amount as a percentage of sales.
2. Use vertical analysis to compare the profitability of the two operating segments. Which
segment is more profitable?
Requirement 1
12–98
169.
The following balance sheets for The Sports Shack are provided.
The Sports Shack
Balance Sheets
December 31
Assets
2018
2017
Current assets:
Cash
$218,000
$196,000
Accounts receivable
680,000
880,000
Inventory
1,250,000
1,100,000
Supplies
90,000
65,000
Long-term assets:
Equipment
1,200,000
900,000
Accumulated depreciation
(350,000)
(250,000)
Total assets
$3,088,000
$2,891,000
Liabilities and Stockholders’ Equity
Current liabilities:
Accounts payable
$65,000
$55,000
Interest payable
4,000
6,000
Income tax payable
40,000
30,000
Long-term liabilities:
Notes payable
400,000
300,000
Stockholders’ equity:
Common stock
900,000
900,000
Retained earnings
1,679,000
1,600,000
Total liabilities and equity
$3,088,000
$2,891,000
Required:
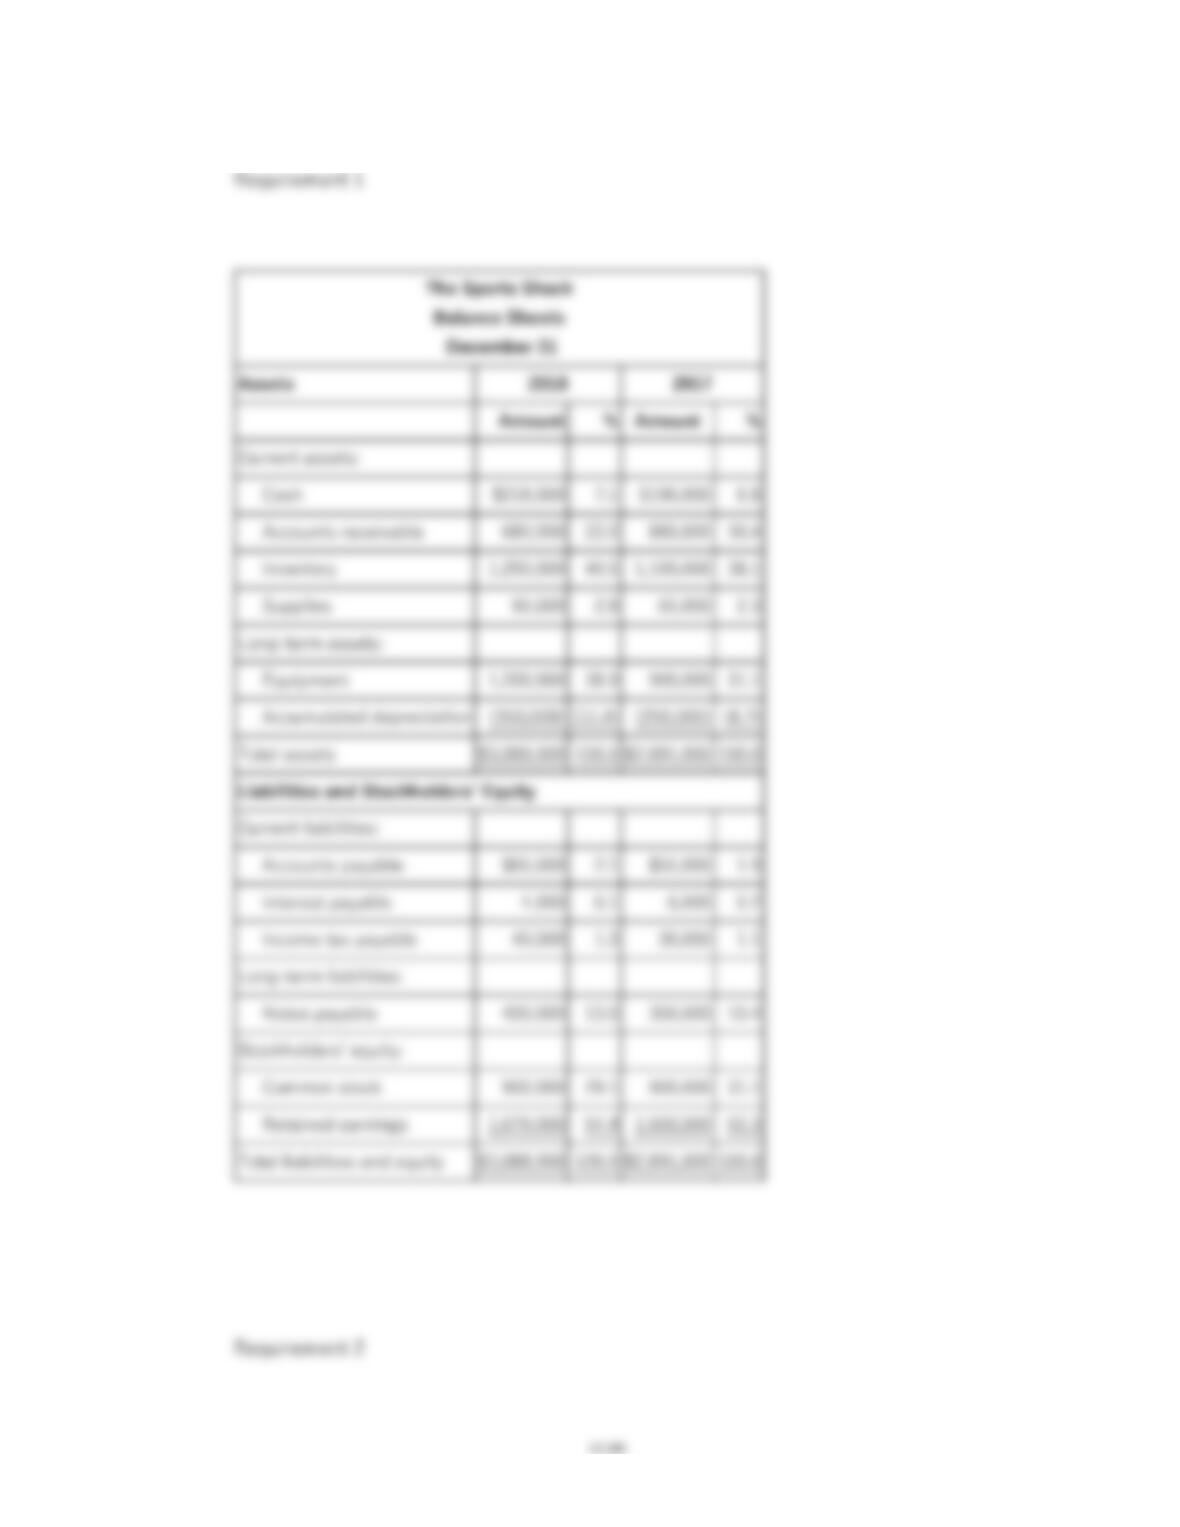
1. Prepare a vertical analysis of The Sports Shack’s 2018 and 2017 balance sheets.
Express each amount as a percentage of total assets for that year.
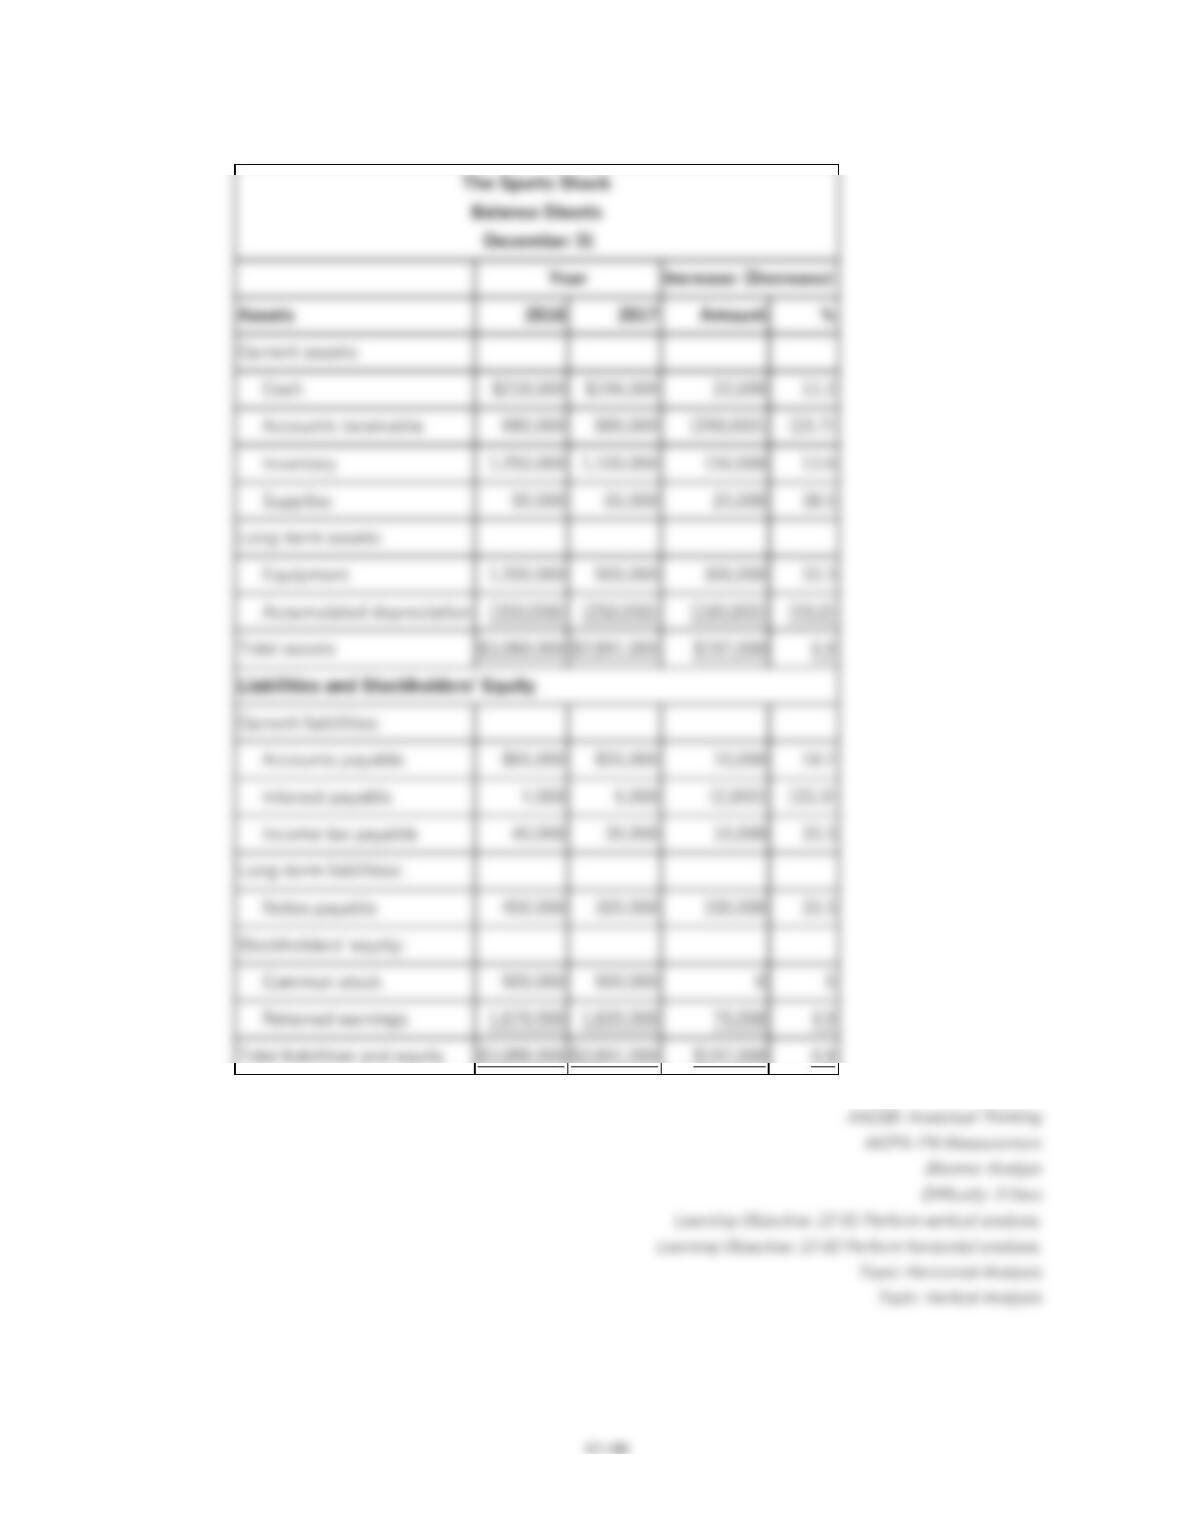
2. Prepare a horizontal analysis of The Sports Shack’s 2018 balance sheet using 2017 as
the base year.
12-101
170.
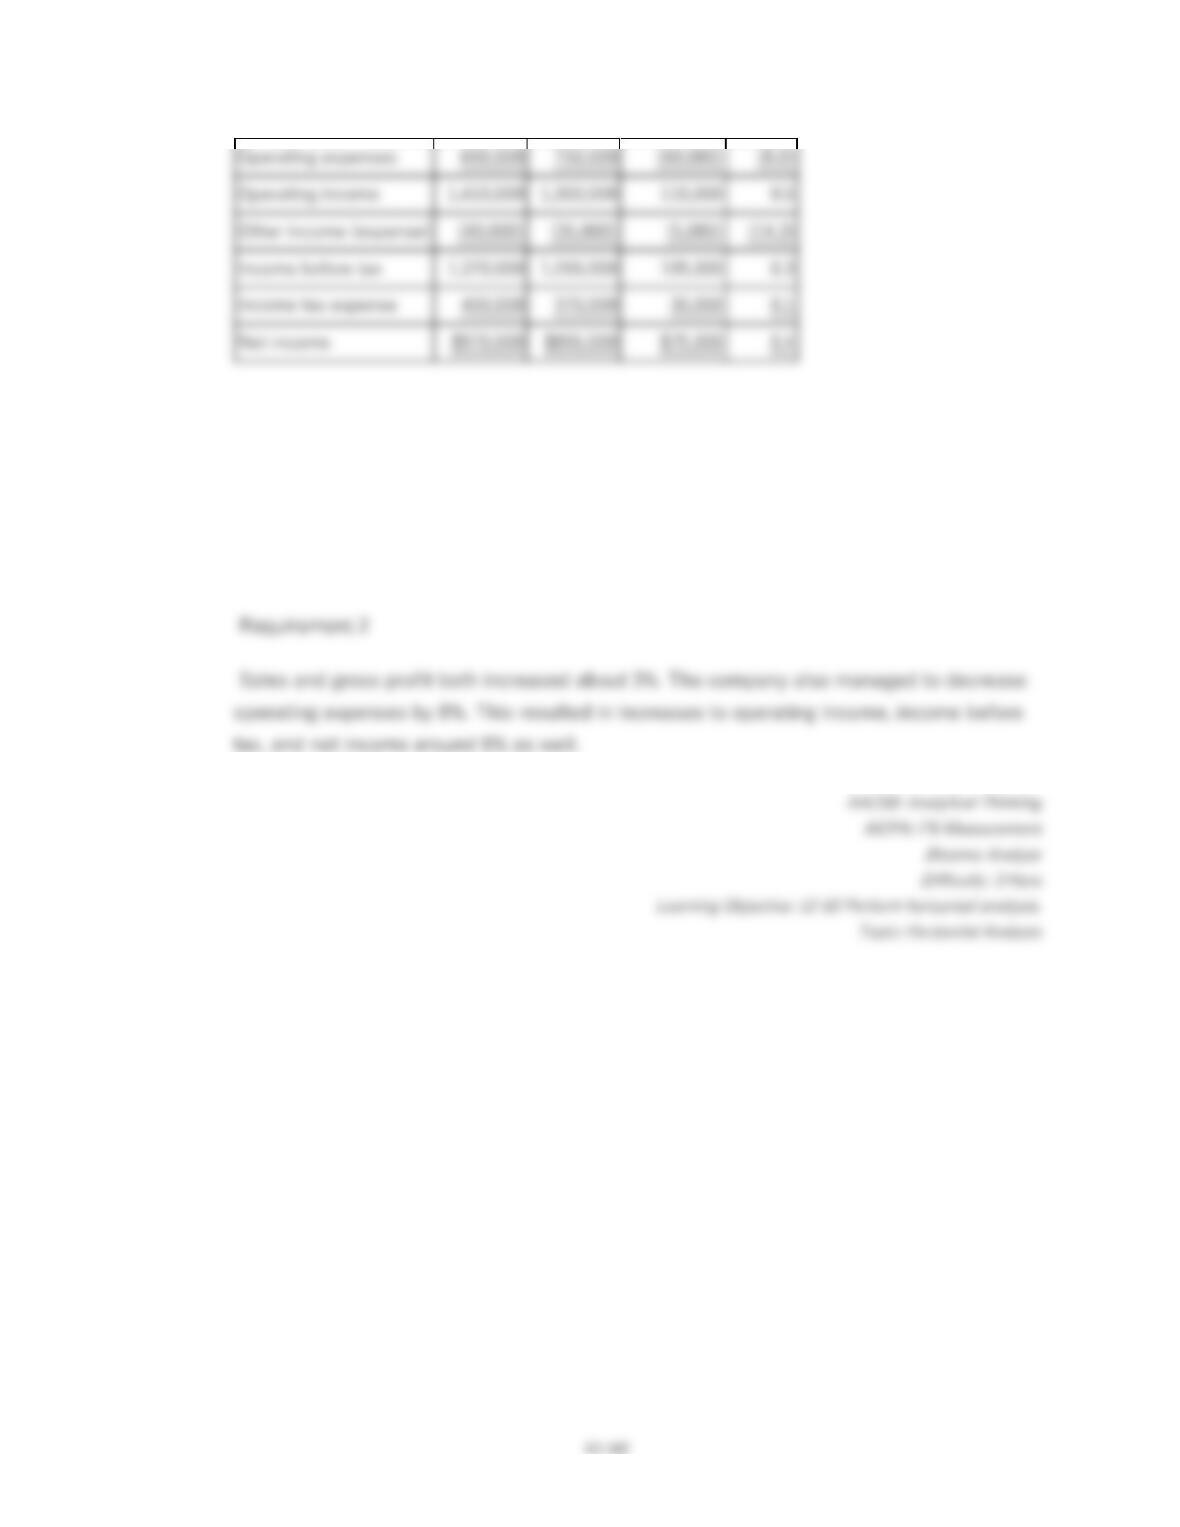
The income statements for The Sports Warehouse for the years ending December 31,
2019, and 2018, are provided.
The Sports Warehouse
Income Statements
For the Years Ended December 31
Increase (Decrease)
2019
2018
Amount
%
Sales
$4,700,000
$4,550,000
Cost of goods sold
2,600,000
2,500,000
Gross profit
2,100,000
2,050,000
Operating expenses
690,000
750,000
Operating income
1,410,000
1,300,000
Other income (expense)
(40,000)
(35,000)
Income before tax
1,370,000
1,265,000
Income tax expense
400,000
370,000
Net income
$970,000
$895,000
Required:
1. Complete the “Amount” and “%” columns to be used in a horizontal analysis of The
Sports Warehouse’s income statement.
2. Discuss the major fluctuations in income statement items during the year.
Increase (Decrease)
2019
2018
Sales
$4,700,000
$4,550,000
12-103
171.
The following income statement and balance sheets for The Sports Shack are provided.
The Sports Shack
Income Statement
For the year ended December 31, 2018
Sales revenue
$6,600,000
Cost of goods sold
4,700,000
Gross profit
1,900,000
Expenses:
Operating expenses
1,400,000
Depreciation expense
100,000
Interest expense
50,000
Income tax expense
80,000
Total expenses
1,630,000
Net income
$270,000
The Sports Shack
Balance Sheets
December 31
Assets
2018
2017
Current assets:
Cash
$218,000
$196,000
Accounts receivable
680,000
880,000
Inventory
1,250,000
1,100,000
Supplies
90,000
65,000
Long-term assets:
Equipment
1,200,000
900,000
Accumulated depreciation
(350,000)
(250,000)
Total assets
$3,088,000
$2,891,000
Liabilities and Stockholders’ Equity
Current liabilities:
Accounts payable
$65,000
$55,000
Interest payable
4,000
6,000
Income tax payable
40,000
30,000
Long-term liabilities:
Notes payable
400,000
300,000
Stockholders’ equity:
Common stock
900,000
900,000
Retained earnings
1,679,000
1,600,000
Total liabilities and equity
$3,088,000
$2,891,000
1. Receivables turnover ratio
5. Current ratio
2. Average collection period
6. Acid-test ratio
3. Inventory turnover ratio
7. Debt to equity ratio
4. Average days in inventory
8. Times interest earned ratio
Required:
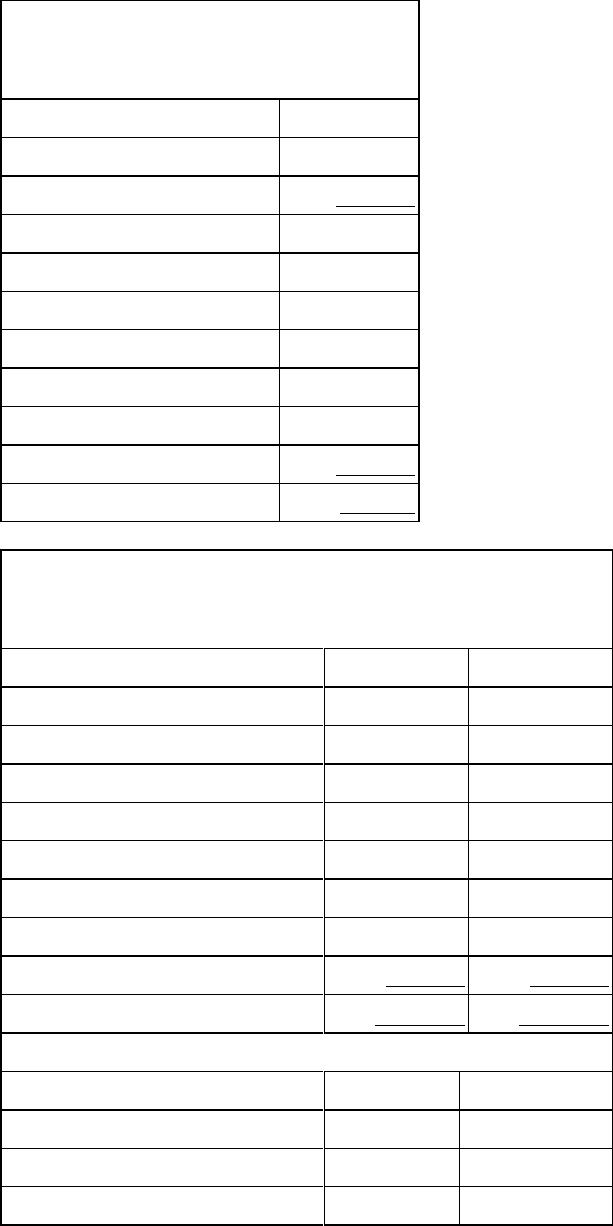
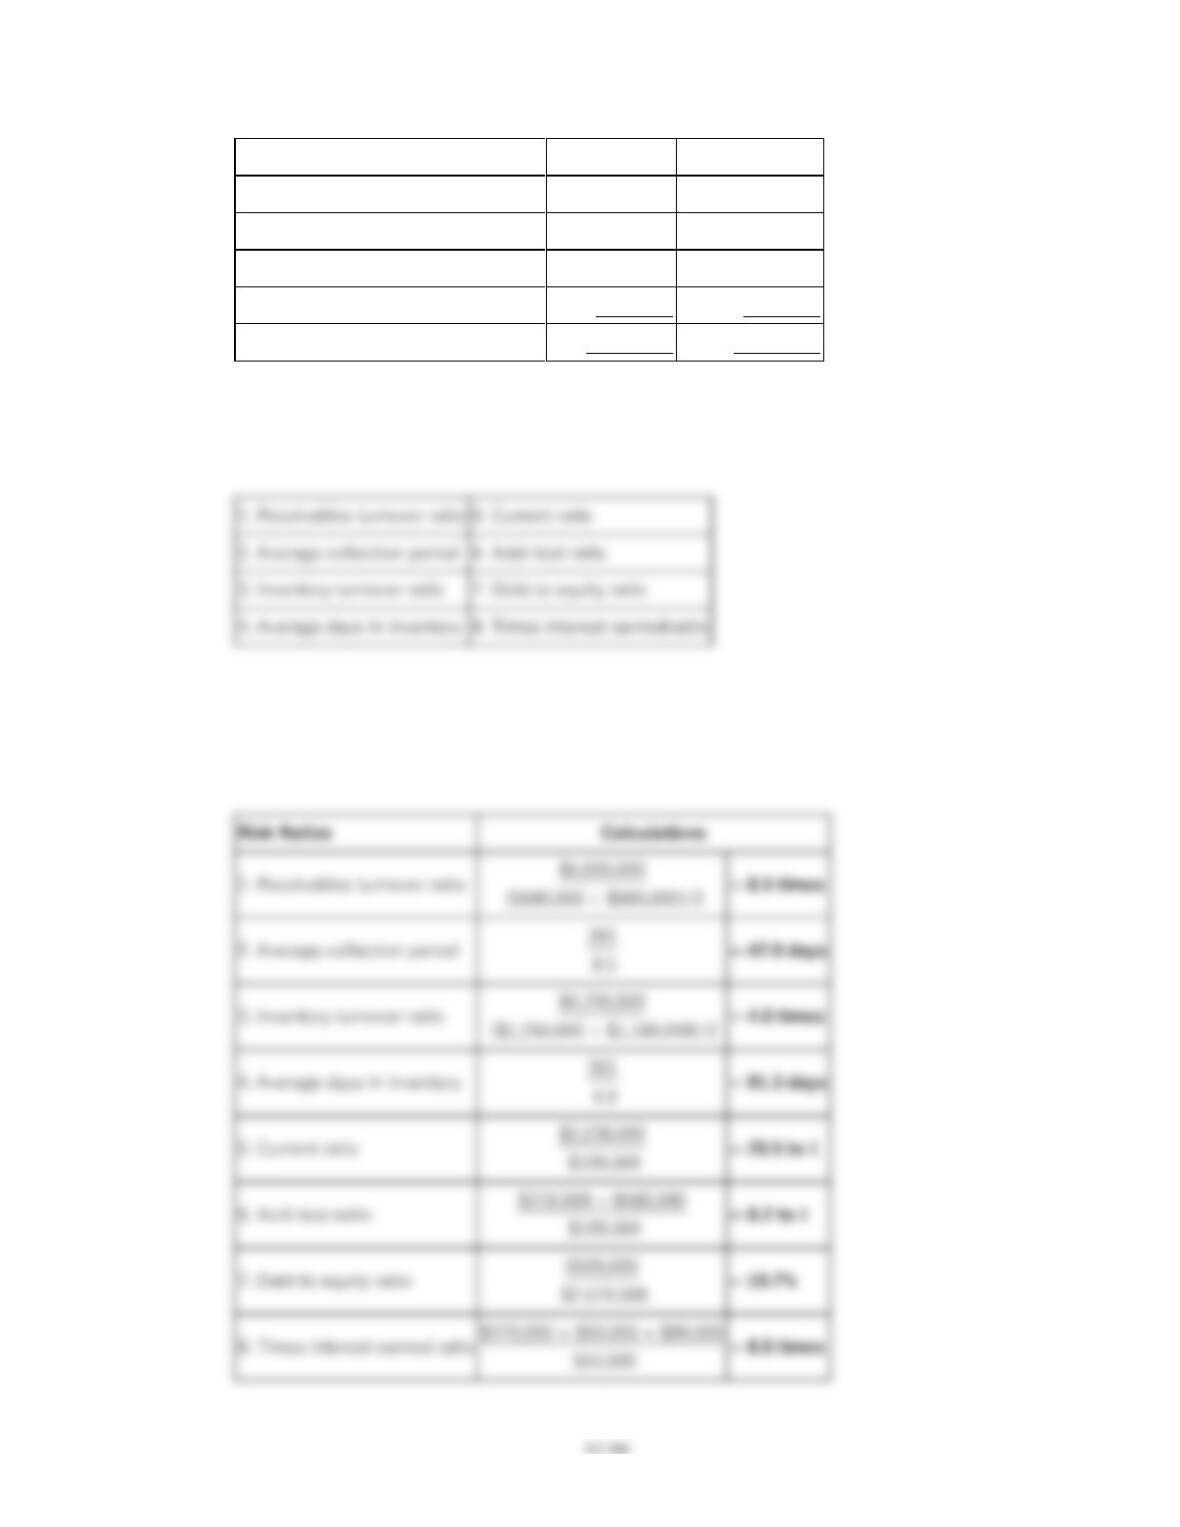
Assuming that all sales were on account, calculate the following risk ratios for 2018.
12-105
172.
Income statement and balance sheet data for The Sports Shack are provided below.
The Sports Shack
Income Statements
For the years ended December 31
2019
2018
Sales revenue
$8,200,000
$6,600,000
Cost of goods sold
6,100,000
4,700,000
Gross profit
2,100,000
1,900,000
Expenses:
Operating expenses
1,450,000
1,400,000
Depreciation expense
90,000
100,000
Interest expense
25,000
50,000
Income tax expense
95,000
80,000
Total expenses
1,660,000
1,630,000
Net income
$440,000
$270,000
The Sports Shack
Balance Sheets
December 31
Assets
2019
2018
2017
Current assets:
Cash
$290,000
$218,000
$196,000
Accounts receivable
1,050,000
680,000
880,000
Inventory
919,000
1,250,000
1,100,000
Supplies
80,000
90,000
65,000
Long-term assets:
Equipment
1,100,000
1,200,000
900,000
Accumulated
depreciation
(440,000)
(350,000)
(250,000)
Total assets
$2,999,000
$3,088,000
$2,891,000
Liabilities and Stockholders’ Equity
Current liabilities:
Accounts payable
$50,000
$65,000
$55,000
12-106
Interest payable
2,000
4,000
6,000
Income tax payable
38,000
40,000
30,000
Long-term liabilities:
Notes payable
200,000
400,000
300,000
Stockholders’ equity:
Common stock
900,000
900,000
900,000
Retained earnings
1,809,000
1,679,000
1,600,000
Total liabilities and
equity
$2,999,000
$3,088,000
$2,891,000
Required:
1. Calculate the following risk ratios for 2018 and 2019.
Receivables turnover ratio
Current ratio
Inventory turnover ratio
Debt to equity ratio
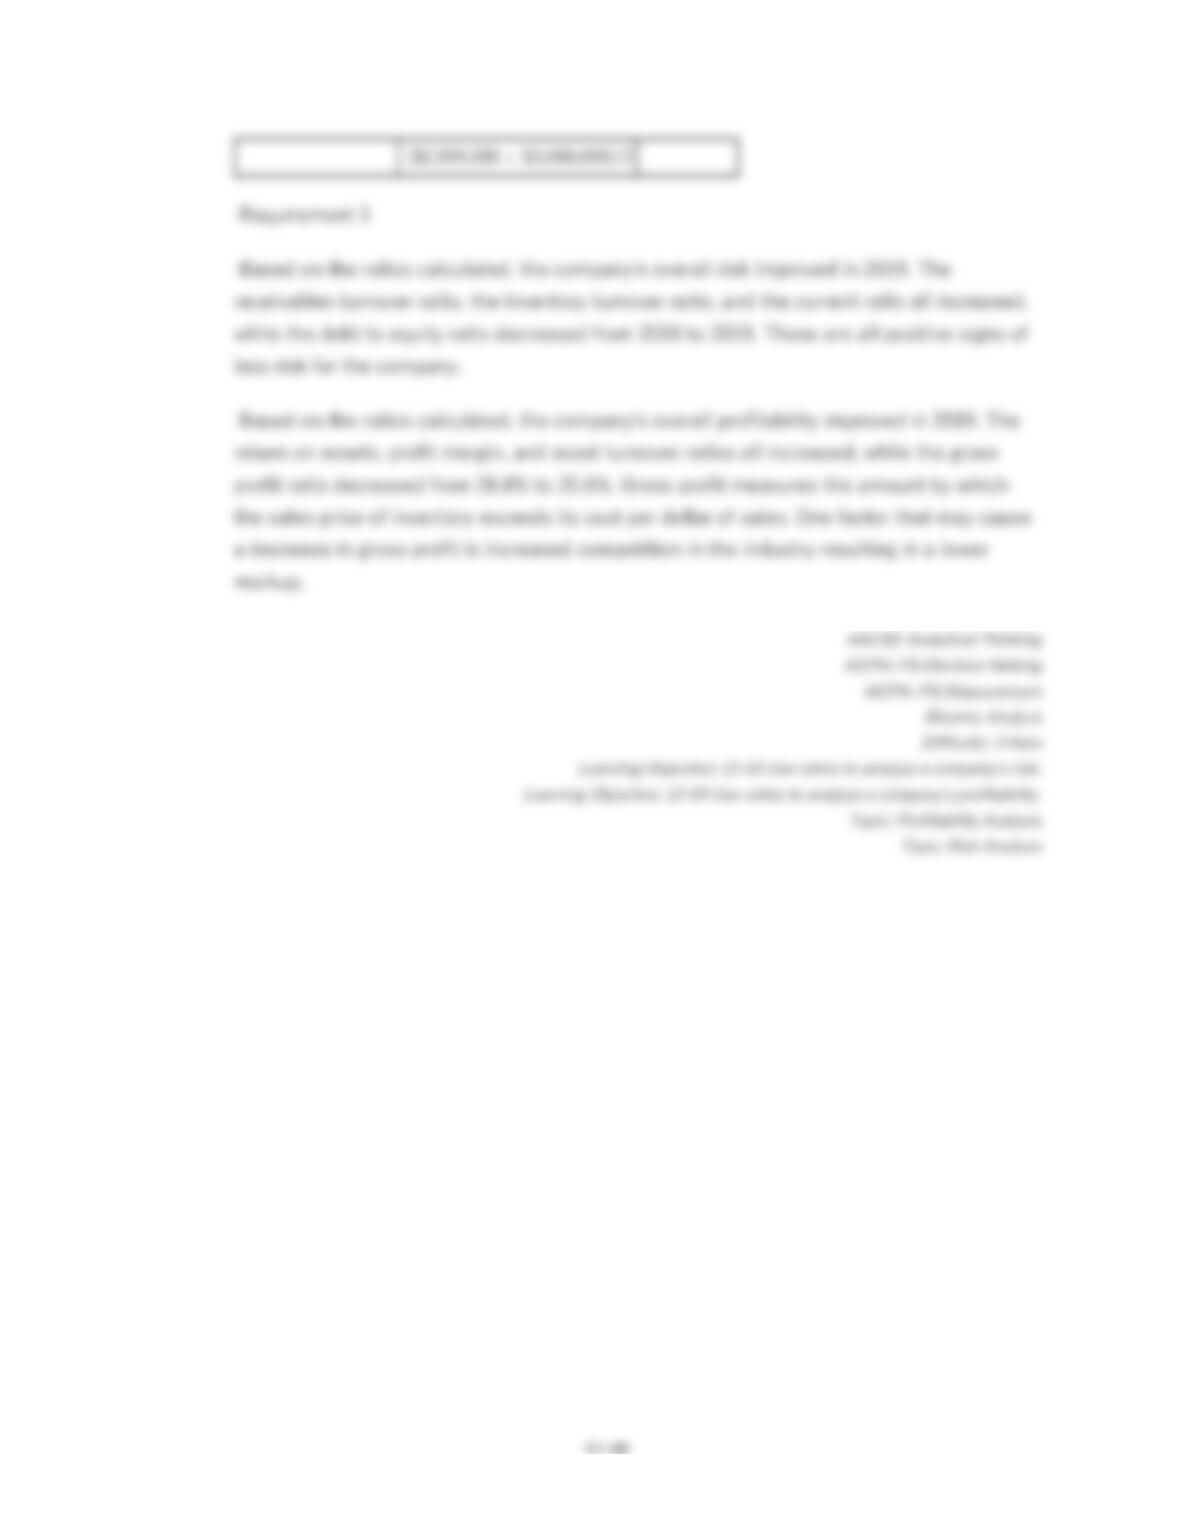
2. Calculate the following profitability ratios for 2018 and 2019.
Gross profit ratio
Profit margin
Return on assets
Asset turnover
3. Based on the ratios calculated, determine whether overall risk and profitability
improved from 2018 to 2019.
Receivables turnover ratio
12-107
173.
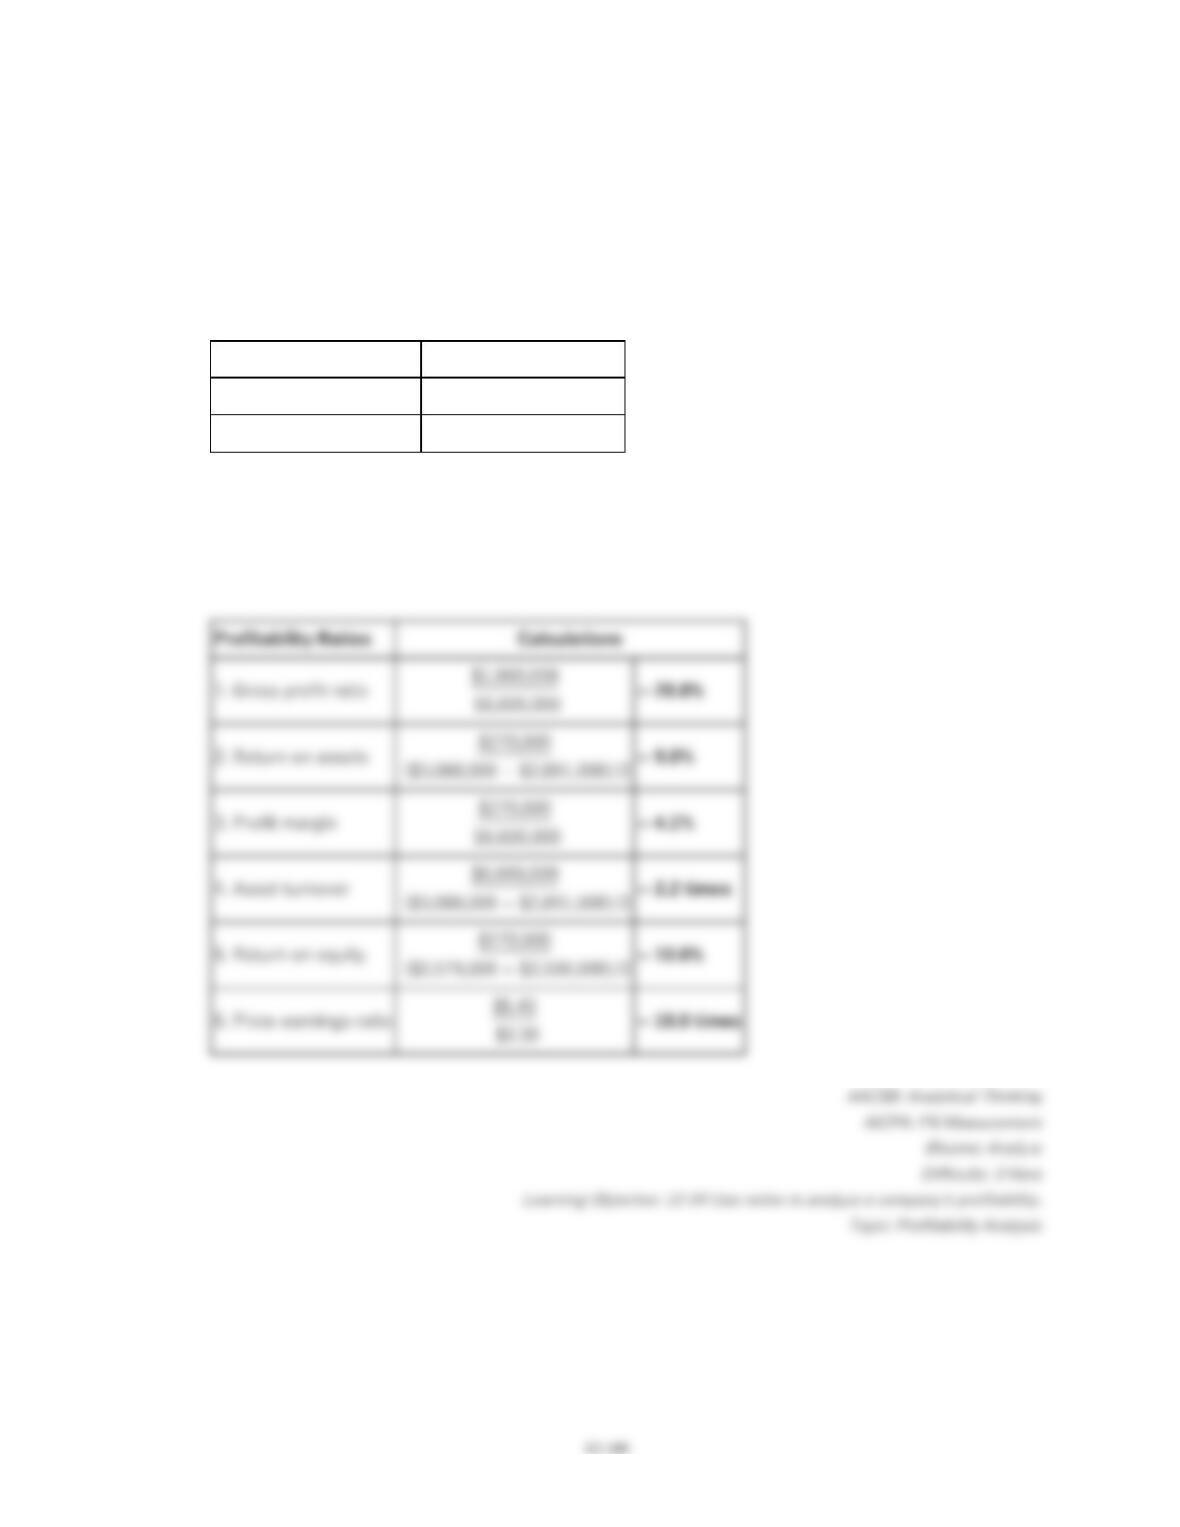
Data for The Sports Shack is provided in 172. Earnings per share for the year ended
December 31, 2018, is $0.30. The closing stock price on December 31, 2018, is $5.40.
Required:
Calculate the following profitability ratios for 2018.
1. Gross profit ratio
4. Asset turnover
2. Return on assets
5. Return on equity
3. Profit margin
6. Price-earnings ratio
($2,579,000 + $2,500,000)/2
174.
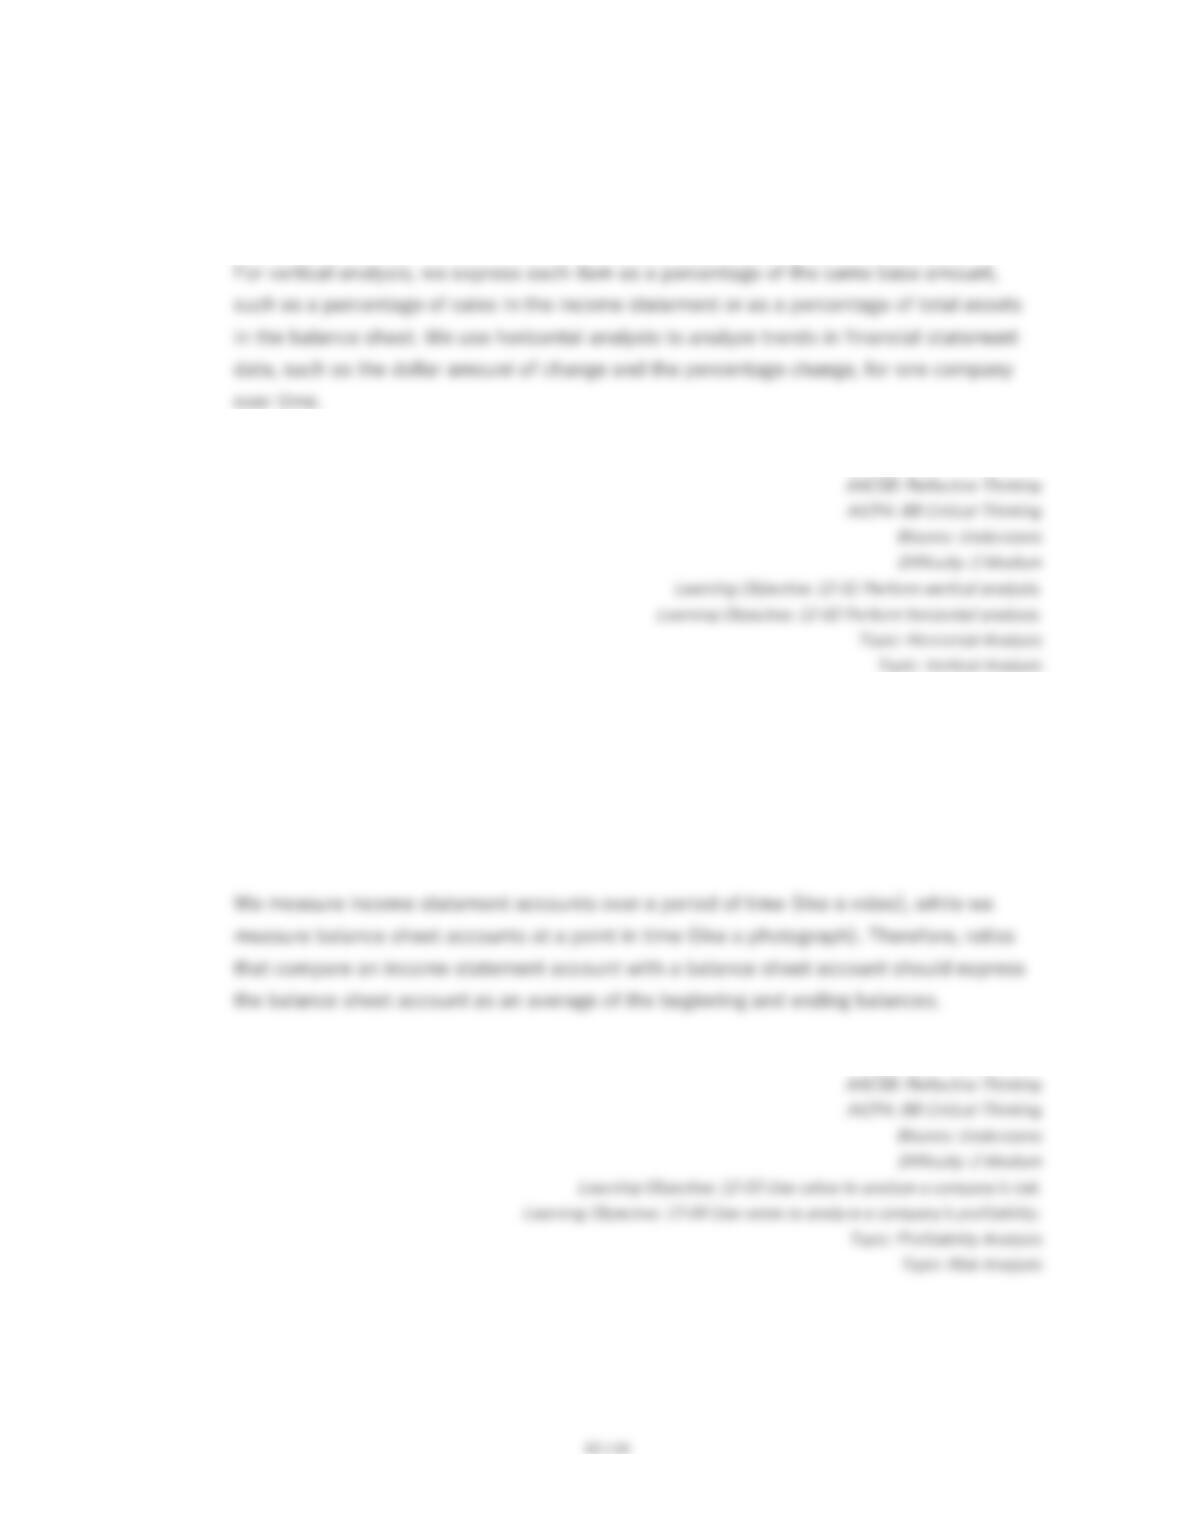
Explain the difference between vertical and horizontal analysis.
175.
Explain why ratios that compare an income statement account with a balance sheet
account should express the balance sheet account as an average of the beginning and
ending balances.
176.
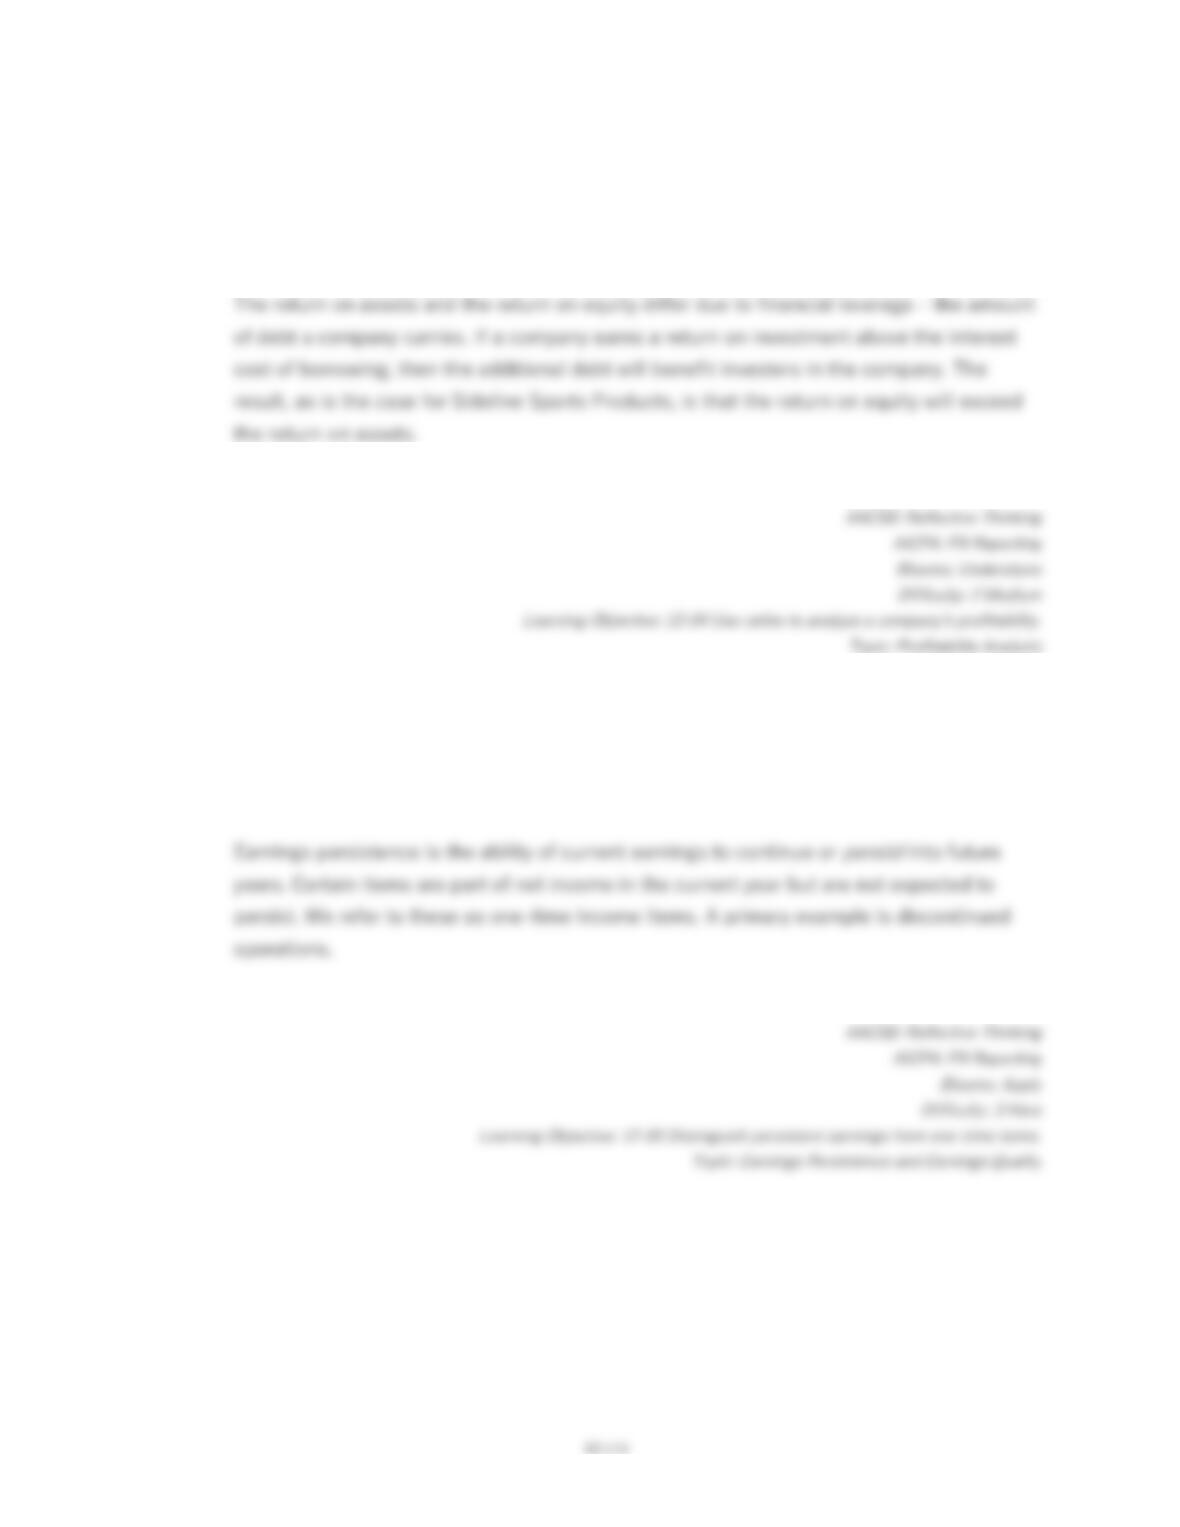
Sideline Sports Products reports a return on assets of 6%, and a return on equity of 10%.
Why do these two ratios differ?
177.
Define earnings persistence. How does earnings persistence relate to the reporting of
discontinued operations?
178.
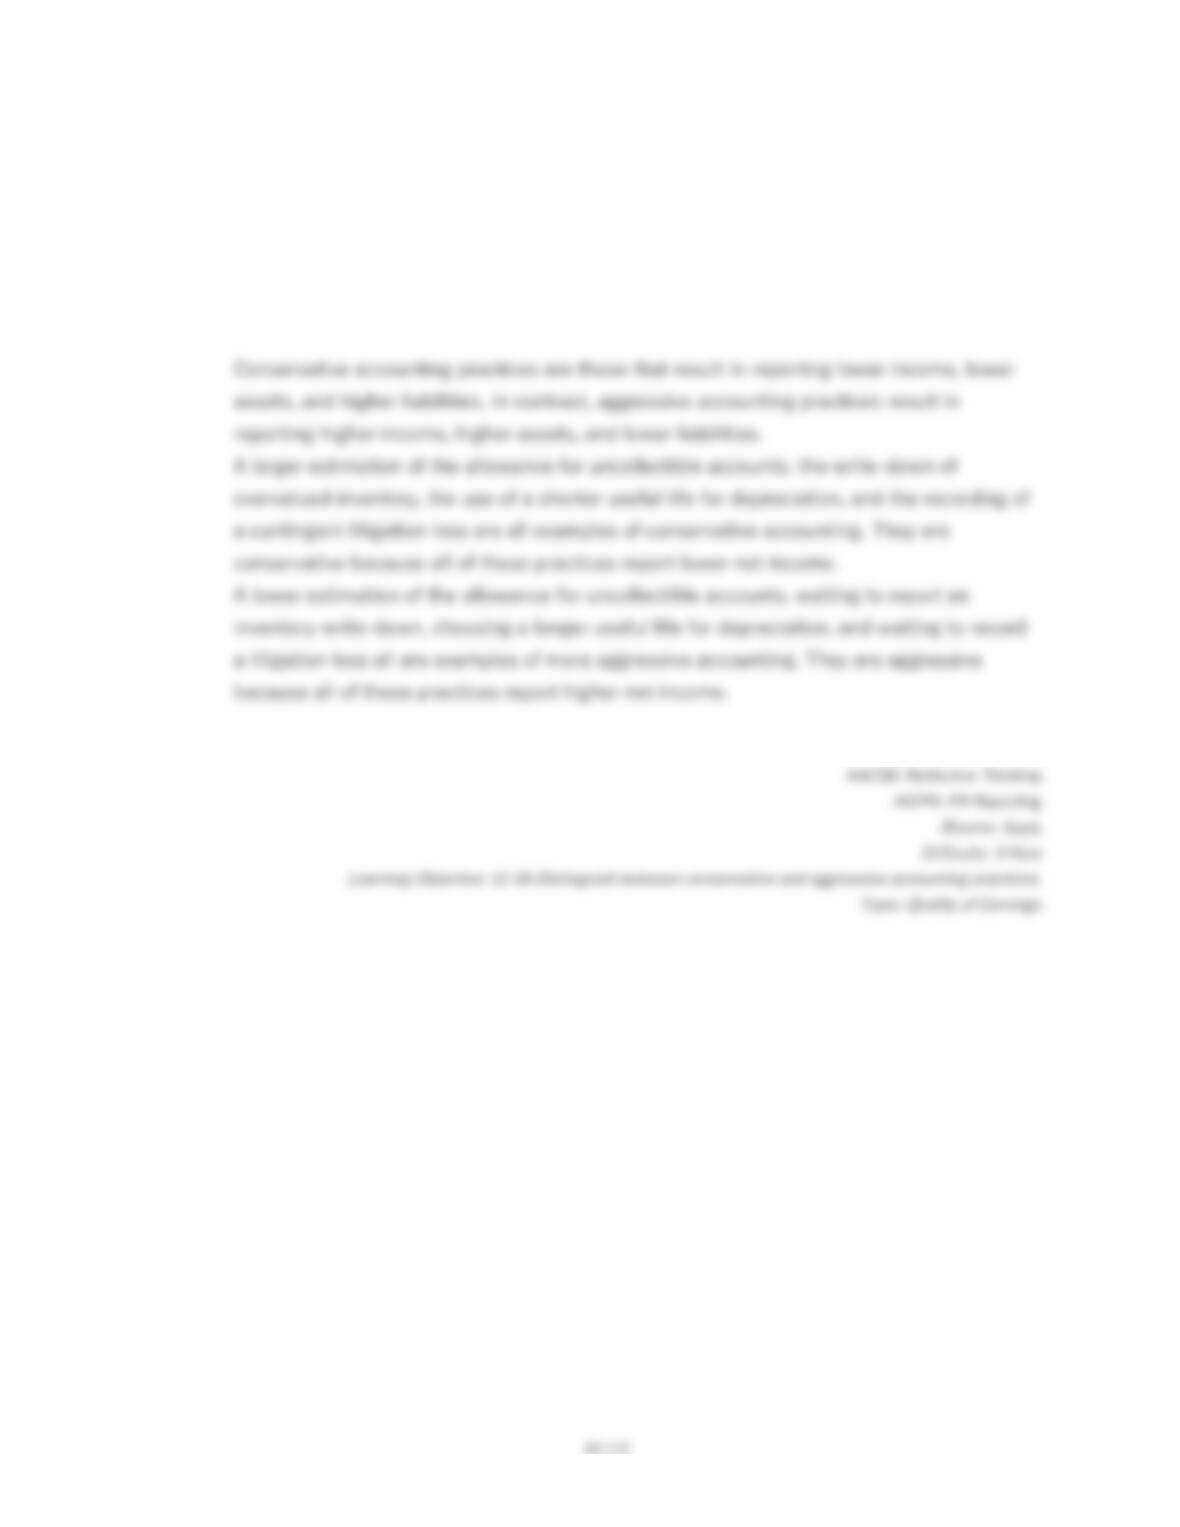
Explain the difference between conservative and aggressive accounting practices. Provide
an example of a conservative accounting practice and explain why this practice is
conservative. Provide an example of an aggressive accounting practice and explain why
this practice is aggressive.