Chapter 12
Global Performance Evaluation
Note: In the sixth edition of Global Investments, the exchange rate quotation symbols differ from previous
editions. We adopted the convention that the first currency is the quoted currency in terms of units
of the second currency.
For example, €:$ = 1.4 indicates that one euro is priced at 1.4 dollars. In previous editions we used
the reversed convention $/€ = 1.4, meaning 1.4 dollars per euro.
All problems in this test bank still use the old convention and have not been adapted to reflect the
new quotation symbols used in the 6th edition.
◼ Questions and Problems
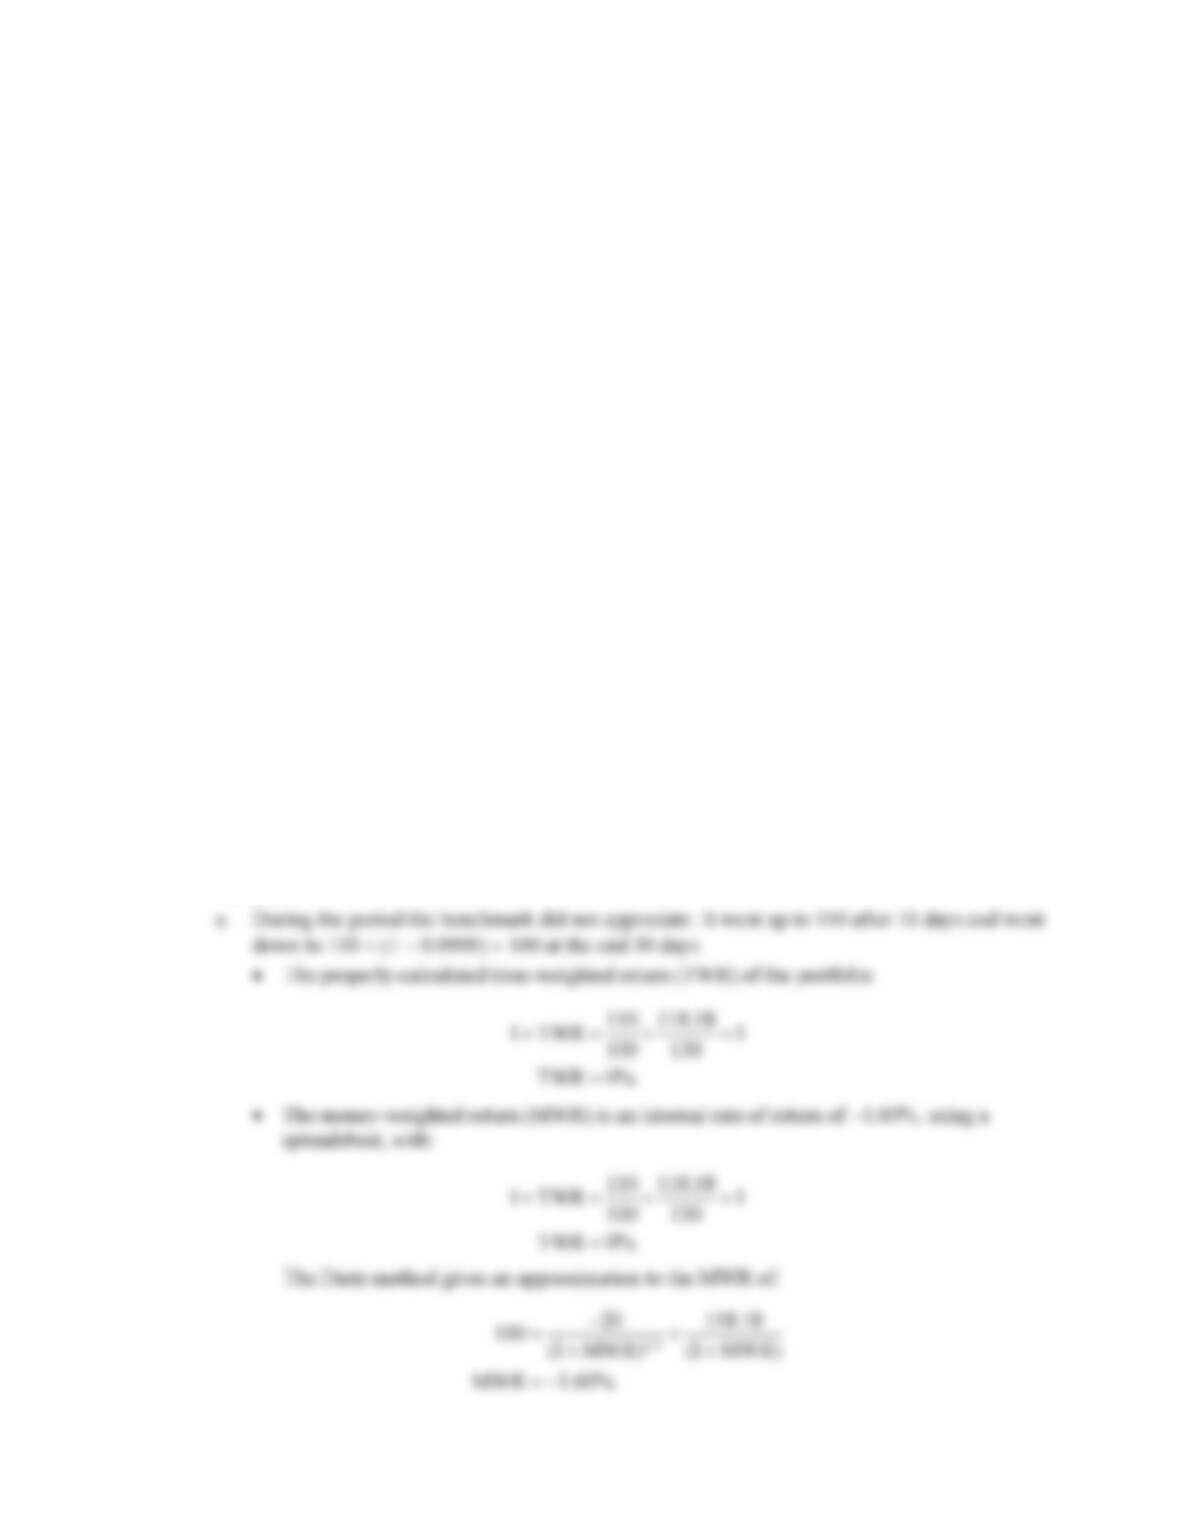
1. A client invested $100 at the start of the month. Assume that the manager tracks an assigned benchmark
index. The benchmark is at 100 at the start of the period. After 10 days the portfolio gained 10%
(value = $110), just like the index, and the client added an extra $20 (total portfolio value = $130).
From day 10 to 30, the portfolio, and the index, lost 9.09% [final portfolio value of $130
(1-0.0909) = $118.18].
a. What are the rates of returns using the various methods outlined in the text?
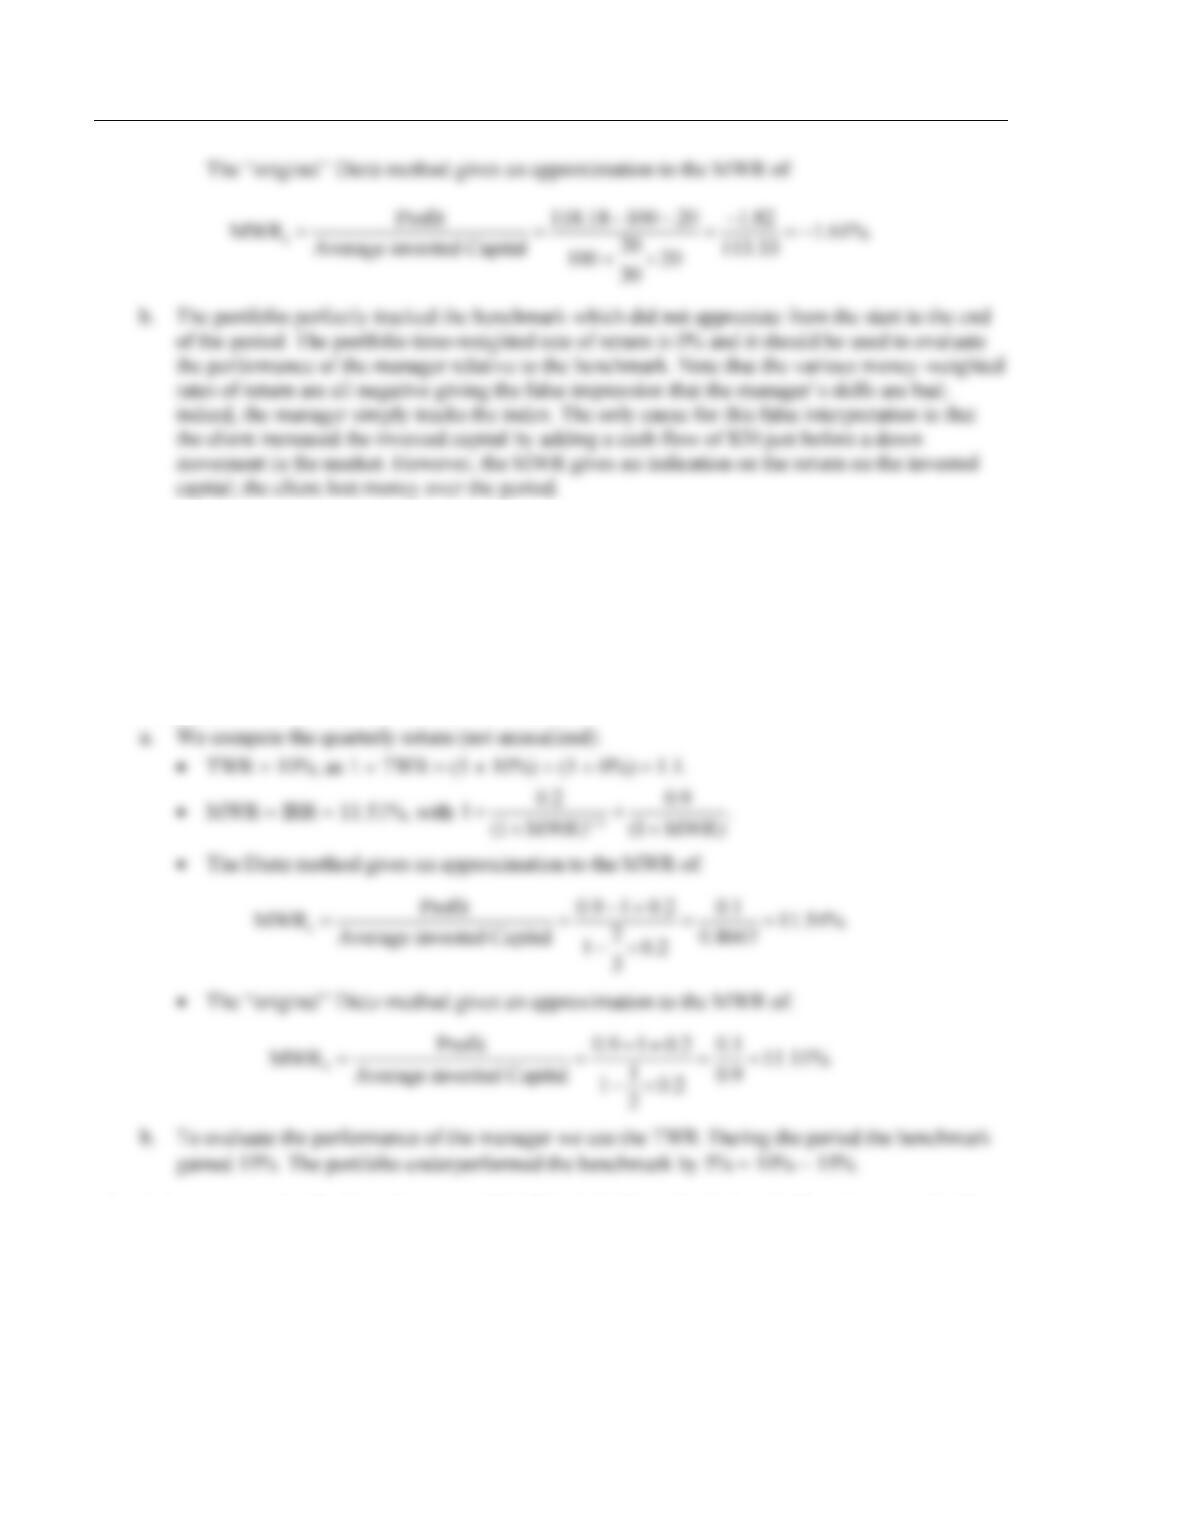
b. Which rate should you use to evaluate the performance of the manager relative to its benchmark?
Solution
170 Solnik/McLeavey • Global Investments, Sixth Edition
2. A client has €1 million invested in European equity at the start of the quarter. After one month the
portfolio value is €1.1 million and the client who needs cash withdraws €200,000. At the end of the
quarter the portfolio is worth €900,000. Over the quarter, the European equity index, used as a
benchmark, gained 15%.
a. What are the rates of returns using the various methods outlined in the text?
b. Which rate should you use to evaluate the performance of the manager relative to its benchmark?
Solution
3. A Japanese pension fund wants to invest ¥1 billion in U.S. equity. Its board of trustees must decide
whether to invest in a commingled index fund tracking the S&P index or give the money to an active
manager. The board learns that this active manager turns the portfolios over about twice a year. Given
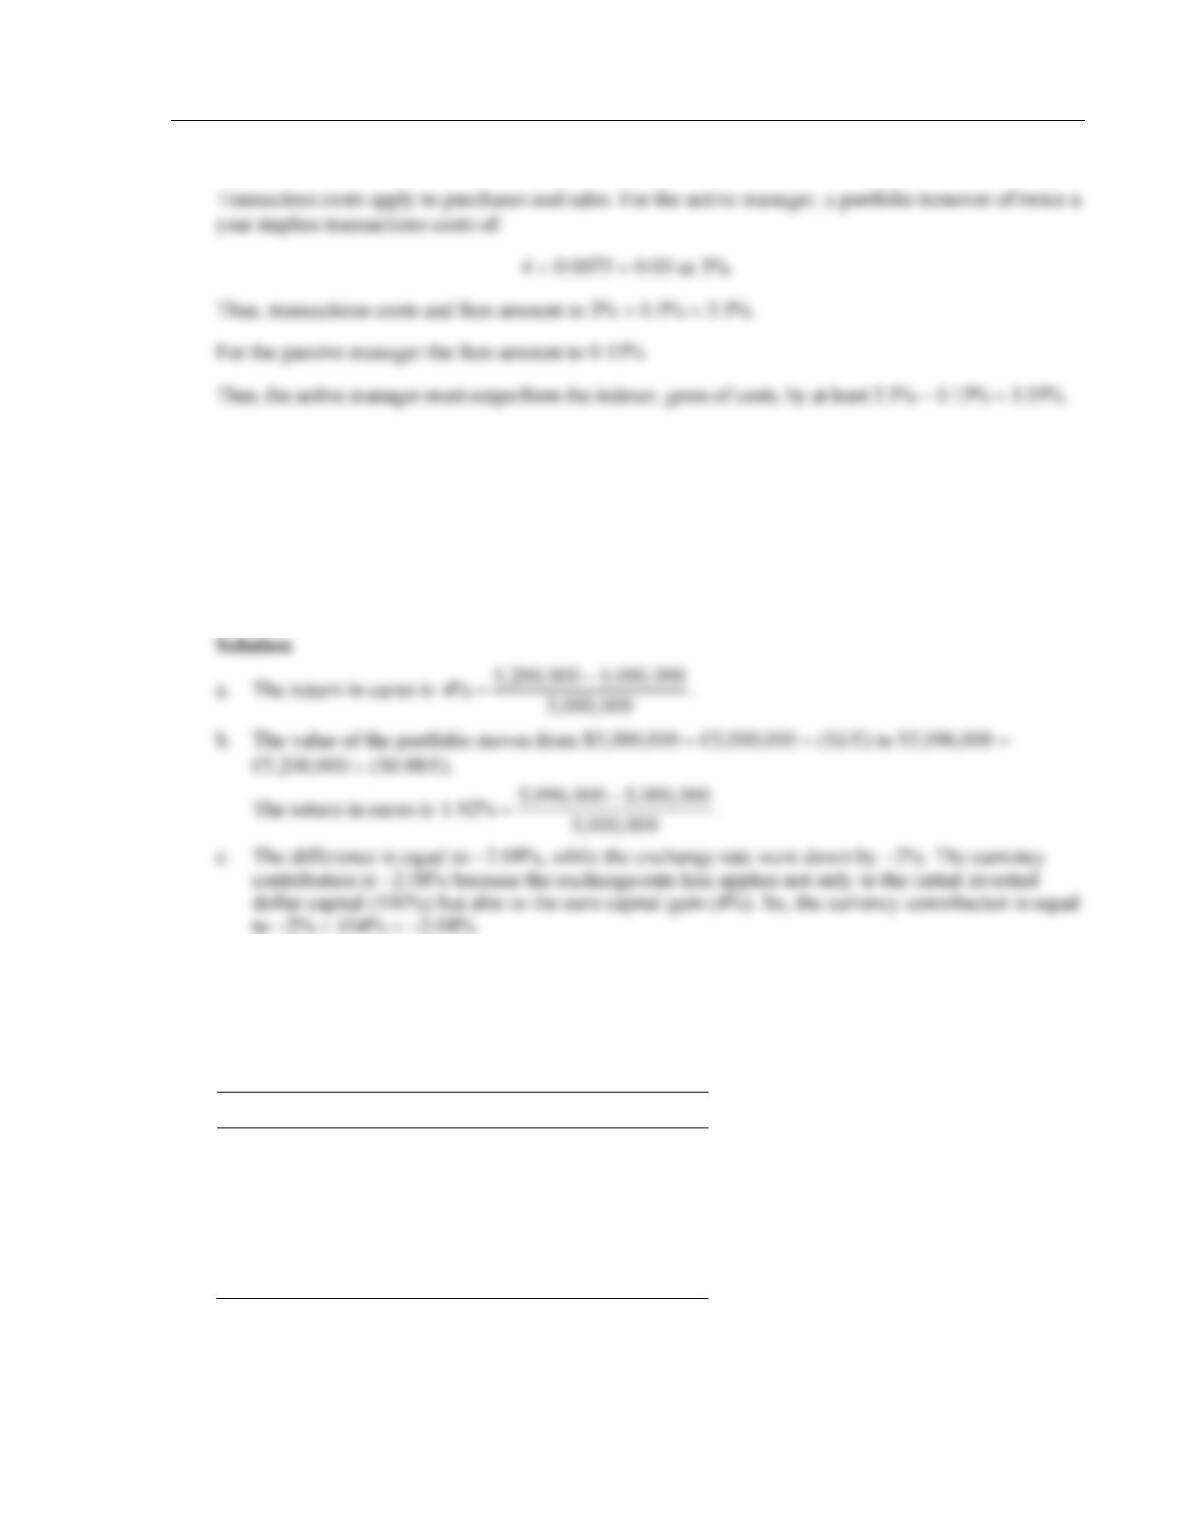
the size of the account, the overall transaction costs are likely to be an average of 0.75% of each
transaction’s value. The active manager charges 0.5% in annual management fees, and the indexer
charges 0.15%. By how much should the active manager outperform the index to cover the extra costs
in the form of fees and transaction costs on the annual turnover?
Chapter 12 Global Performance Evaluation 171
Solution
4. You are an American investor holding some German stocks. Over the month, the value of your
stock portfolio goes from €5 million to €5.2 million. The exchange rates move from $1 per euro
to $0.98 per euro.
a. What is your rate of return in euros?
b. What is your rate of return in dollars?
c. Is the difference between the dollar return and the euro return exactly equal to the percentage
movement in the exchange rate? If not, why?
5. You are a Swedish investor owning a portfolio of Swedish and American stocks. Their respective
benchmarks are the OMX index and the S&P index. There have been no movements during the year
(cash flows, sales, or purchase). Dividends of SKr 20,000 have been paid on Swedish stocks.
Valuation and performance analysis is done in Swedish krona (SKr). Here are the valuations at the
start and the end of the year:
January 1
December 31
Swedish Stocks
SKr 600,000
SKr 660,000
U.S. Stocks
$100,000
$140,000
Cash
0
SKr 20,000
Exchange Rate
6 SKr/$
5.5 SKr/$
OMX Index
100
120
S&P Index
100
125
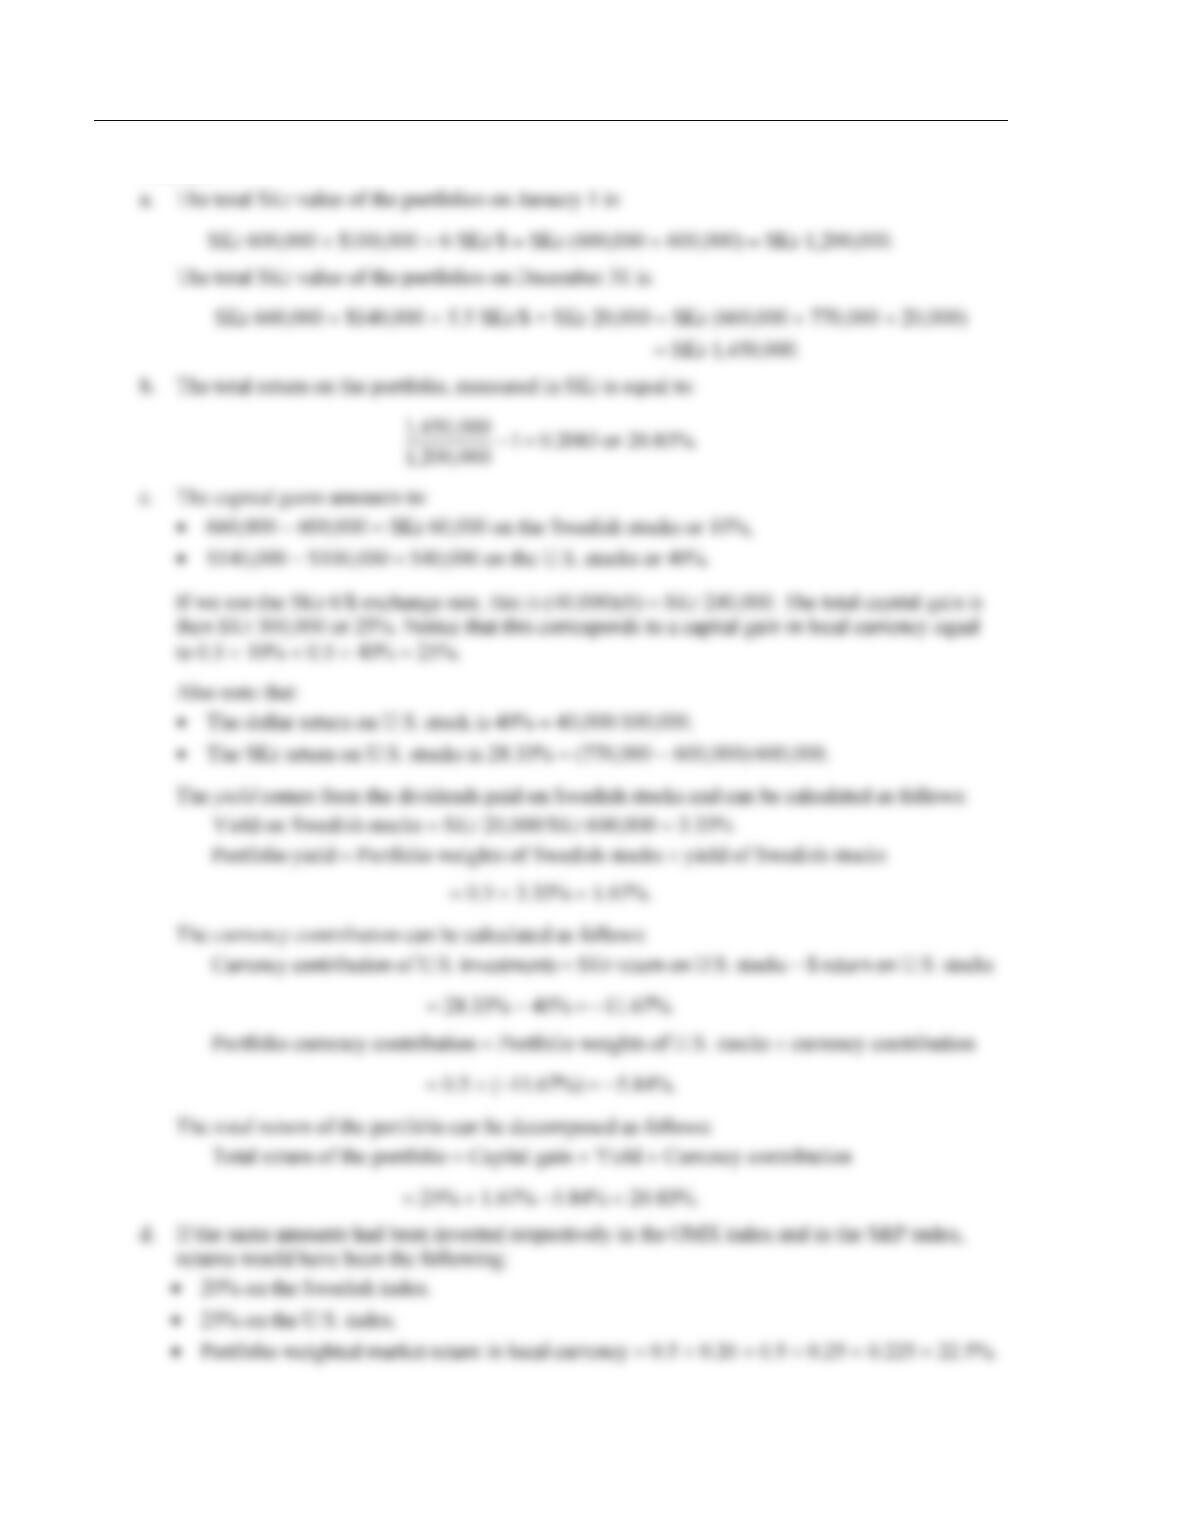
a. What is the total value of the portfolio in SKr on January 1 and on December 31?
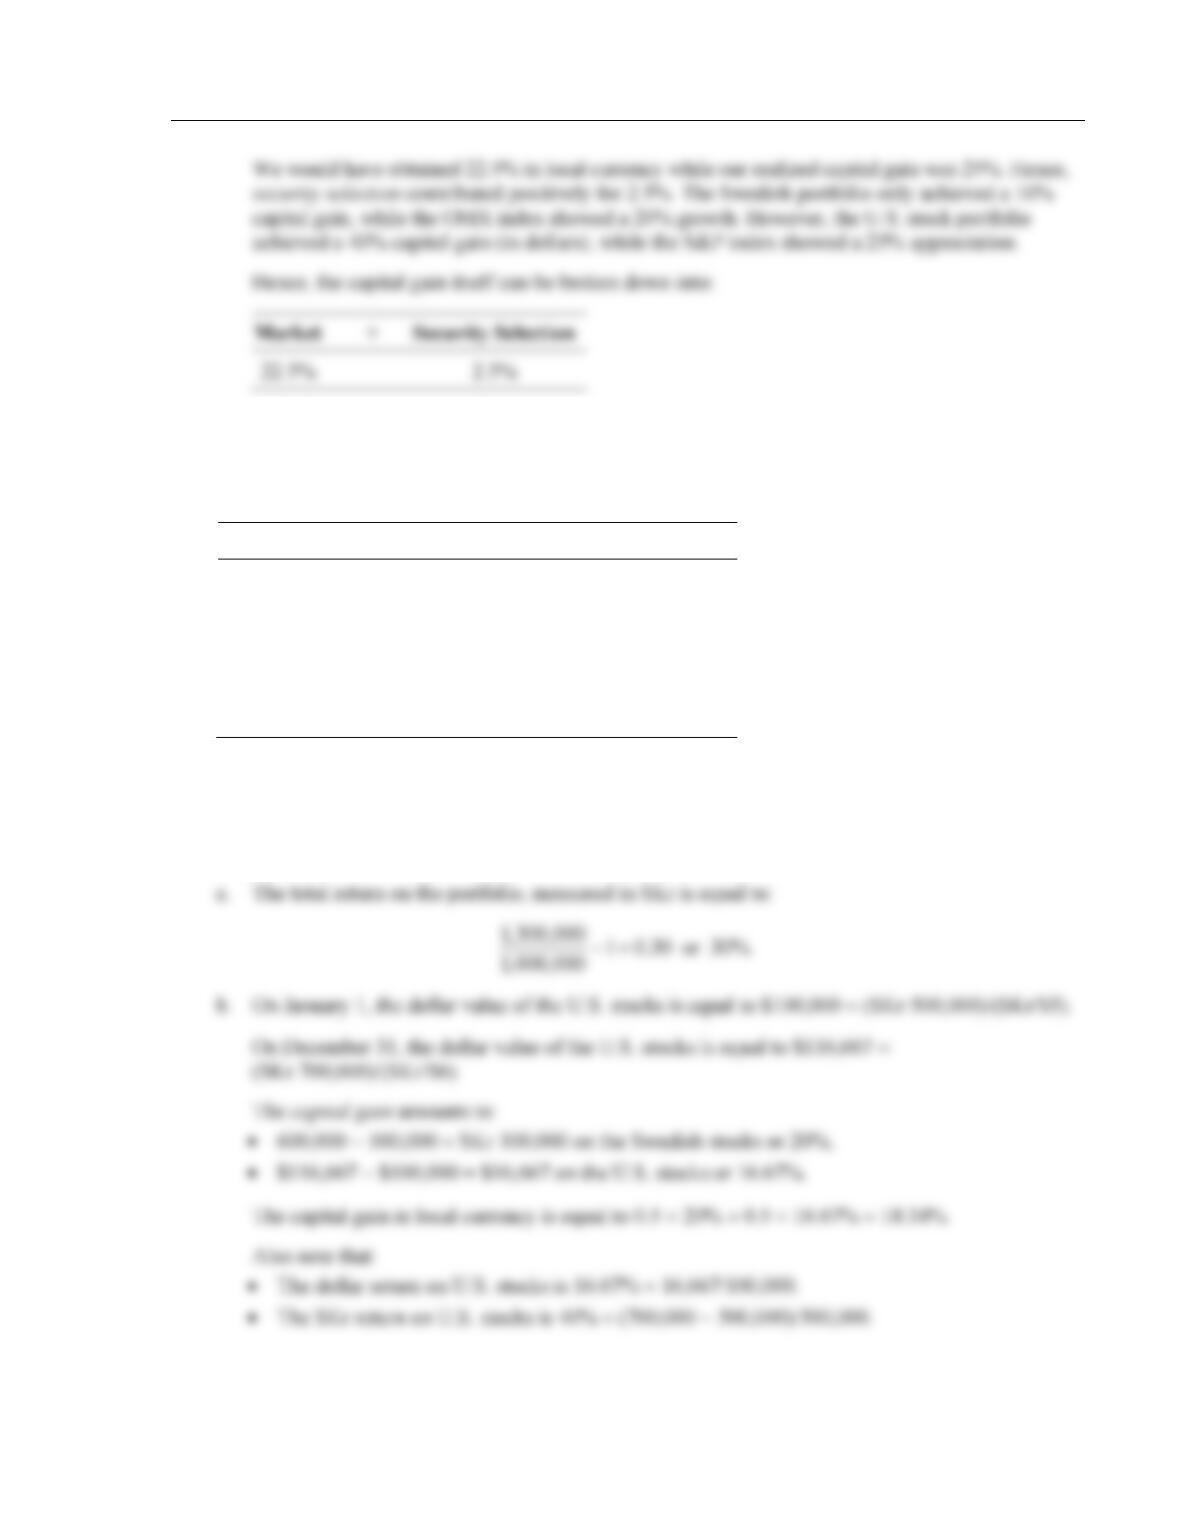
b. What is the total return on the portfolio?
c. Decompose this return into capital gain, yield, and currency contribution.
d. What is the contribution of security selection?
172 Solnik/McLeavey • Global Investments, Sixth Edition
Solution
Chapter 12 Global Performance Evaluation 173
6. You are a Swedish investor owning a portfolio of Swedish and American stocks. Their respective
benchmarks are the OMX index and the S&P index. There have been no movements during the
year (cash flows, sales, or purchases, dividends paid). Valuation and performance analysis is done in
Swedish krona (SKr). Here are the valuations at the start and the end of the year:
January 1
December 31
Swedish Stocks
SKr 500,000
SKr 600,000
U.S. Stocks
SKr 500,000
SKr 700,000
Total
SKr 1,000,000
SKr 1,300,000
Exchange Rate
5 SKr/$
6 SKr/$
OMX Index
100
120
S&P Index
100
125
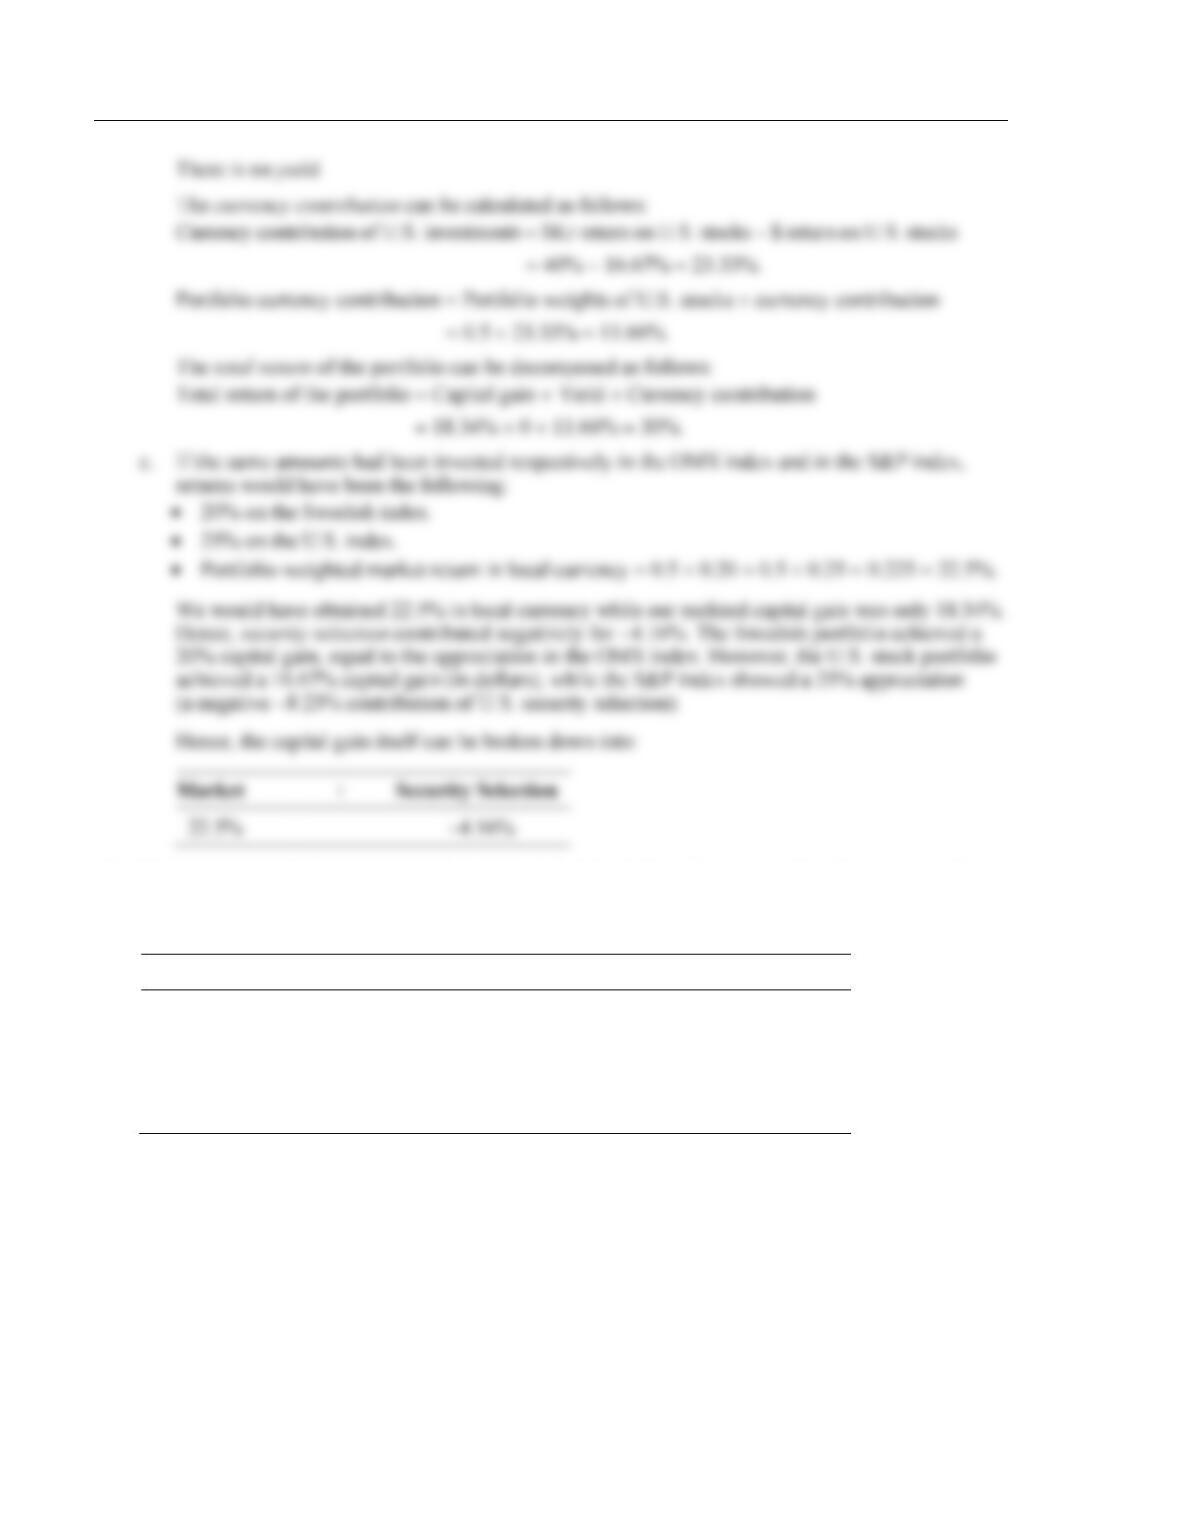
a. What is the total return on the portfolio?
b. Decompose this return into capital gain, yield, and currency contribution.
c. What is the contribution of security selection?
Solution
174 Solnik/McLeavey • Global Investments, Sixth Edition
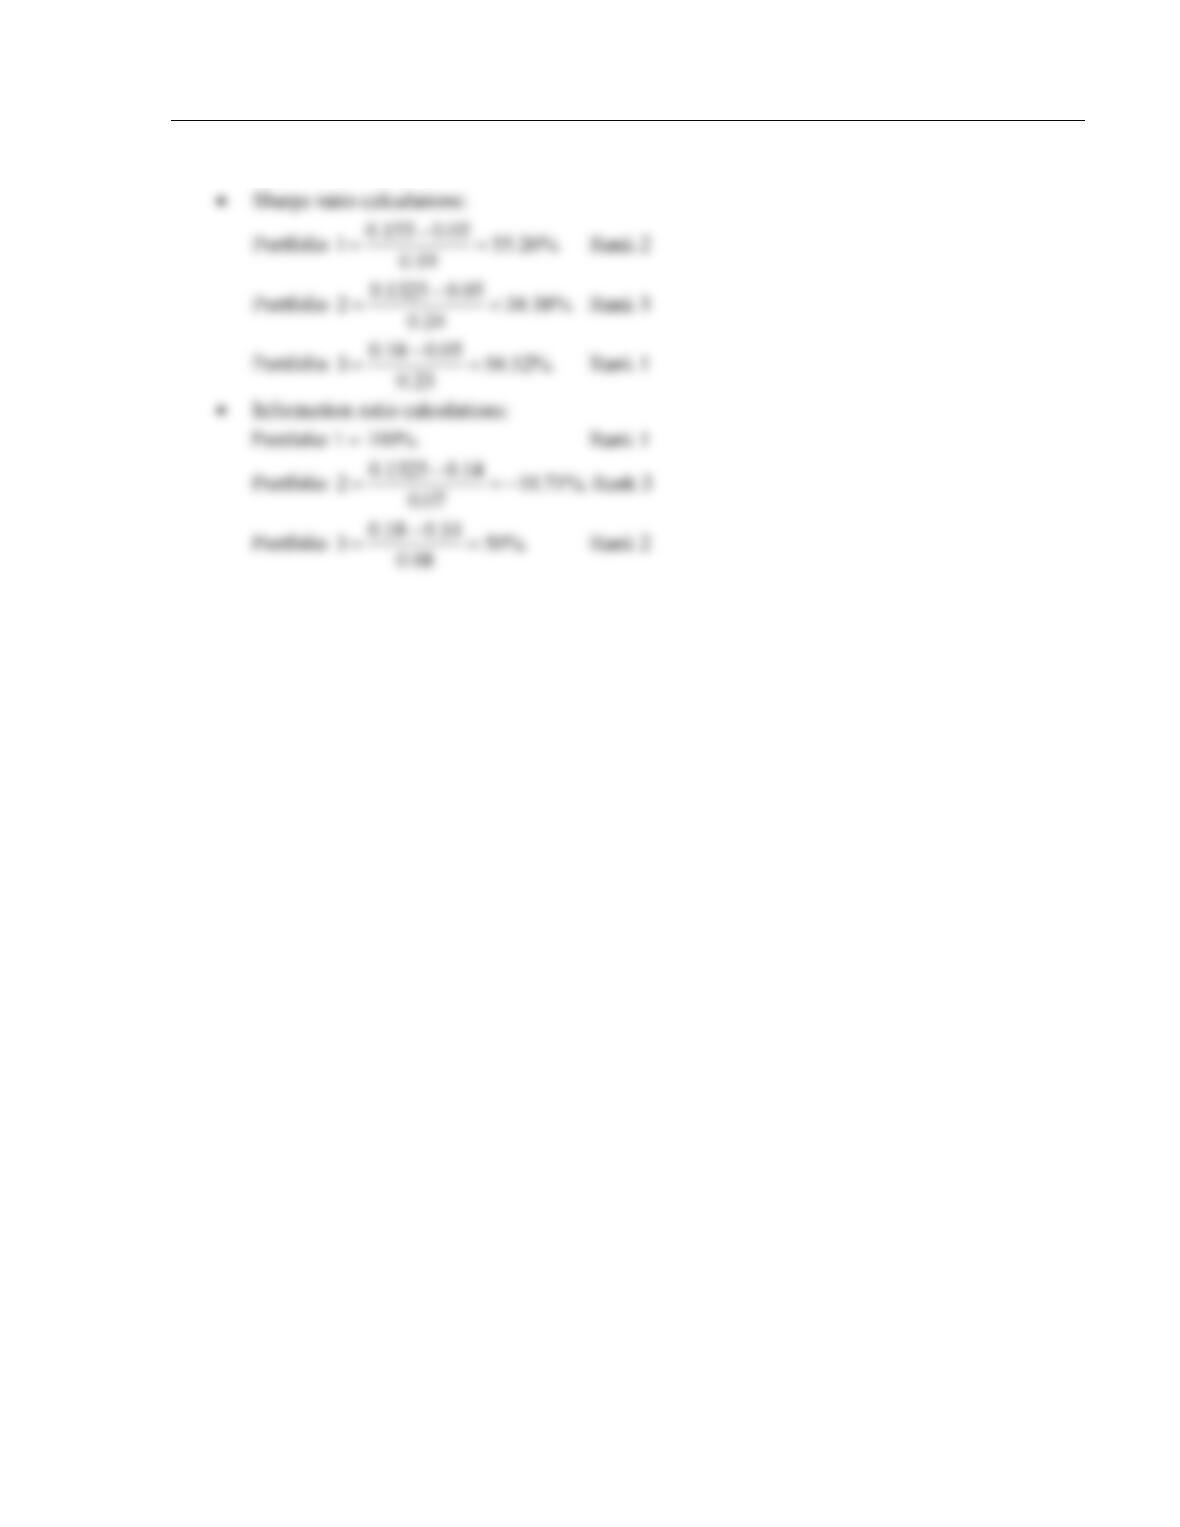
7. You are provided below with annual return, standard deviation of returns, and tracking error to the
relevant benchmark for three portfolios. Calculate the Sharpe ratio and information ratio for the three
portfolios and rank them according to each measure.
Portfolio
Return
Standard Deviation
Tracking Error
1
15.50%
19.00%
1.50%
2
13.25%
24.00%
7.00%
3
18.00%
23.00%
8.00%
Index
14.00%
20.00%
Risk-Free
5.00%
Security Selection
Chapter 12 Global Performance Evaluation 175
Solution

176 Solnik/McLeavey • Global Investments, Sixth Edition
The next three problems deal with Value at Risk, which is not detailed in this textbook. A brief summary
note on Value at Risk is given below.
Summary Note on Value at Risk (VaR)
Motivations
• A single, summary, statistical measure of possible portfolio losses resulting from “normal”
market movements.
• Losses greater than VaR are suffered only with a specified small probability.
Definition
• VaR is the loss that is expected to be exceeded with a probability x% and a holding period of
T days. VaR is specified in monetary terms (for example, dollars) not in rate of return terms.
• x is typically 1%, 2 ½%, or 5%.
• T is typically one day, one week, or one month.
Comments
If x = 1%, one assumes that only 1% of market fluctuations are “abnormal.” The maximum loss in
“normal” market conditions is therefore equal to VaR. Hence, there is a 99% chance (confidence
level = 100% –x) of losing less than VaR.
Note however that there is a 1% chance of losing more, even much more, than VaR.
From Rate of Returns to Dollars
Finance students are used to working with percentage rates of return; in other words expected
returns and standard deviations are computed on rates of returns. Value at risk works on dollar
profits and losses. The expected dollar profit is equal to the expected percentage return times the
dollar value of the position. The standard deviation of profit/loss is equal to the standard deviation
of rates of return times the dollar value of the portfolio.
Simple Relations under Normality
Assume that the distribution of returns is normal and identically independently distributed (that is,
returns are drawn from the same distribution over successive time periods and are not correlated
over time). Then:
VaR @ 5% = 1.645
– E(R).
VaR @ 1% = 2.326
– E(R.)
E(T-days Return) = T E(1-day Return).
(T-days) = T
(1-day).
If the expected return is small:
Note that the expected value is multiplied by T while the standard deviation only by T.
VaR(T-days) T VaR(1-day).
Chapter 12 Global Performance Evaluation 177
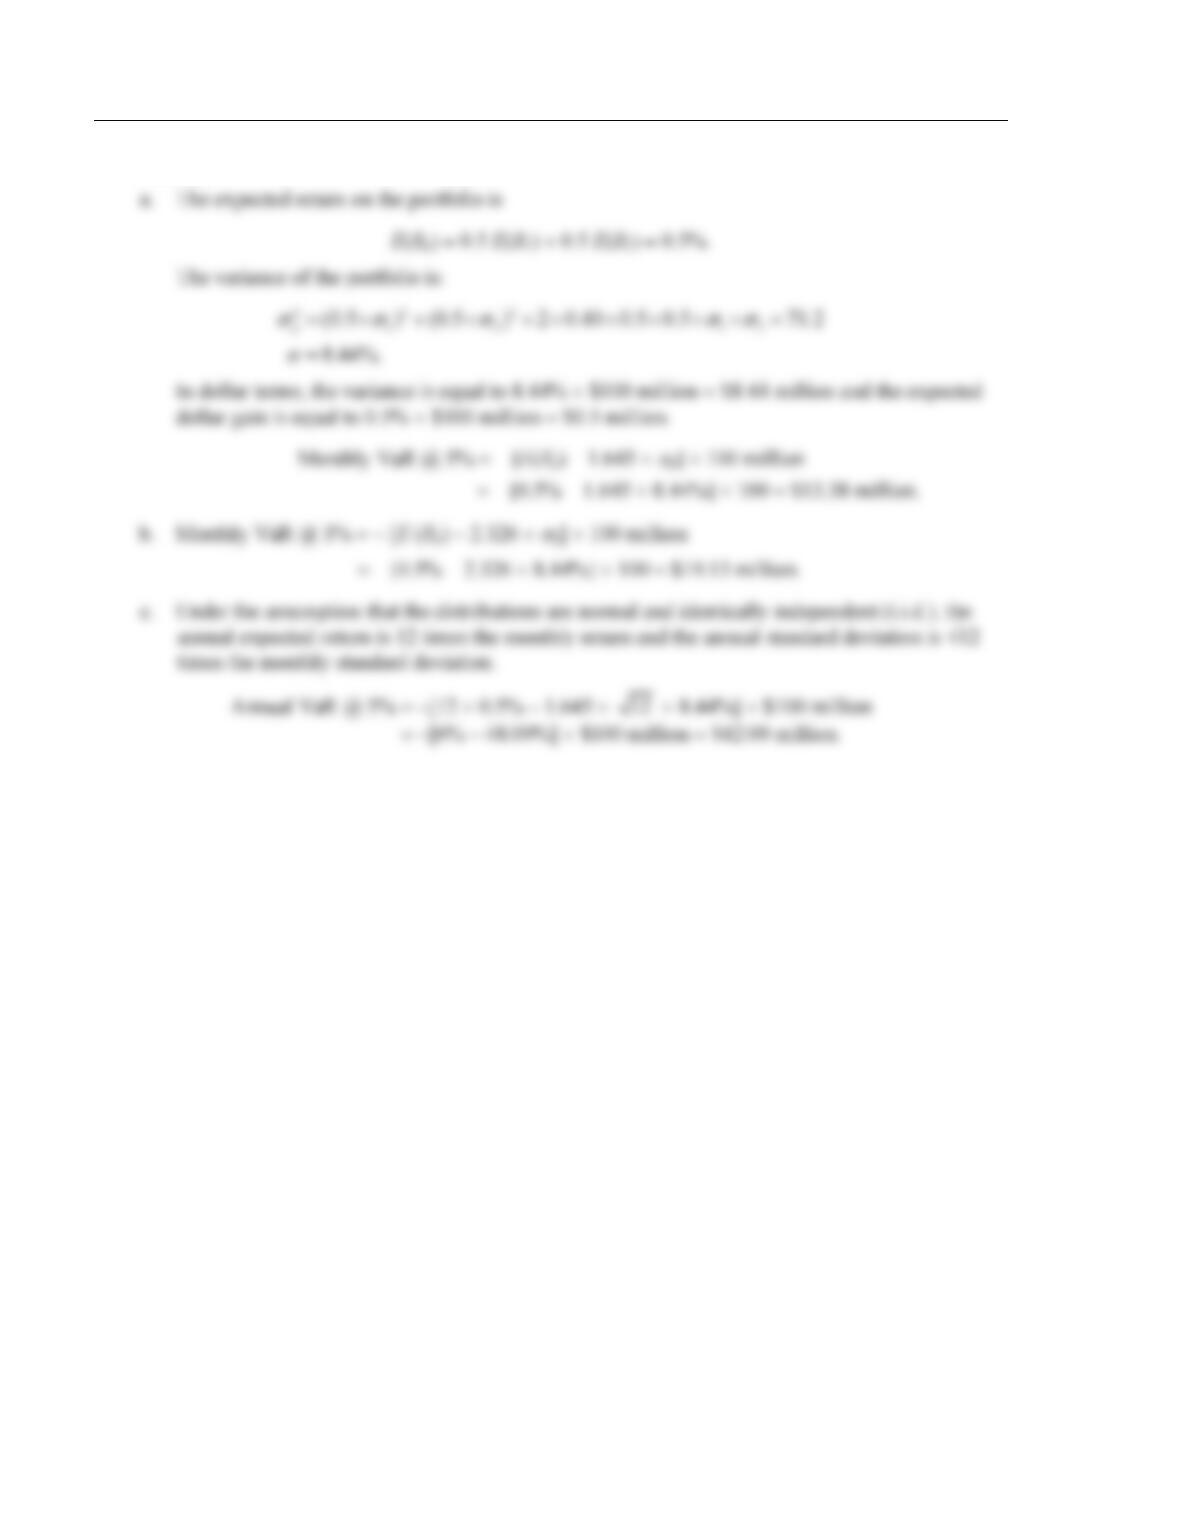
8. You have to compute the VaR (Value at Risk) of a portfolio with a probability of 5% (confidence
level of 95%). Your portfolio is worth $100 million evenly invested in two assets (50 million in asset
1 and 50 million in asset 2). Here are some statistics for monthly returns of the two assets:
E(R1) = E(R2) = 0%
(R1) = 5%
(R2) = 7%
Correlation = 0.5.
You make the hypothesis that the distributions are normal.
You know that in a normal distribution 5% of the observations lie below –1.645
.
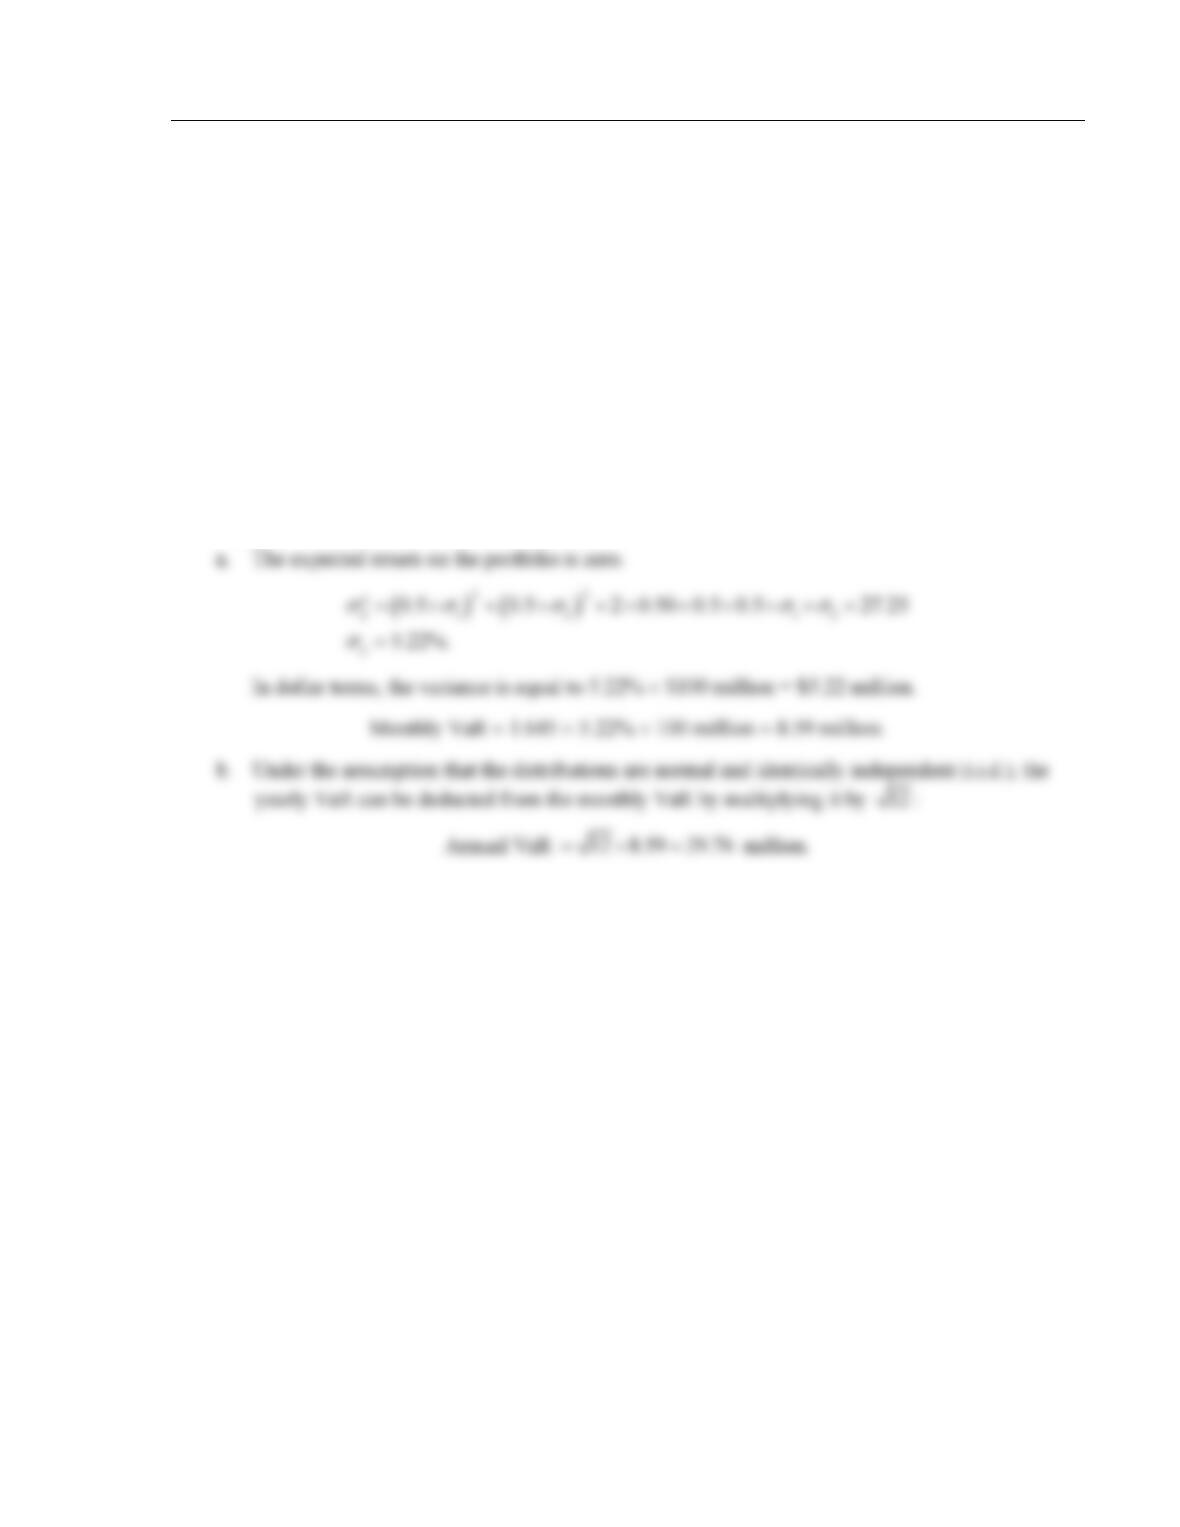
a. What is the monthly VaR of the portfolio with a 5% probability?
b. What is the one-year VaR of the portfolio with a 5% probability?
Solution
9. You have to compute the VaR of a portfolio with a probability of 5% and 1% (confidence level of
95% and 99%). Your portfolio is worth $100 million evenly invested in two assets ($50 million in
asset 1 and $50 million in asset 2). Here are some statistics for monthly returns of the two assets:
E(R1) = E(R2) = 0.5%
(R1) = 8%
(R2) = 12%
Correlation = 0.4.
You make the hypothesis that the distributions are normal. We know that in a normal distribution
with expected return E(R) and standard deviation
, 5% of the observations lie below [E(R) – 1.645
]
and 1% of the observations lie below [E(R) – 2.326
].
a. What is the one-month VaR of the portfolio with a 5% probability?
b. What is the one-month VaR of the portfolio with a 1% probability?
c. What is the one-year VaR of the portfolio with a 5% probability?
178 Solnik/McLeavey • Global Investments, Sixth Edition
Solution
10. On December 31, 1997, Long-Term Capital Management L.P. (“LTCM” or “Management
Company”) distributed approximately $2.7 billion of capital to investors in the fund that LTCM
managed. Following a high return for 1997 (25.3% gross of fees and 17.1% net of fees) the fund’s
NAV (Net Asset Value) had swelled to $7.5 billion, and the share of the fund held by LTCM
principals and employees had grown to $1.9 billion.
LTCM had notified investors in September, 1997 that it would be reducing investor capital in the
fund at year-end. In a letter to investors, LTCM explained that it had decided to return to “non–
strategic” investors the capital that was contributed between 1995 and 1997. The firm explained its
reasoning in a letter to shareholders dated:
“As previously reported, the Fund has for some time been closed to new investment from non-
Management Company investors with the exception of compelling cases of strategic value that
would accrue from additional investment. From inception, the Fund has implemented its
investment strategies subject to a constraint on its level of risk and subject to the requirement of
maintaining adequate liquidity capital. The Management Company believes that these two
constraints are not binding currently and the Fund has excess capital. This has occurred,
primarily, because of a substantial increase in the capital base from the larger–than-expected, past
realized rates of return, and high reinvestment rates elected by the Fund’s investors. Therefore, it
has become necessary to reduce the amount of capital significantly to bring the Fund’s capital
base more in line with its risk and liquidity needs.”
The fund had set a risk target of an annual standard deviation (sigma) of NAV equal to 20% of NAV
(approximately that of a U.S. stock portfolio). The expected profit (increase in NAV) for 1998 is
$750 million (a daily expected profit of $3 million multiplied by 250 trading days per year).
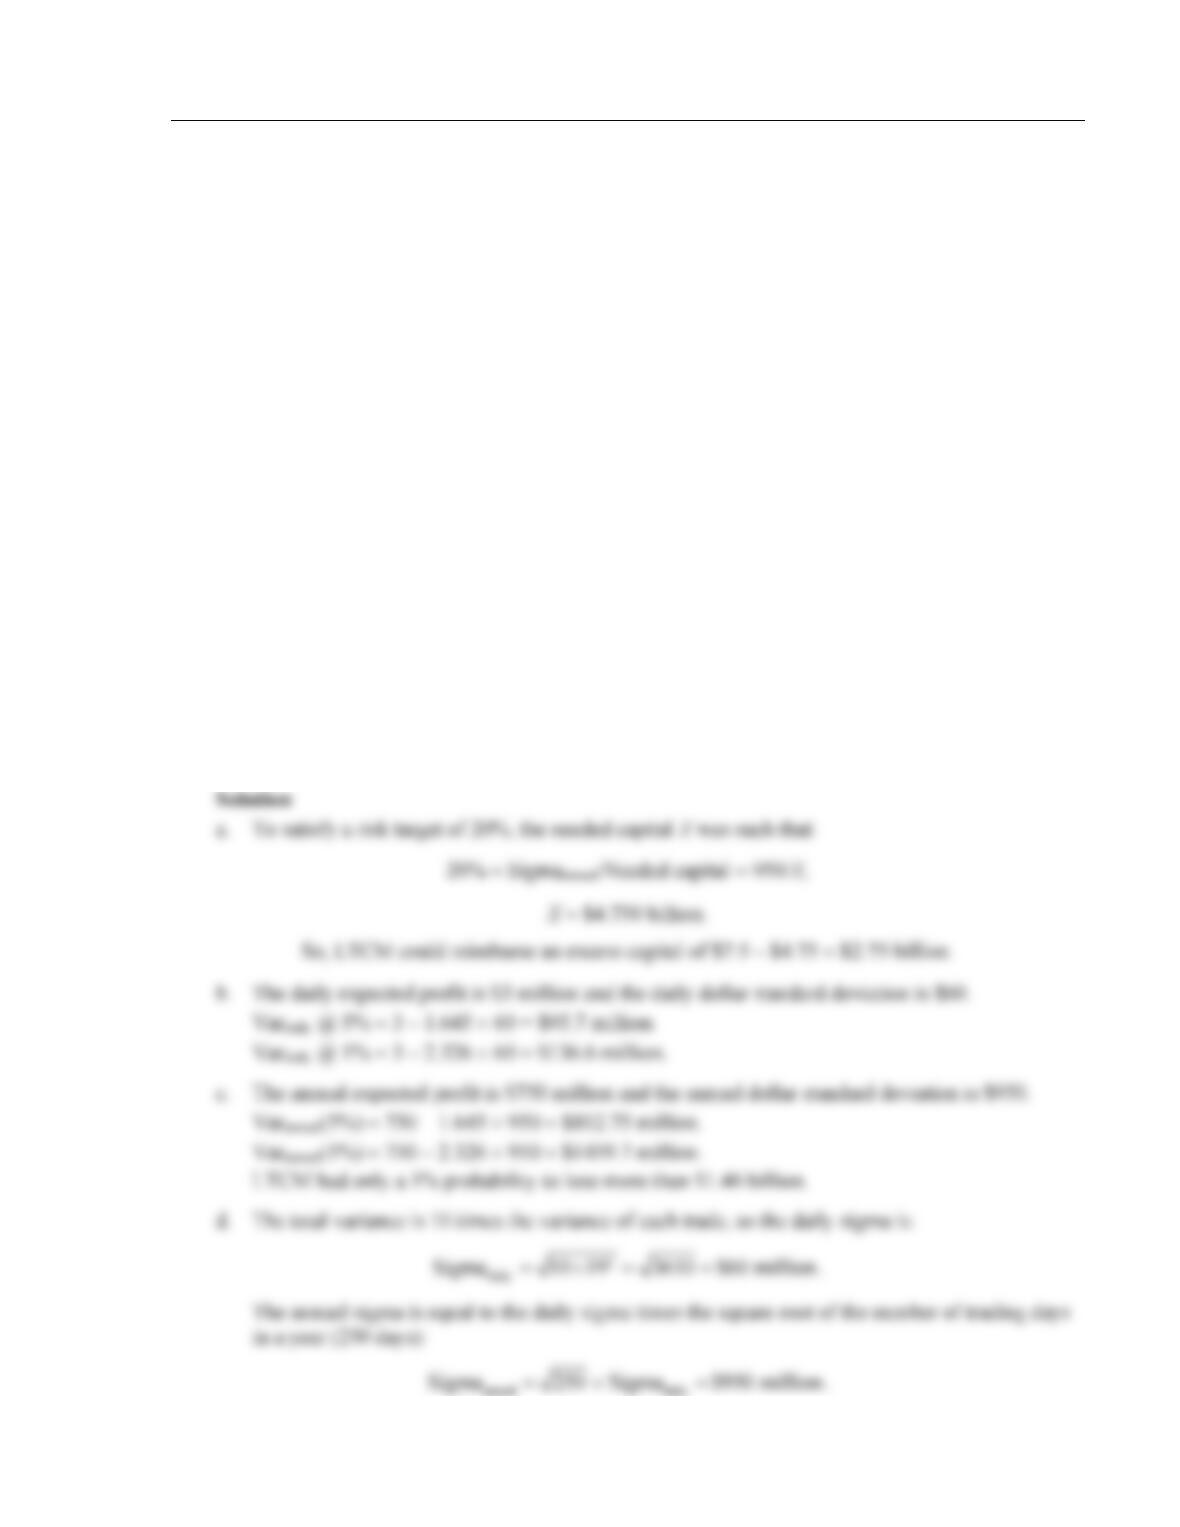
Chapter 12 Global Performance Evaluation 179
Looking back, the daily sigma of NAV was $45 million, which translated in an annual sigma of
$710 million. This figure was estimated over past daily movements in NAV. The annual sigma is
computed by multiplying the daily sigma by the square root of the number of trading days in a year
(approximately 250 trading days). The mathematical arbitrage models used give a slightly higher
theoretical figure equal to a daily sigma of $60 million, or annual sigma of $950 million. So the
annual risk was well below the target of 20%. The empirical measure was less than 10% of NAV
(710/7500) and the theoretical measure was 12.8% (950/7500). Because new arbitrage opportunities
were hard to find, it was decided to get back to the risk target on NAV by reducing the capital base
rather than expanding the arbitrage portfolio.
a. How much capital could LTCM reimburse to satisfy its 20% risk target (use the data from the
mathematical arbitrage model)?
LTCM did calculate VaR. You will base your calculation on the theoretical sigma measures (daily
sigma of $60 and annual sigma of $950). Remember that in a normal distribution, there is 5/100
chances to be below E(R) – 1.645
, where E(R) is the expected value and
is the sigma. There is
1/100 chances to be below E(R) – 2.326
and 1/1000 chances to be below E(R) – 3.10
.
b. What is the daily VaR at 5% and 1%?
c. What is the annual VaR at 5% and 1%? Interpret your results.
d. Assume that the portfolio of LTCM is made up of 10 arbitrages, which each have a daily sigma
of $19 million. They are all uncorrelated. What is the daily sigma for the fund?
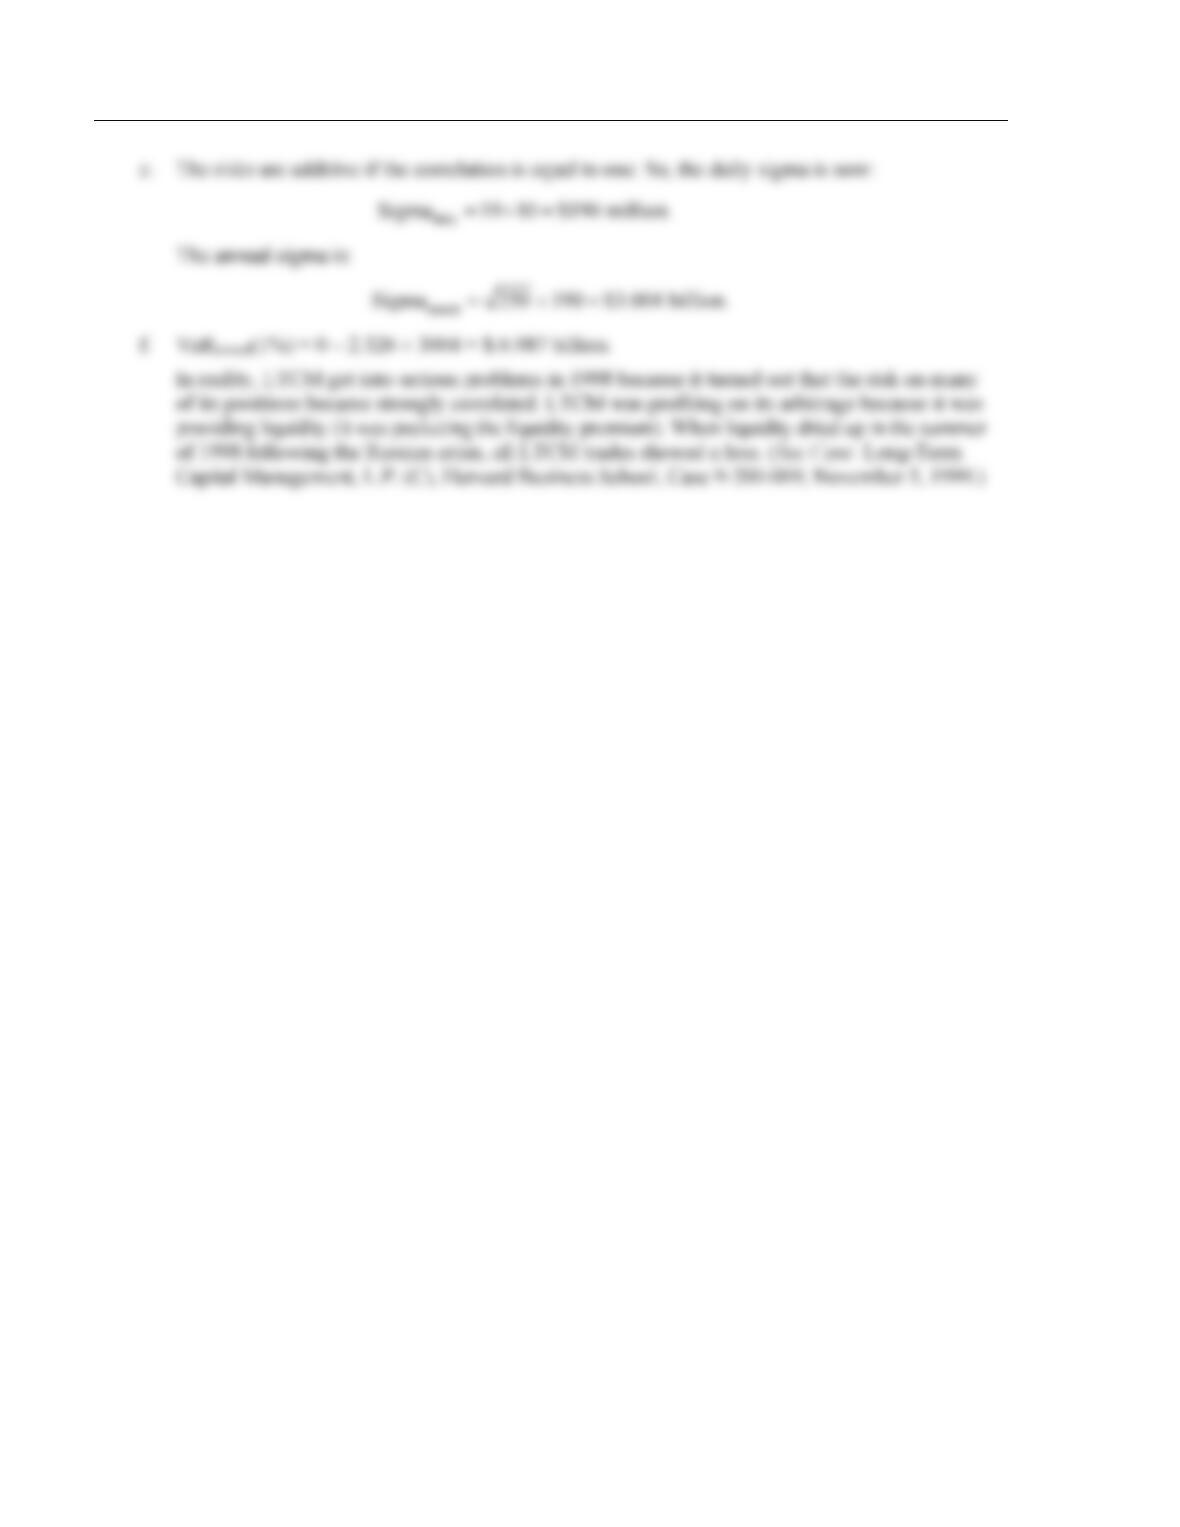
e. It turns out that in periods of crisis the return on all arbitrages are perfectly correlated. Also the
expected return becomes zero (instead of 750 million). What is the new daily sigma for the fund?
What is the new annual sigma?
f. Under the assumptions of Question 5, what is the annual VaR at 1%?
180 Solnik/McLeavey • Global Investments, Sixth Edition