The Costs of Production 3303
34.
If a firm experiences constant returns to scale at all output levels, then its long-run average total
cost curve would
a.
slope downward.
b.
be horizontal.
c.
slope upward.
d.
slope downward for low output levels and upward for high output levels.
35.
When a firm’s long-run average total costs do not vary as output increases, the firm exhibits
a.
economies of scale.
b.
constant returns to scale.
c.
diseconomies of scale.
d.
an efficient use of resources.

36.
Suppose that a firm’s long–run average total costs of producing an individual income tax return is
$75 when it produces 1,000 returns and $75 when it produces 1,200 returns. For this range of
output, the firm is experiencing
a.
economies of scale.
b.
constant returns to scale.
c.
diseconomies of scale.
d.
specialization.
37.
In the long run a company that produces and sells dog beds incurs total costs of $1,200 when
output is 30 beds and $1,600 when output is 40 beds. Firm A exhibits
a.
diseconomies of scale because total cost is rising as output rises.
b.
constant returns to scale because average total cost is constant as output rises.
c.
diseconomies of scale because average total cost is rising as output rises.
d.
economies of scale because average total cost is falling as output rises.
38.
In the long run a company that produces and sells kayaks incurs total costs of $15,000 when
output is 30 kayaks and $20,000 when output is 40 kayaks. The kayak company exhibits
a.
diseconomies of scale because total cost is rising as output rises.
b.
constant returns to scale because average total cost is constant as output rises.
c.
diseconomies of scale because average total cost is rising as output rises.
d.
economies of scale because average total cost is falling as output rises.
39.
When a firm experiences diseconomies of scale,
a.
short–run average total cost is minimized.
b.
long–run average total cost is minimized.
c.
long-run average total cost increases as output increases.
d.
long-run average total cost decreases as output increases.
40.
When a firm is experiencing diseconomies of scale, long-run
a.
average total cost is minimized.
b.
average total cost is greater than long-run marginal cost.
c.
average total cost is less than long-run marginal cost.
d.
marginal cost is minimized.
41.
Diseconomies of scale occur when a firm’s
a.
marginal costs are constant as output increases.
b.
long-run average total costs are decreasing as output increases.
c.
long-run average total costs are increasing as output increases.
d.
marginal costs are equal to average total costs for all levels of output.
42.
Diseconomies of scale occur when
a.
average fixed costs are falling.
b.
average fixed costs are constant.
c.
long-run average total costs rise as output increases.
d.
long-run average total costs fall as output increases.
43.
In the long run, when marginal cost is above average total cost, the average total cost curve
exhibits
a.
economies of scale.
b.
diseconomies of scale.
c.
constant returns to scale.
d.
efficient scale.
44.
Firms may experience diseconomies of scale when
a.
they are too small to take advantage of specialization.
b.
large management structures are bureaucratic and inefficient.
c.
there are too few employees, and managers do not have enough to do.
d.
average fixed costs begin to rise again.
45.
In the long run a company that produces and sells covers for cell phones incurs total costs of
$2,500 when output is
1,250 covers and $4,000 when output is 1,500 covers. For this range of
output, the cell phone cover company exhibits
a.
economies of scale.
b.
constant returns to scale.
c.
diseconomies of scale.
d.
efficient scale.
46.
In the long run a company that produces and sells organic tofu incurs total costs of $1,200 when
output is 1,200 units
and $1,650 when output is 1,400 units. The tofu company exhibits
a.
diseconomies of scale because total cost is rising as output rises.
b.
diseconomies of scale because average total cost is rising as output rises.
c.
economies of scale because total cost is rising as output rises.
d.
economies of scale because average total cost is falling as output rises.
47.
Suppose that a firm’s long-run average total costs of producing small commuter jet airplanes
increases as it produces between 2,000 and 4,000 airplanes. For this range of output, the firm is
experiencing
a.
economies of scale.
b.
constant returns to scale.
c.
diseconomies of scale.
d.
specialization.
48.
Suppose that a firm’s long-run average total costs of producing custom wooden picnic tables is
$300 when it produces 10,000 tables and $325 when it produces 11,000 tables. For this range of
output, the firm is experiencing
a.
economies of scale.
b.
constant returns to scale.
c.
diseconomies of scale.
d.
specialization.
49.
Suppose that a firm’s long-run average total costs of producing hand-crafted chairs is $300 when
it produces 10,000 chairs and $325 when it produces 11,000 chairs. For this range of output, the
firm is likely experiencing
a.
economies of scale.
b.
constant returns to scale.
c.
specialization.
d.
coordination problems.
The Costs of Production 3311
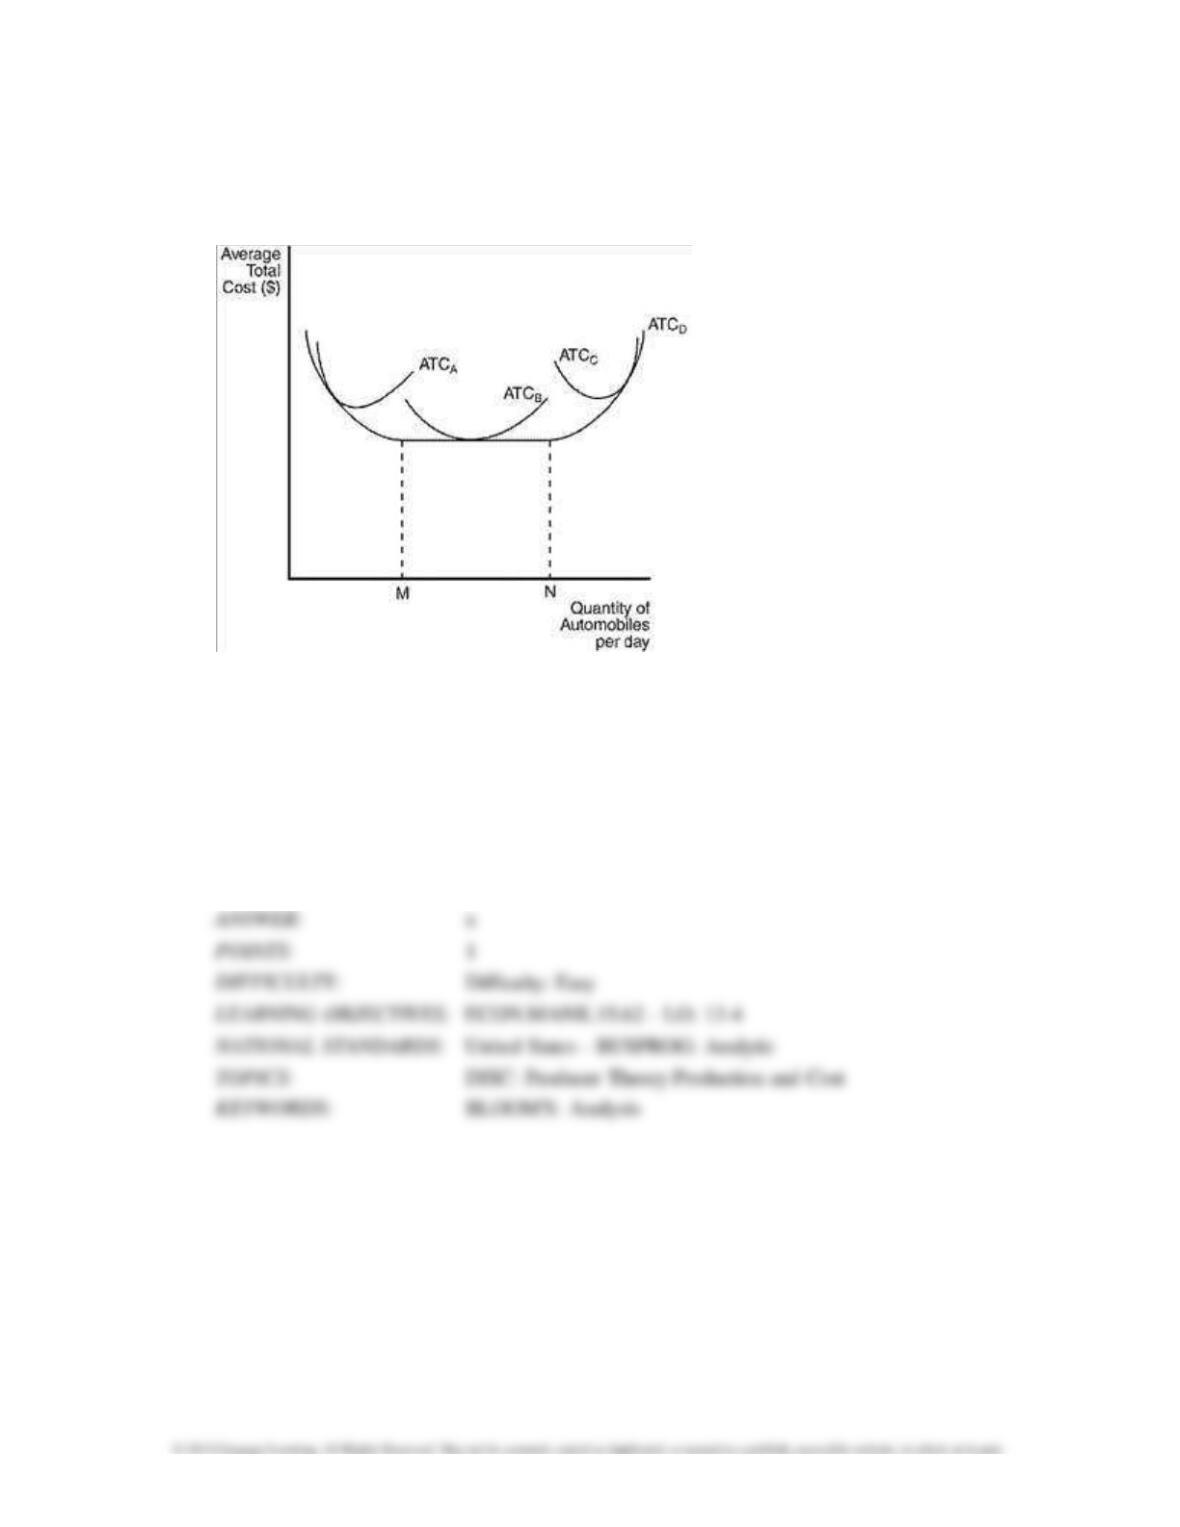
Figure 13-9
The figure below depicts average total cost functions for a firm that produces automobiles.
50.
Refer to Figure 13-9. Which of the curves is most likely to characterize the short-run average
total cost curve of
the smallest factory?
a.
ATCA
b.
ATCB
c.
ATCC
d.
ATCD
51.
Refer to Figure 13-9. Which curve represents the long–run average total cost?
a.
ATCA
b.
ATCB
c.
ATCC
d.
ATCD
52.
Refer to Figure 13-9. In the long run, the firm can operate on which of the following average
total cost curves?
a.
ATCA
b.
ATCB
c.
ATCC
d.
All of the above are correct.
53.
Refer to Figure 13-9. The firm experiences economies of scale at which output levels?
a.
output levels less than M
b.
output levels between M and N
c.
output levels greater than N
d.
All of the above are correct as long as the firm is operating in the long run.
54.
Refer to Figure 13-9. At levels of output less than M, the firm experiences
a.
economies of scale.
b.
diseconomies of scale.
c.
constant returns to scale.
d.
both diminishing marginal productivity and coordination problems.
55.
Refer to Figure 13-9. The firm experiences constant returns to scale at which output levels?
a.
output levels less than M
b.
output levels between M and N
c.
output levels greater than N
d.
All of the above are correct as long as the firm is operating in the long run.
3314 The Costs of Production
56.
Refer to Figure 13-9. At levels of output between M and N, the firm experiences
a.
economies of scale.
b.
diseconomies of scale.
c.
constant returns to scale.
d.
both the benefits of specialization and diminishing marginal productivity.
57.
Refer to Figure 13-9. This firm experiences diseconomies of scale at what output levels?
a.
output levels greater than N
b.
output levels between M and N
c.
output levels less than M
d.
All of the above are correct as long as the firm is operating in the long run.

The Costs of Production 3315
58.
Refer to Figure 13–9. At output levels greater than N, the firm experiences
a.
economies of scale.
b.
constant returns to scale.
c.
diseconomies of scale.
d.
minimum efficient scale.
3316 The Costs of Production
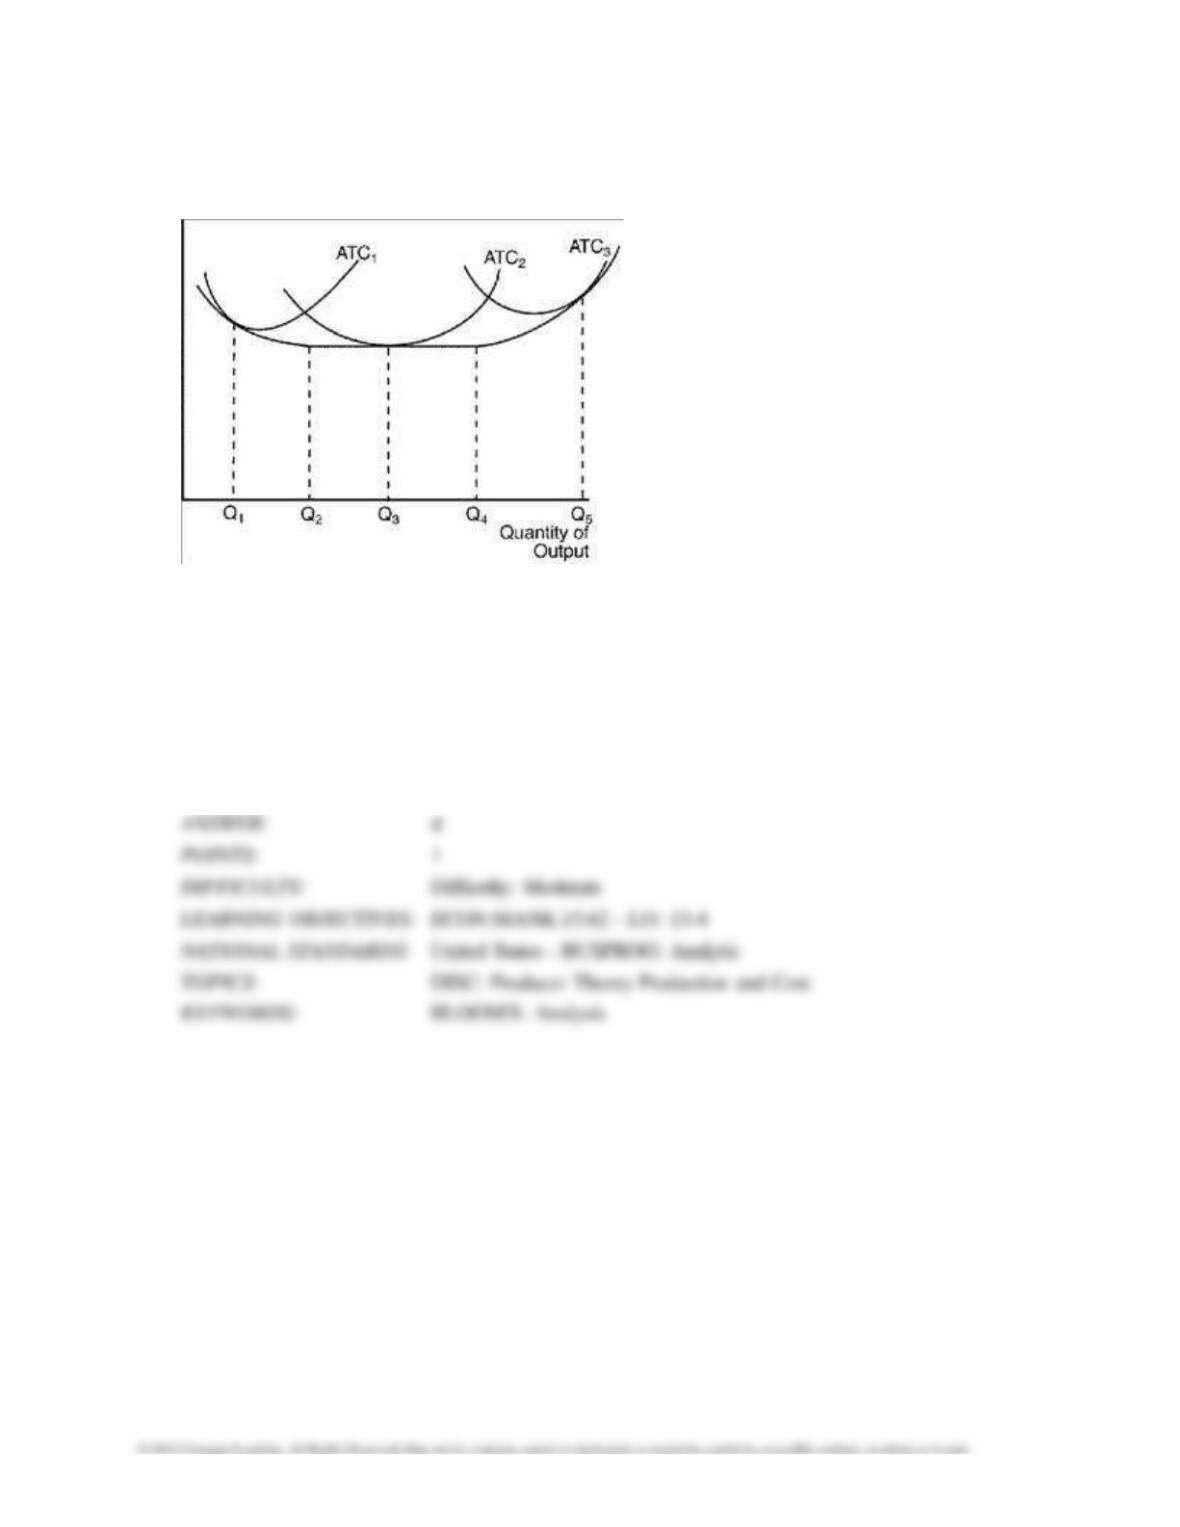
Figure 13–10
59.
Refer to Figure 13-10. The three average total cost curves on the diagram labeled ATC1,
ATC2, and ATC3 most
likely correspond to three different
a.
time horizons.
b.
products.
c.
firms.
d.
factory sizes.
The Costs of Production 3317
60.
Refer to Figure 13-10. The firm experiences economies of scale if it changes its level of output
from
a.
Q1 to Q2.
b.
Q2 to Q3.
c.
Q3 to Q4.
d.
Q4 to Q5.
61.
Refer to Figure 13-10. The firm experiences constant returns to scale if it changes its level of
output from
a.
Q1 to Q2.
b.
Q2 to Q4.
c.
Q1 to Q3.
d.
Q4 to Q5.
3318 The Costs of Production
62.
Refer to Figure 13–10. The firm experiences diseconomies of scale if it changes its level of
output from
a.
Q1 to Q2.
b.
Q2 to Q3.
c.
Q3 to Q4.
d.
Q4 to Q5.
Table 13–16
Listed in the table are the long–run total costs for three different firms.
Quantity
1
2
3
4
5
Firm A
100
100
100
100
100
Firm B
100
200
300
400
500
Firm C
100
300
600
1,000
1,500
63.
Refer to Table 13–16. Which firm is experiencing diseconomies of scale?
a.
Firm A only
b.
Firm B only
c.
Firm C only
d.
Firm A and Firm B only
64.
Refer to Table 13–16. Which firm is experiencing constant returns to scale?
a.
Firm A only
b.
Firm B only
c.
Firm C only
d.
Firm A and Firm B only
Table 13–17
Consider the following table of long–run total cost for four different firms:
Quantity
1
2
3
4
5
6
7
Firm 1
$180
$350
$510
$660
$800
$930
$1,050
Firm 2
$120
$250
$390
$540
$700
$870
$1,050
Firm 3
$150
$300
$450
$600
$750
$900
$1,050
Firm 4
$210
$340
$490
$660
$850
$1,060
$1,290
65.
Refer to Table 13-17. Which firm has constant returns to scale over the entire range of output?
a.
Firm 1
b.
Firm 2
c.
Firm 3
d.
Firm 4
66.
Refer to Table 13-17. Which firm has diseconomies of scale over the entire range of output?
a.
Firm 1 only
b.
Firm 2 only
c.
Firms 1 and 2 only
d.
Firm 3 only
67.
Refer to Table 13-17. Which firm has economies of scale over the entire range of output?
a.
Firm 1 only
b.
Firms 1 and 2 only
c.
Firm 2 only
d.
Firm 3 only
68.
Refer to Table 13-17. Which firm has economies of scale and then diseconomies of scale as
output increases from
1 to 7?
a.
Firm 1
b.
Firm 2
c.
Firm 3
d.
Firm 4
69.
Refer to Table 13-17. Which firm’s long-run marginal cost decreases as output increases?
a.
Firm 1
b.
Firm 2
c.
Firm 3
d.
Firm 4

70.
Refer to Table 13-17. Firm 4′s efficient scale occurs at what quantity?
a.
2
b.
3
c.
4
d.
5
Multiple Choice – Section 04: Costs in the Short Run and in the Long Run
1.
Adam Smith used a famous example of what type of firm to illustrate economies of scale?
a.
Apple
b.
a pin factory
c.
a lumber mill
d.
a British university